Bài Tập Kinh Tế Sản Xuất Hàng Hóa | Microeconomics | Trường Đại học Quốc tế, Đại học Quốc gia Thành phố Hồ Chí Minh
To produce 12 thousand more guided missiles, the economy gives up 2 million cars. Therefore, the opportunity costs of 1 thousand more guided missiles is 2/12 = 1/6 million cars.- From D to C: The opportunity costs of 1 thousand more guided missiles is 2/9 million cars. - From C to B: The opportunity costs of 1 thousand more guided missiles is 2/6 = 1/3 million cars. Tài liệu được sưu tầm và soạn thảo dưới dạng file PDF để gửi tới các bạn cùng tham khảo, ôn tập đầy đủ kiến thức, chuẩn bị cho các buổi học thật tốt. Mời bạn đọc đón xem!
Môn: Microeconomics 613 tài liệu
Trường: Trường Đại học Quốc tế, Đại học Quốc gia Thành phố Hồ Chí Minh 1.9 K tài liệu
Tác giả:
Preview text:
Group assignment presentation 1 Group 4: Lê Hồng Phong Nguyễn Bá Trường Đỗ Thị Huyền Phạm Kiều Linh
Exercise 1. Use the following production possibilities table for war goods and
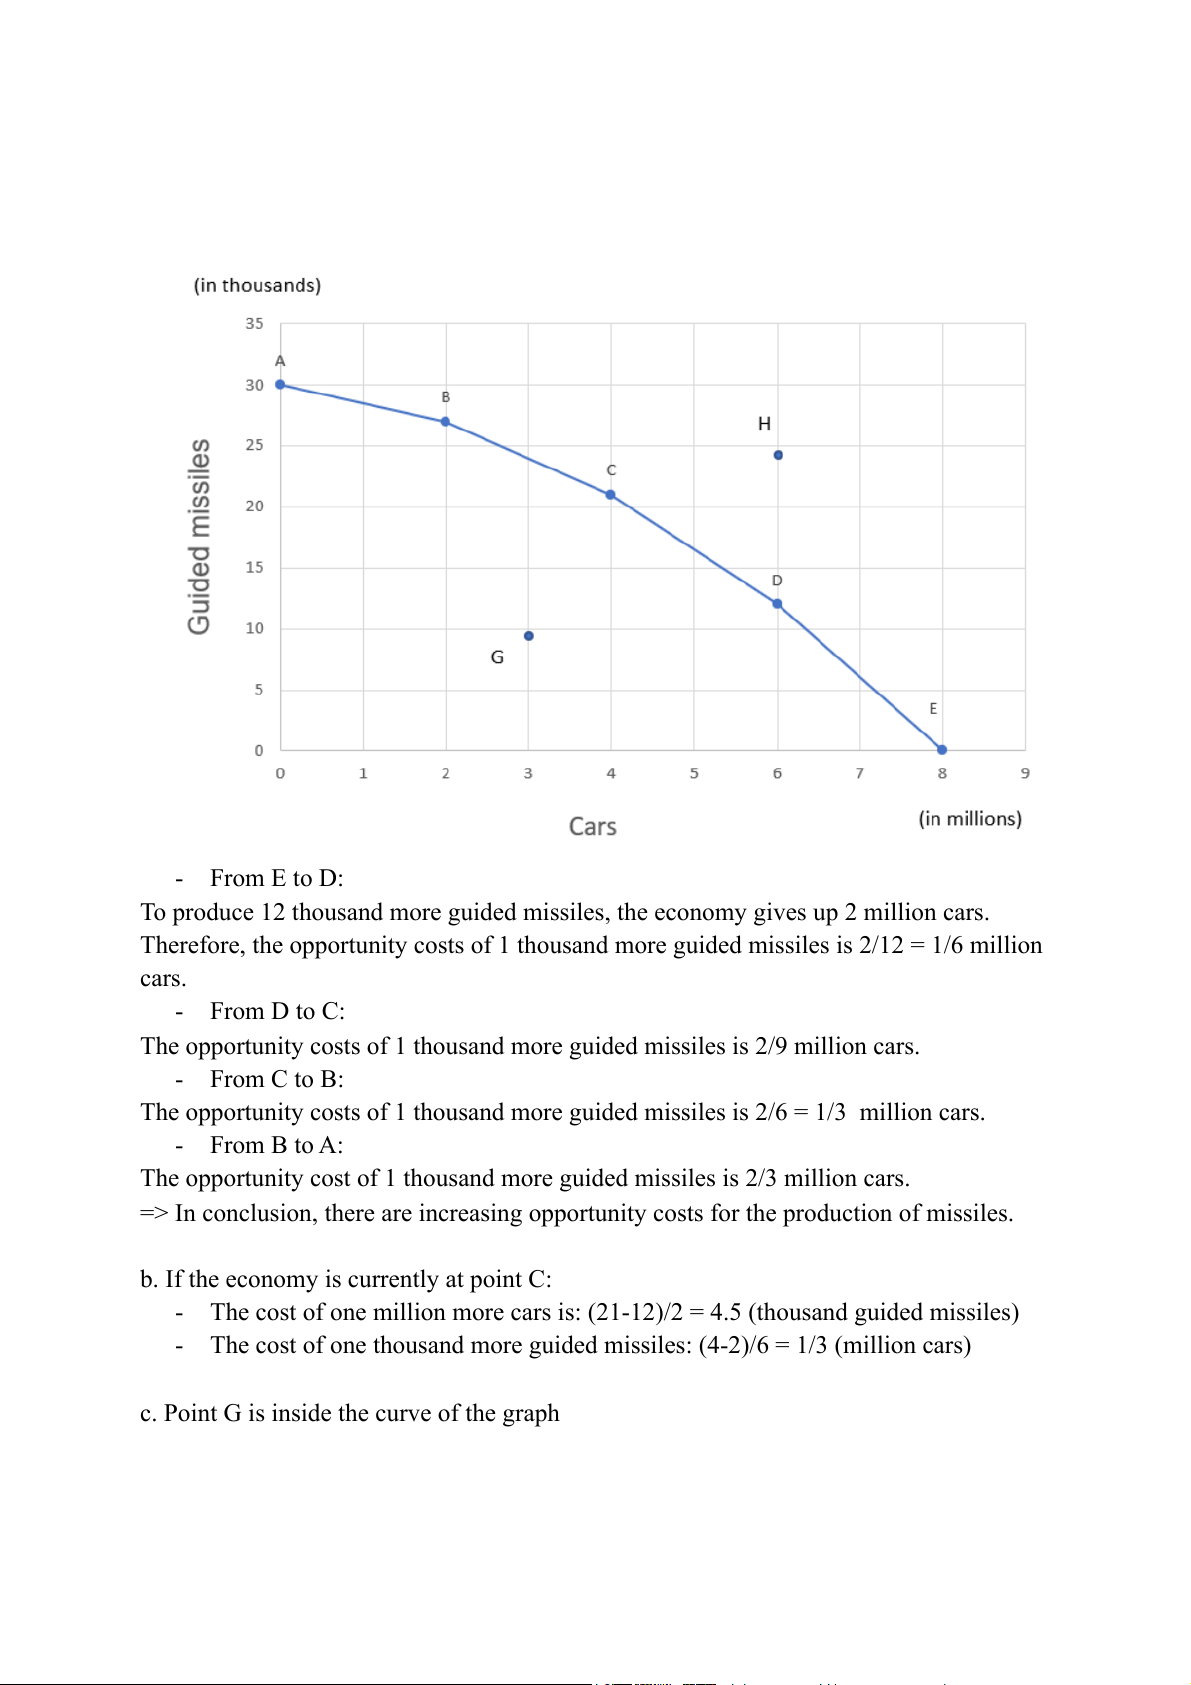
civilian goods to answer questions a to e. Production alternatives Types of A B C D E product Cars (in 0 2 4 6 8 millions) Guided missiles 30 27 21 12 0 (in thousands)
a. Graph the data in the table. Are there constant or increasing opportunity costs for the production of missiles? - From E to D:
To produce 12 thousand more guided missiles, the economy gives up 2 million cars.
Therefore, the opportunity costs of 1 thousand more guided missiles is 2/12 = 1/6 million cars. - From D to C:
The opportunity costs of 1 thousand more guided missiles is 2/9 million cars. - From C to B:
The opportunity costs of 1 thousand more guided missiles is 2/6 = 1/3 million cars. - From B to A:
The opportunity cost of 1 thousand more guided missiles is 2/3 million cars.
=> In conclusion, there are increasing opportunity costs for the production of missiles.
b. If the economy is currently at point C:
- The cost of one million more cars is: (21-12)/2 = 4.5 (thousand guided missiles)
- The cost of one thousand more guided missiles: (4-2)/6 = 1/3 (million cars)
c. Point G is inside the curve of the graph
=> It indicates that the economy's production is inefficient because it doesn’t take advantage of all resources.
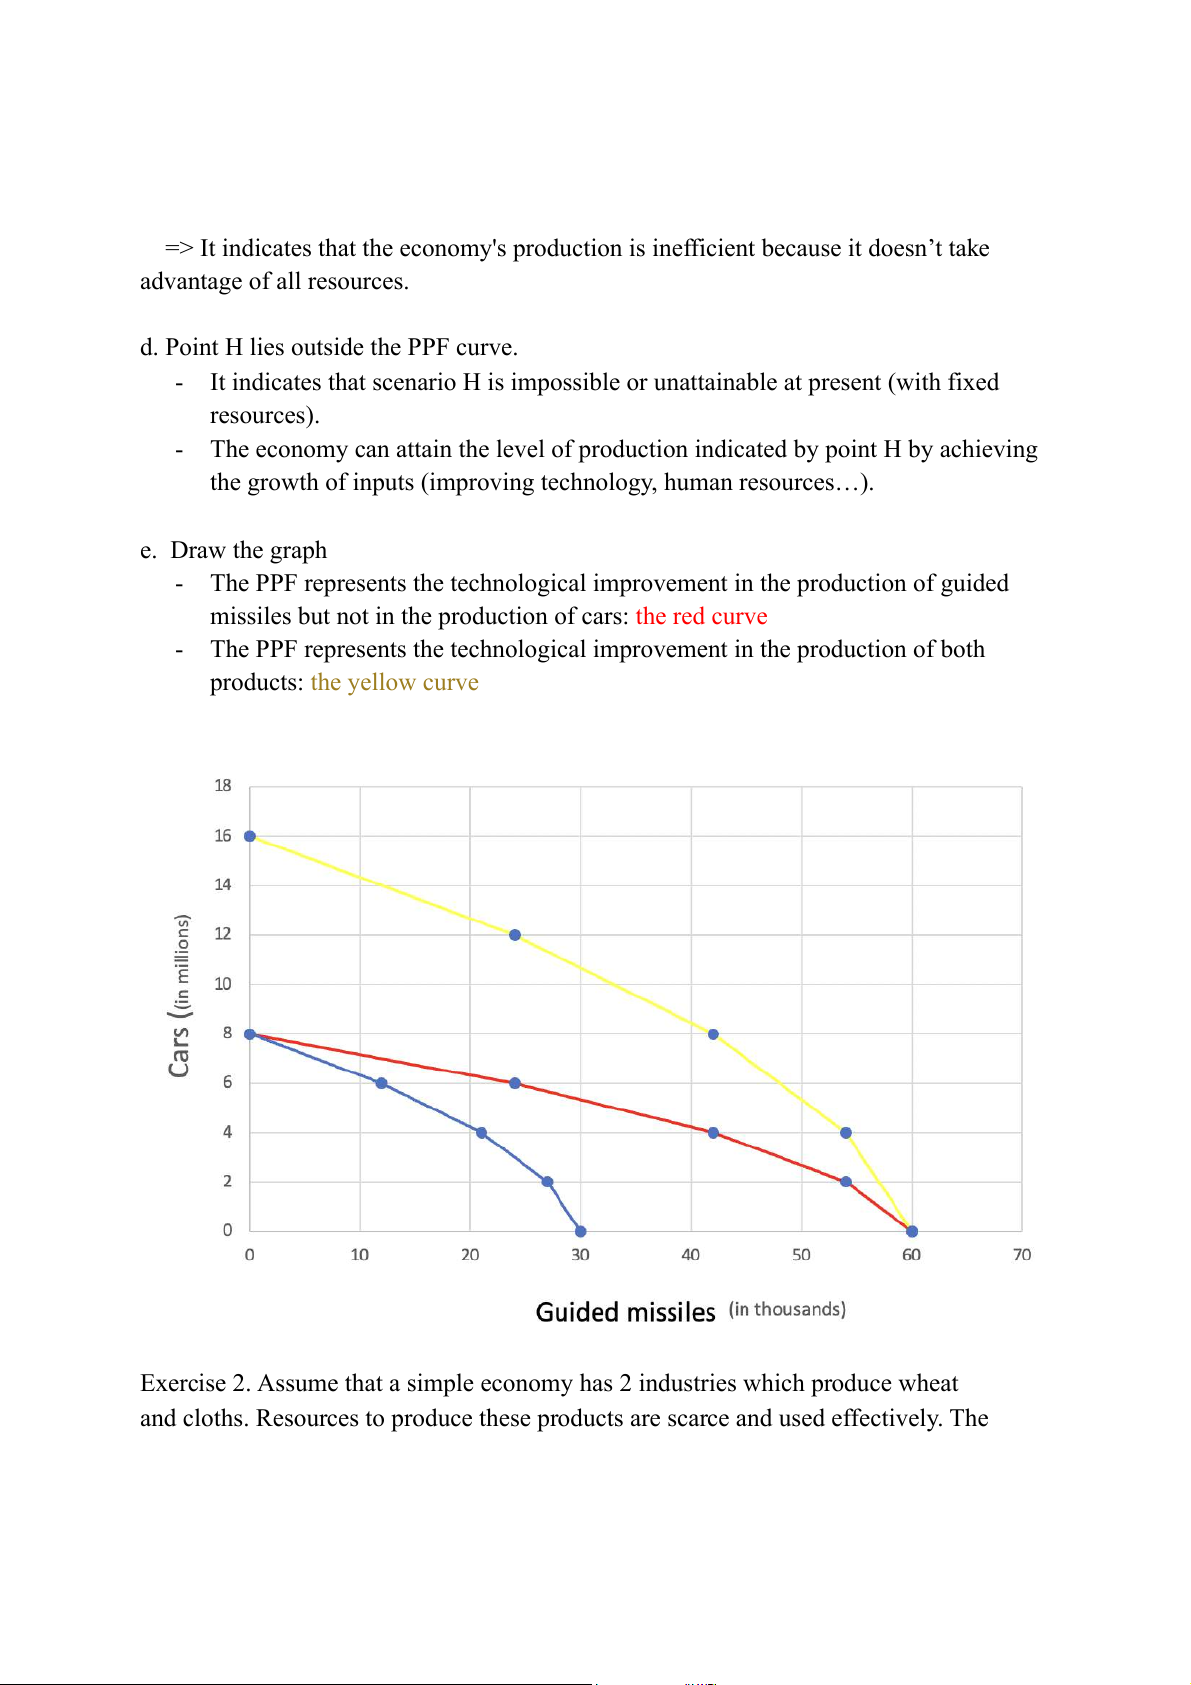
d. Point H lies outside the PPF curve.
- It indicates that scenario H is impossible or unattainable at present (with fixed resources).
- The economy can attain the level of production indicated by point H by achieving
the growth of inputs (improving technology, human resources…). e. Draw the graph
- The PPF represents the technological improvement in the production of guided
missiles but not in the production of cars: the red curve
- The PPF represents the technological improvement in the production of both products: the yellow curve
Exercise 2. Assume that a simple economy has 2 industries which produce wheat
and cloths. Resources to produce these products are scarce and used effectively. The
following table represents the possible combinations of output between wheat and
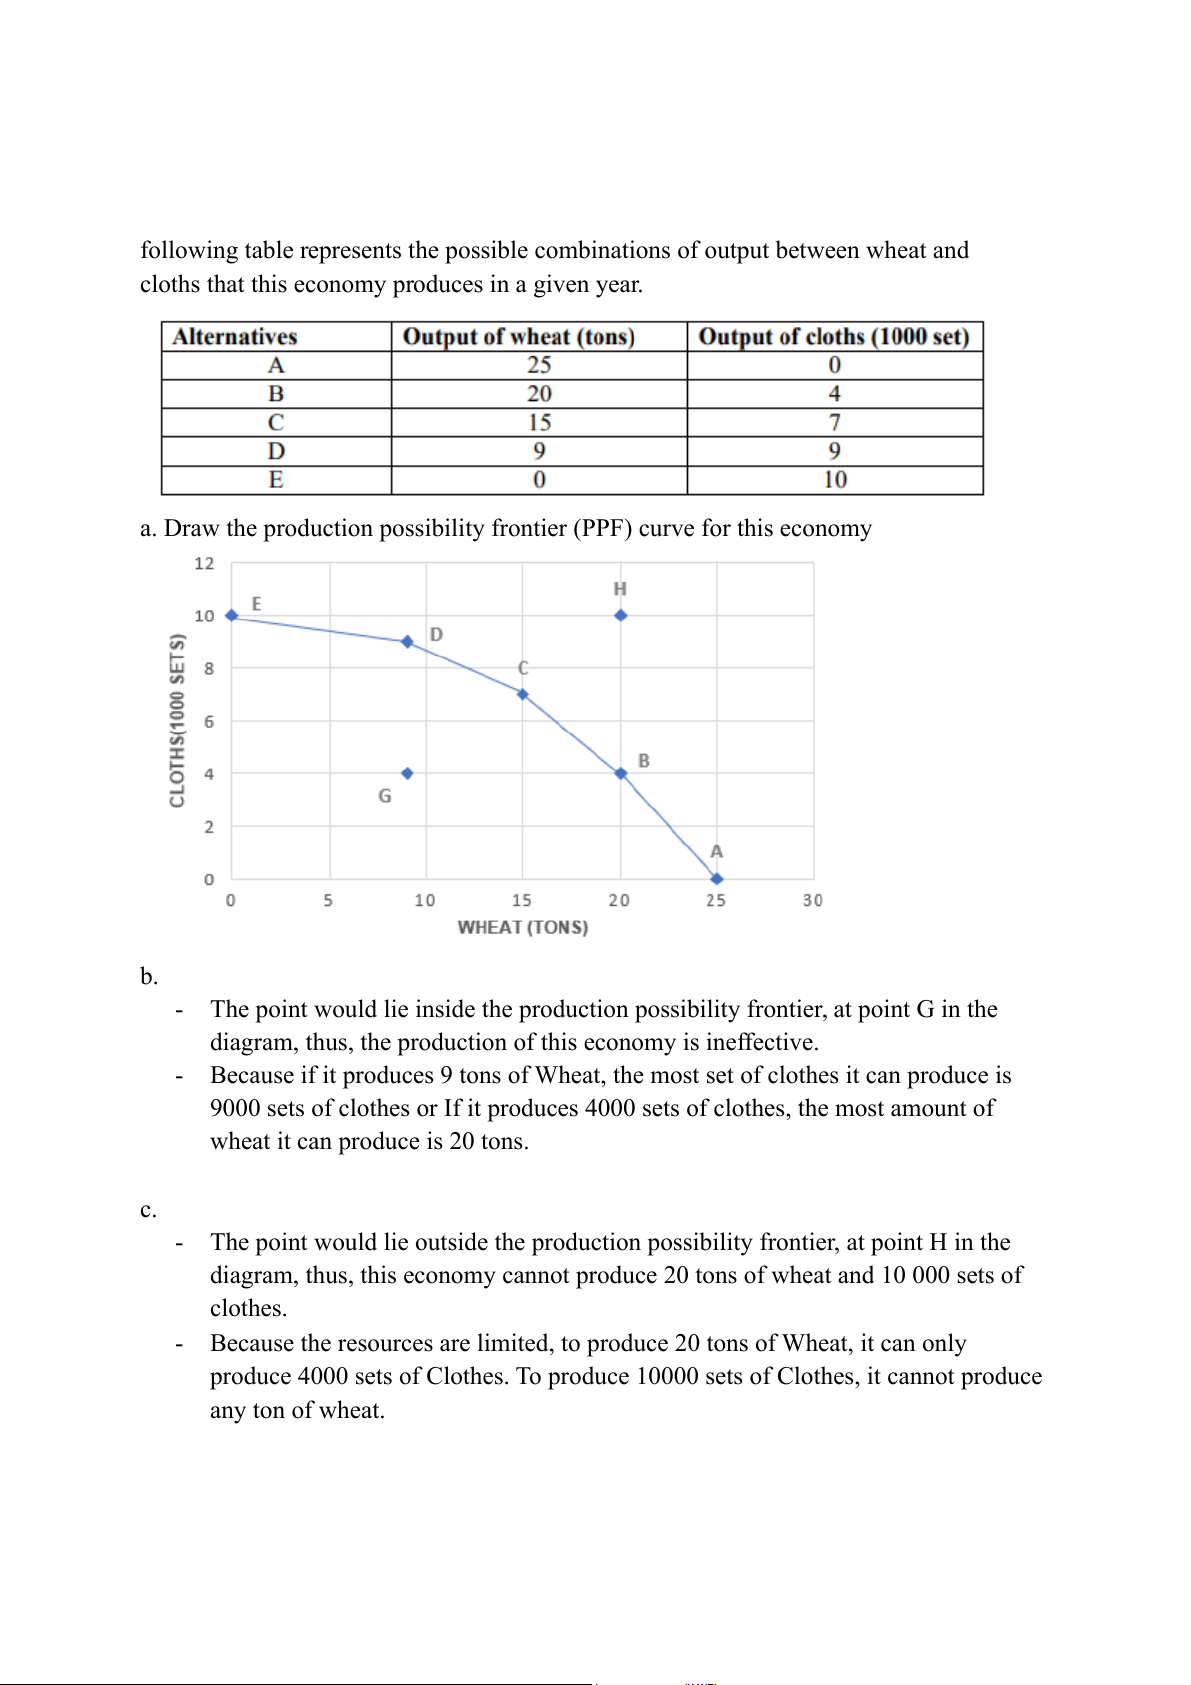
cloths that this economy produces in a given year.
a. Draw the production possibility frontier (PPF) curve for this economy b.
- The point would lie inside the production possibility frontier, at point G in the
diagram, thus, the production of this economy is ineffective.
- Because if it produces 9 tons of Wheat, the most set of clothes it can produce is
9000 sets of clothes or If it produces 4000 sets of clothes, the most amount of
wheat it can produce is 20 tons. c.
- The point would lie outside the production possibility frontier, at point H in the
diagram, thus, this economy cannot produce 20 tons of wheat and 10 000 sets of clothes.
- Because the resources are limited, to produce 20 tons of Wheat, it can only
produce 4000 sets of Clothes. To produce 10000 sets of Clothes, it cannot produce any ton of wheat. d.
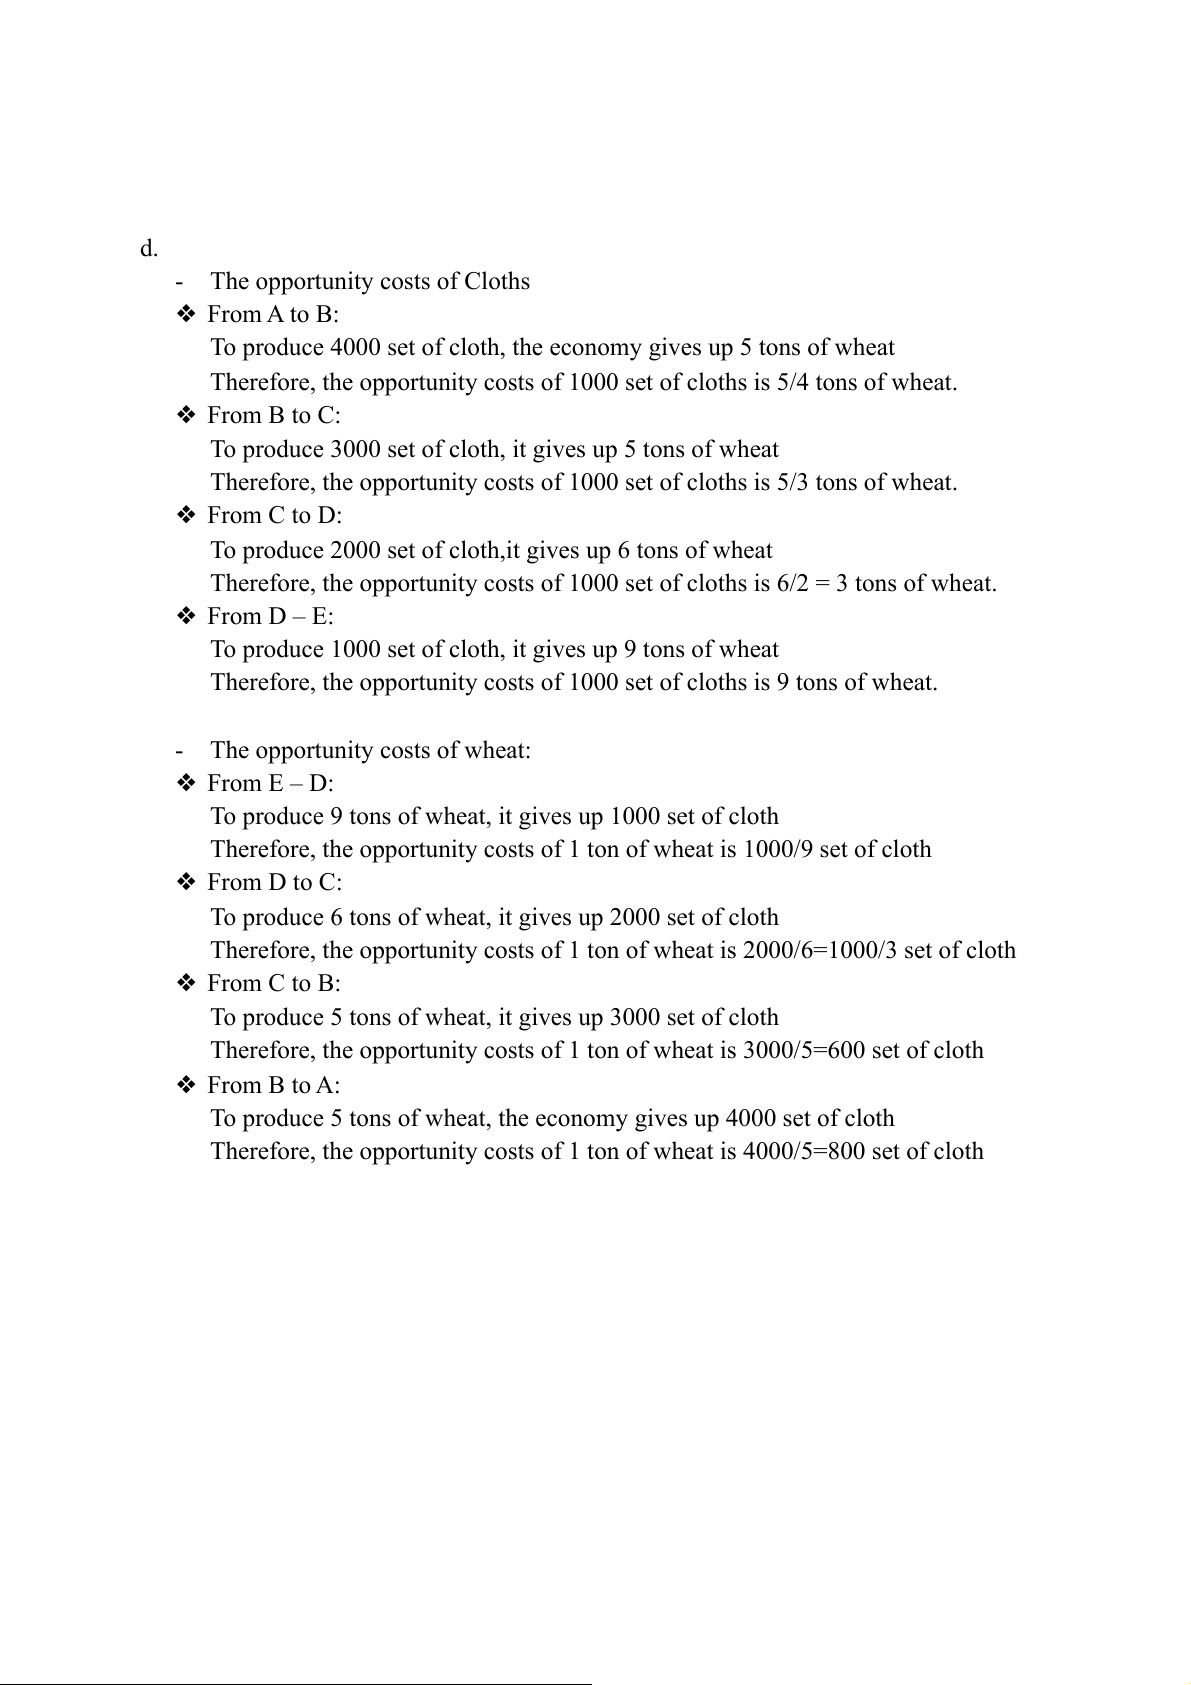
- The opportunity costs of Cloths ❖ From A to B:
To produce 4000 set of cloth, the economy gives up 5 tons of wheat
Therefore, the opportunity costs of 1000 set of cloths is 5/4 tons of wheat. ❖ From B to C:
To produce 3000 set of cloth, it gives up 5 tons of wheat
Therefore, the opportunity costs of 1000 set of cloths is 5/3 tons of wheat. ❖ From C to D:
To produce 2000 set of cloth,it gives up 6 tons of wheat
Therefore, the opportunity costs of 1000 set of cloths is 6/2 = 3 tons of wheat. ❖ From D – E:
To produce 1000 set of cloth, it gives up 9 tons of wheat
Therefore, the opportunity costs of 1000 set of cloths is 9 tons of wheat.
- The opportunity costs of wheat: ❖ From E – D:
To produce 9 tons of wheat, it gives up 1000 set of cloth
Therefore, the opportunity costs of 1 ton of wheat is 1000/9 set of cloth ❖ From D to C:
To produce 6 tons of wheat, it gives up 2000 set of cloth
Therefore, the opportunity costs of 1 ton of wheat is 2000/6=1000/3 set of cloth ❖ From C to B:
To produce 5 tons of wheat, it gives up 3000 set of cloth
Therefore, the opportunity costs of 1 ton of wheat is 3000/5=600 set of cloth ❖ From B to A:
To produce 5 tons of wheat, the economy gives up 4000 set of cloth
Therefore, the opportunity costs of 1 ton of wheat is 4000/5=800 set of cloth
Tài liệu liên quan:
-
Tự Luận Vimo: Phân Tích Cung, Cầu và Thị Trường Cạnh Tranh| Microeconomics | Trường Đại học Quốc tế, Đại học Quốc gia Thành phố Hồ Chí Minh
5 3 -
Review Questions: Thinking Like an Economist | Microeconomics | Trường Đại học Quốc tế, Đại học Quốc gia Thành phố Hồ Chí Minh
5 3 -
Final Exam Quizlet Questions & Answers | Microeconomics | Trường Đại học Quốc tế, Đại học Quốc gia Thành phố Hồ Chí Minh
5 3 -
Đề thi giữa kỳ II | Microeconomics | Trường Đại học Quốc tế, Đại học Quốc gia Thành phố Hồ Chí Minh
5 3 -
Final Group Project_ The Beer Industry | Microeconomics | Trường Đại học Quốc tế, Đại học Quốc gia Thành phố Hồ Chí Minh
4 2