Case Study 1.3: Correlation of Antioxidant Activity in Indonesian Herbs | Môn Microbiology - Trường Đại học Quốc tế, Đại học Quốc gia Thành phố Hồ Chí Minh
The antioxidant activity (AA), total phenolic content (TPC), and total flavonoid content (TFC) of selected Indonesian Zingiberaceae herbs were determined. Tài liệu được sưu tầm gồm 15 trang, giúp bạn ôn tập tốt hơn. Mời các bạn đón xem.
Môn: Microbiology 10 tài liệu
Trường: Trường Đại học Quốc tế, Đại học Quốc gia Thành phố Hồ Chí Minh 1.9 K tài liệu
Tác giả:


Preview text:
lOMoAR cPSD| 58504431 antioxidants Article
Correlation Study of Antioxidant Activity with Phenolic and
Flavonoid Compounds in 12 Indonesian Indigenous Herbs
Yeni Maulidah Muflihah 1,2 , Ganesh Gollavelli 3 and Yong-Chien Ling 1,*
under the terms and conditions of the Creative Commons Attribution (CC BY) license (https:// creativecommons.org/licenses/by/ 4.0/).
Citation: Muflihah, Y.M.; Gollavelli, 1
Department of Chemistry, National Tsing Hua University, Hsinchu 30013, Taiwan; yeni.maulidah.fmipa@unej.ac.id
G.; Ling, Y.-C. Correlation Study of 2
Department of Chemistry, Faculty of Mathematics and Natural Sciences, University of Jember, Jember 68132,
Antioxidant Activity with Phenolic and 2021 10
Flavonoid Compounds in 12 Indonesian Indonesia Indigenous Herbs. 3
Department of Humanities and Basic Sciences, Faculty of Engineering Chemistry, Aditya Engineering College,
Antioxidants 2021, 10, 1530. https://
Surampalem, Jawaharlal Nehru Technological University, Kakinada 533437, India; ganeshg@aec.edu.in
doi.org/10.3390/antiox10101530 *
Correspondence: ycling@mx.nthu.edu.tw; Tel.: +886-35-715-131 (ext. 33393); Fax: +886-35-727-774 Academic Editor:
Abstract: The antioxidant activity (AA), total phenolic content (TPC), and total flavonoid content (TFC) of David Arráez-Román
selected Indonesian Zingiberaceae herbs were determined. An optimization extraction procedure was
conducted by using Taguchi L16 orthogonal array. Four chemical assays were applied, including 2,2-diphenyl- Received: 15 August 2021
2-picrylhydrazyl (DPPH) radical scavenging activity assay, H Accepted: 24 September 2021
2O2 scavenging activity assay, Folin–Ciocalteau (F– C) assay, and NaNO Published: 27 September 2021
2-AlCl3-NaOH assay, which revealed remarkable differences in AA, TPC, and TFC. The
result indicated the diversity of AA composition among the herbs, and C. longa exhibited the highest AA.
Publisher’s Note: MDPI stays neutral with
HPLC-PAD analysis revealed that curcumin was present in five high antioxidant herbs, and the highest
regard to jurisdictional claims in published
amount was in C. longa. Pearson correlation analysis indicated that the identified TPC and TFC were
maps and institutional affiliations.
significant contributors to AA, and curcumin was likely the main contributing antioxidant compound. Our
approach concluded that C. longa is the greatest source of natural antioxidants among 12 Indonesian
indigenous Zingiberaceae herbs. The use of a mixed-method approach to augment the findings of solitary
methods might facilitate future researchers to uncover deeper and hidden meanings.
Copyright: © 2021 by the authors.
Licensee MDPI, Basel, Switzerland. This
Keywords: antioxidant activity; correlation analysis; flavonoid; Indonesian herbs; phenolic; mixedmethod
article is an open access article distributed
Synthetic antioxidants are ineffective in some formulations because of their instability and low
absorption in the aqueous media. Furthermore, some active ingredients in synthetic antioxidants
might exhibit contradictory reactions leading to problems such as allergies, irritant contact
dermatitis, phototoxicity, and photo allergies [7,8]. Natural plant antioxidants and their
derivatives used in anti-aging cosmetics exhibit better performance and less toxicity over
synthetic antioxidants and are gaining interest worldwide [2,9].
Indonesia, located in Southeast Asia, inherits rich biodiversity and traditional medicine. Around 2500–7500 plant species out
of 30,000–40,000 plant species are medicinal plants [10]. The Indonesian indigenous Zingiberaceae herb family is the most
widely applied and known for its potency as a natural antioxidant. These plants contain mainly phenolics, terpenoids, and
1 . Introduction
The antioxidants are generally known as natural or synthetic compounds which avoid or prolong the damage of cells in
the presence of reactive oxygen by opposing the oxidation process or inhibiting the reaction promoted by oxide or peroxide
species, mostly known as free radical oxygen species [1]. The free radicals generated during cell metabolism will be deactivated
and stabilized by the antioxidants before and after attacking the targets in the biological system [2]. Effective antioxidants break
down the radical chain reaction and act as radical scavengers [1,3]. Antioxidants therefore play a predominant role as stabilizers
to maintain biological functions without fail.
Antioxidants are from either natural or synthetic source. Natural plant extracts are usually rich in antioxidants, which are
good sources for food additives, medicine, and cosmetics purposes [4]. In food, antioxidants are needed to prevent food
deterioration during storage or processing and maintain the food quality of freshness, nutrients, texture, aroma, and functionality
[5]. Antioxidants are present in food itself or by external addition. In medicinal use, antioxidant activity is generally due to their
ability to exhibit radical scavenging capacities. The phytochemicals such as phenolics, flavonoids, anthocyanins, carotenoids,
ascorbic acids, terpenoids, tannins, and tocopherols in medicinal plants are known for preventing and curing disease [6]. In
cosmetics, the effective use of topical antioxidants to improve the protection system of endogenous cutaneous is well known [7]. lOMoAR cPSD| 58504431
alkaloids [11,12]. Studies investigating Zingiberaceae as prospective antioxidant sources have increased significantly. The
antioxidant activity (AA) property of Zingiberaceae plants is related to their chemical composition primarily attributed to their
richness in total phenolic content (TPC), total flavonoid content (TFC), terpenoids, alkaloids, and organic acids, with curcumin
as the main antioxidant constituent in most of the plants from this family [3,11,13,14]. Ultrasonic extraction [15] is one of the
prominent extraction techniques along with supercritical fluid extraction [16], microwave-assisted extraction [17], and hot water extraction [18].
The purpose of this study was to determine the AA as well as the TPC and TFC by chemical assays in 12 Indonesian indigenous
Zingiberaceae herbs, to find promising natural antioxidants for future use in diverse fields such as food, medicine, and
cosmetics. It was desirable to select the specific assay based on fitness for purpose. For example, cell lines testing might be
needed for cosmetic purpose. Herein, we used a mixed-method approach [19] integrating both qualitative and quantitative
methods for sample collection, chemical analysis, correlation analysis, and result interpretation. Optimum ultrasonic extraction
conditions efficiently obtained via Taguchi experiment design [20] was adopted for antioxidant extraction first. The preliminary
chemical assay results were further confirmed by high-performance liquid chromatograph−photodiode array detector (HPLC-
PAD) instrumental analysis and correlation analysis to find out the major active compounds and components causative to the AA.
2. Materials and Methods
2.1. Chemicals and Reagents
All chemicals of either LC grade or analytical grade have been purchased from various suppliers. In brief, 2,2-diphenyl-2-
picrylhydrazyl (DPPH, ≥99%), Folin–Ciocalteau reagent, formic acid (ACS reagent purist. p.a.), aluminum chloride anhydrous,
ethanol (LC grade, 99%), sodium phosphate dibasic (99%), hydrogen peroxide (technical, 30% (w/w), in water), and sodium
phosphate monobasic (99%), were purchased from Sigma Aldrich (St. Louis, MO, USA); gallic acid monohydrate (ACS reagent,
98%), naringin, curcumin (≥99%), and quercetin (≥95% HPLC, solid) were from Fluka (Buchs, Switzerland); ascorbic acid and
methanol were from Tedia (Fairfield, OH, USA). Ferulic acid was from TCI (Tokyo, Japan), chlorogenic acid was from Acros organic
(Schwerte, Germany); sodium hydroxide was from Macron Fine Chemicals (Lehigh, PA, USA); sodium carbonate anhydrous was
from Merck (Darmstadt, Germany); and sodium nitrite from Showa (Tokyo, Japan).
2.2. Herb Sample Collection and Preparation
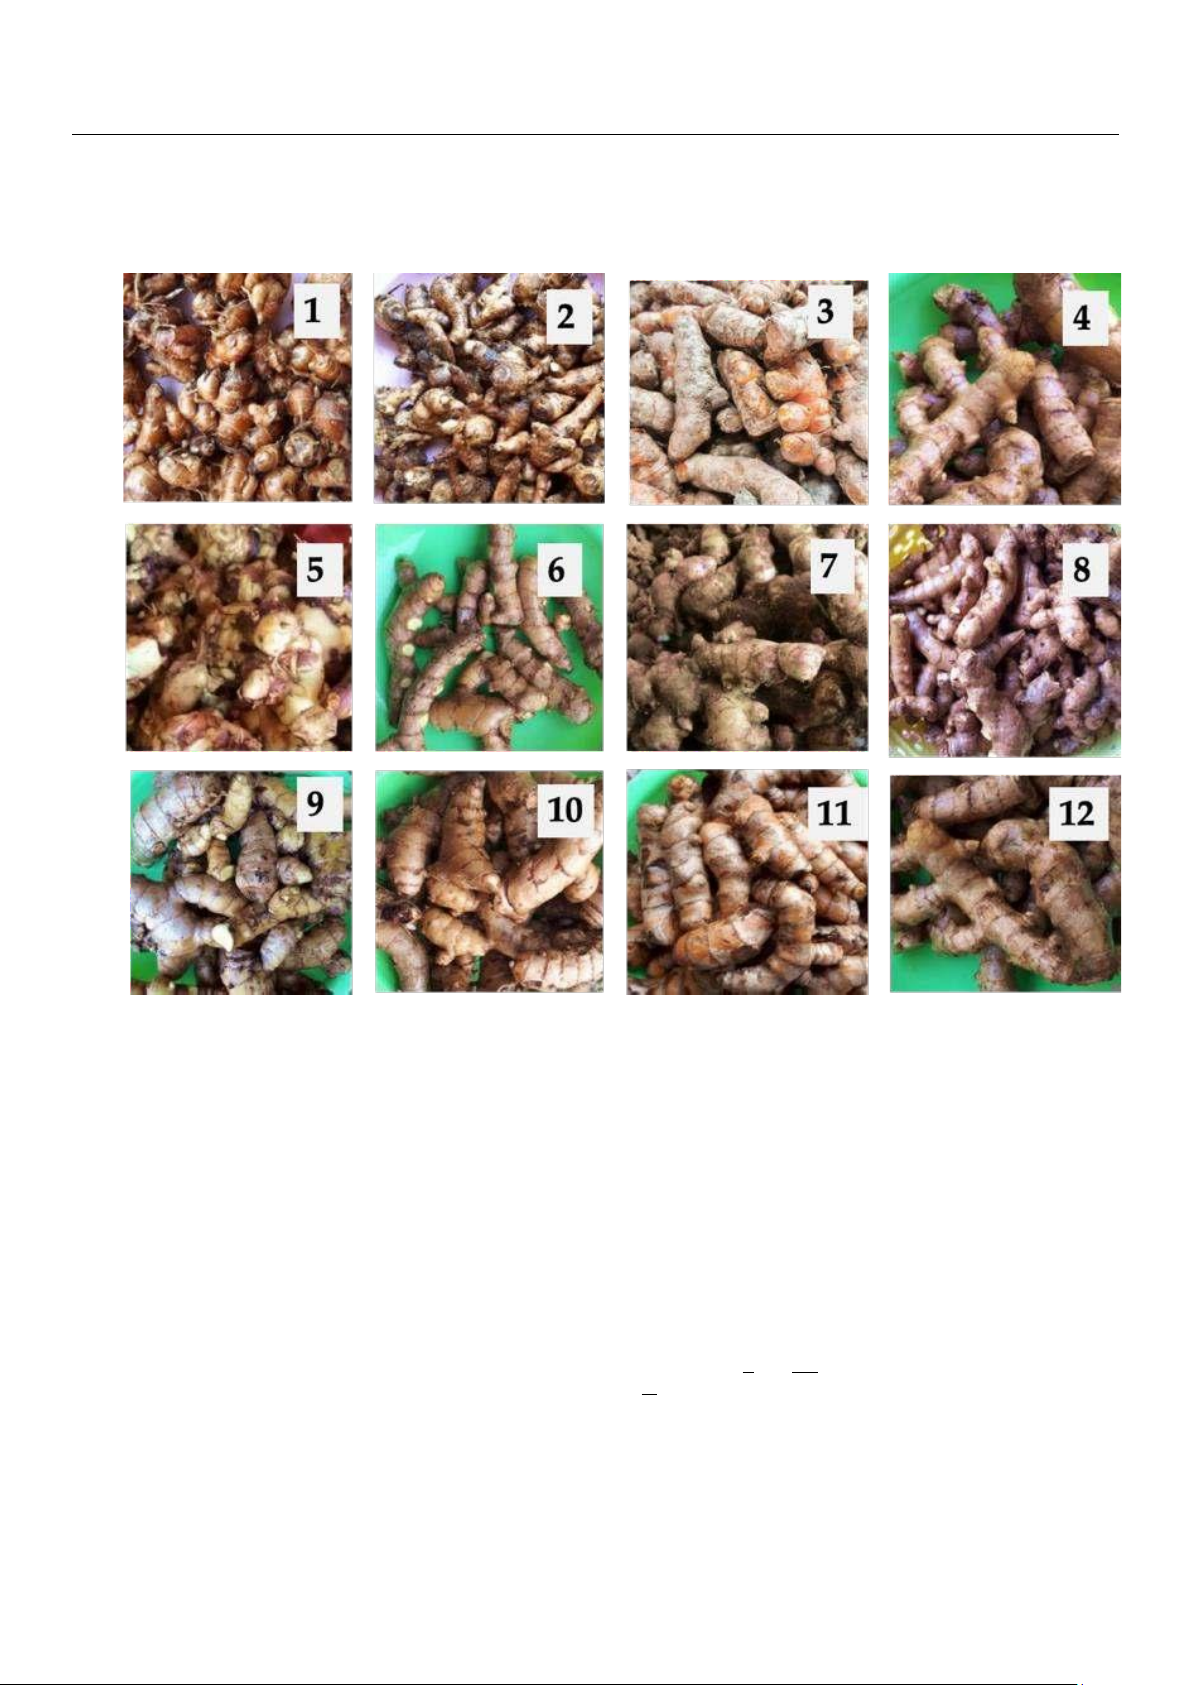
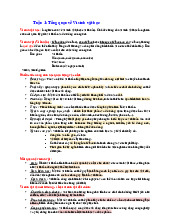
The rhizome part of Zingiberaceae species of 12 Indonesian indigenous herbs traditionally used in cosmetics and medicines
was used. The species included Zingiber officinale (Z. officinale), Zingiber zerumbet (Z. zerumbet), Zingiber cassumunar (Z.
cassumunar), Curcuma aeruginosa (C. aeruginosa), Curcuma xanthorrhiza (C. xanthorrhiza), Curcuma longa (C. longa),
Curcuma manga (C. manga), Curcuma heynana (C. heynana), Curcuma zedoaria (C. zedoaria), Alpinia purpurata (A.
purpurata), Boesenbergia rotunda (B. rotunda), and Kaempferia galangal
(K. galangal) (Figure 1), and all were purchased in August 2018 at a traditional market in Jember, East Java, Indonesia. Before
extraction, the samples were cleaned, chopped, dried lOMoAR cPSD| 58504431
Antioxidants 2021, 10, 1530 2 of 15
for two days, grinded into powder, and stored in vacuum plastic bags. The water content of the samples was determined by
using an oven at 105 ◦C in triplicate.
Figure 1. The rhizome part of 12 Indonesian indigenous Zingiberaceae species herbs: (1) K. galanga, (2) B. rotunda, (3) C. longa,
(4) Z. cassoumounar, (5) C. heynana, (6) A. purpurata, (7) Z. officinale, (8) Z. zerumbet, (9) C. manga, (10) C. aeruginosa, (11) C.
xanthorrhiza, and (12) C. zedoaria.
2.3. Taguchi Experimental Design for Ultrasonic Extraction
A popular Taguchi L16 orthogonal array experimental design was adopted to find the optimum ultrasonic extraction [15]. This
design involved three variable factors (ethanol concentration, extraction time, and solid-to-liquid ratio), each at four levels,
with a total of 16 experimental measurements using C. zedoaria as a representative sample. Three fixed factors were
temperature (32 ◦C), frequency of the ultrasonic bath (40 Hz), and volume of ethanol added (10 mL). Our primary goal was
to identify herbs with high AA by a mixed-method approach; we therefore focused on AA optimization first. The larger-
thebetter signal-to-noise ratio (SN ratio) for AA was selected to find the optimum extraction conditions, and described as follows: S 1 i=n 1
N =−10 log(n i∑=1 yi2 ) (1)
where yi denotes the ith measured AA, and n is the total number of measurements.
The appropriate amounts of powdered samples were weighed and soaked with different concentrations (50%, 60%, 70%,
and 80%) of 10 mL ethanol in a tube and ultrasonically extracted in an ultrasonic bath Delta DC150H (Delta Ultrasonic CO.,
Ltd., Taiwan). The obtained extracts were filtered by using Whatman™ no. 42 filter paper and dried using N2 fluxes. The dried lOMoAR cPSD| 58504431
Antioxidants 2021, 10, 1530 3 of 15
extract was then weighed (approximately 2–5 mg); an aliquot of 10 mL 99% methanol was added, vortexed, and filtered by
using a PTFE 0.22 µm syringe filter. The herb extract stock solutions were stored in glass containers at 4 ◦C prior to analysis.
2.4. Determination of Antioxidant Activity
The antioxidant activity (AA) was determined by using both DPPH free radical and H2O2 scavenging activity assays. In the
following, AA represented the measured AA by DPPH free radical scavenging assay result, whereas AA (H2O2) represented the
H2O2 scavenging activity assay result as a comparison use.
In the DPPH free radical scavenging assay, prior to AA determination, 0.2 mL herb extract stock solution was diluted with
0.2 mL of 15% methanol to yield 10 mg/mL herb extract solution. The 0.5 mg/L test solution was prepared by adding 0.20
mL herb extract solution to 3.80 mL DPPH solution. The solution was shaken vigorously and allowed to stand for 30 min at
room temperature in the dark. The DPPH solution and ascorbic acid were used as the control and standard, respectively.
Daily prepared standard calibration curves of ascorbic acids (40 to 250 µg/mL) were used to calculate the AA. The
absorbance was measured at 515 nm in a T60 UV-Visible spectrophotometer.
Similarly, in the H2O2 scavenging activity assay, a 40 mM H2O2 solution was prepared before the AA (H2O2) determination by
dissolving 0.453 mL of 30% H2O2 in 100 mL of
0.1 M phosphate buffer (pH 7.4). A 0.5 mL herbs extract stock solution was diluted with 0.5 mL methanol to obtain a
concentration of 10 mg/mL herbs extract solution. The test solution was prepared by adding 1.0 mL of herb extract
solutions to a 0.6 mL of 40 mM H2O2 solution and 3.40 mL phosphate buffer (pH 7.4). The solution was shaken vigorously
and allowed to stand for 10 min at room temperature in the dark before measurement. The H2O2 solution and ascorbic acid
were respectively used as the blank control and standard. Daily prepared standard calibration curves of 50 to 800 µg/mL
ascorbic acid were used to calculate the AA (H2O2). The absorbance was measured at 230 nm in a T60 UV-Visible spectrophotometer.
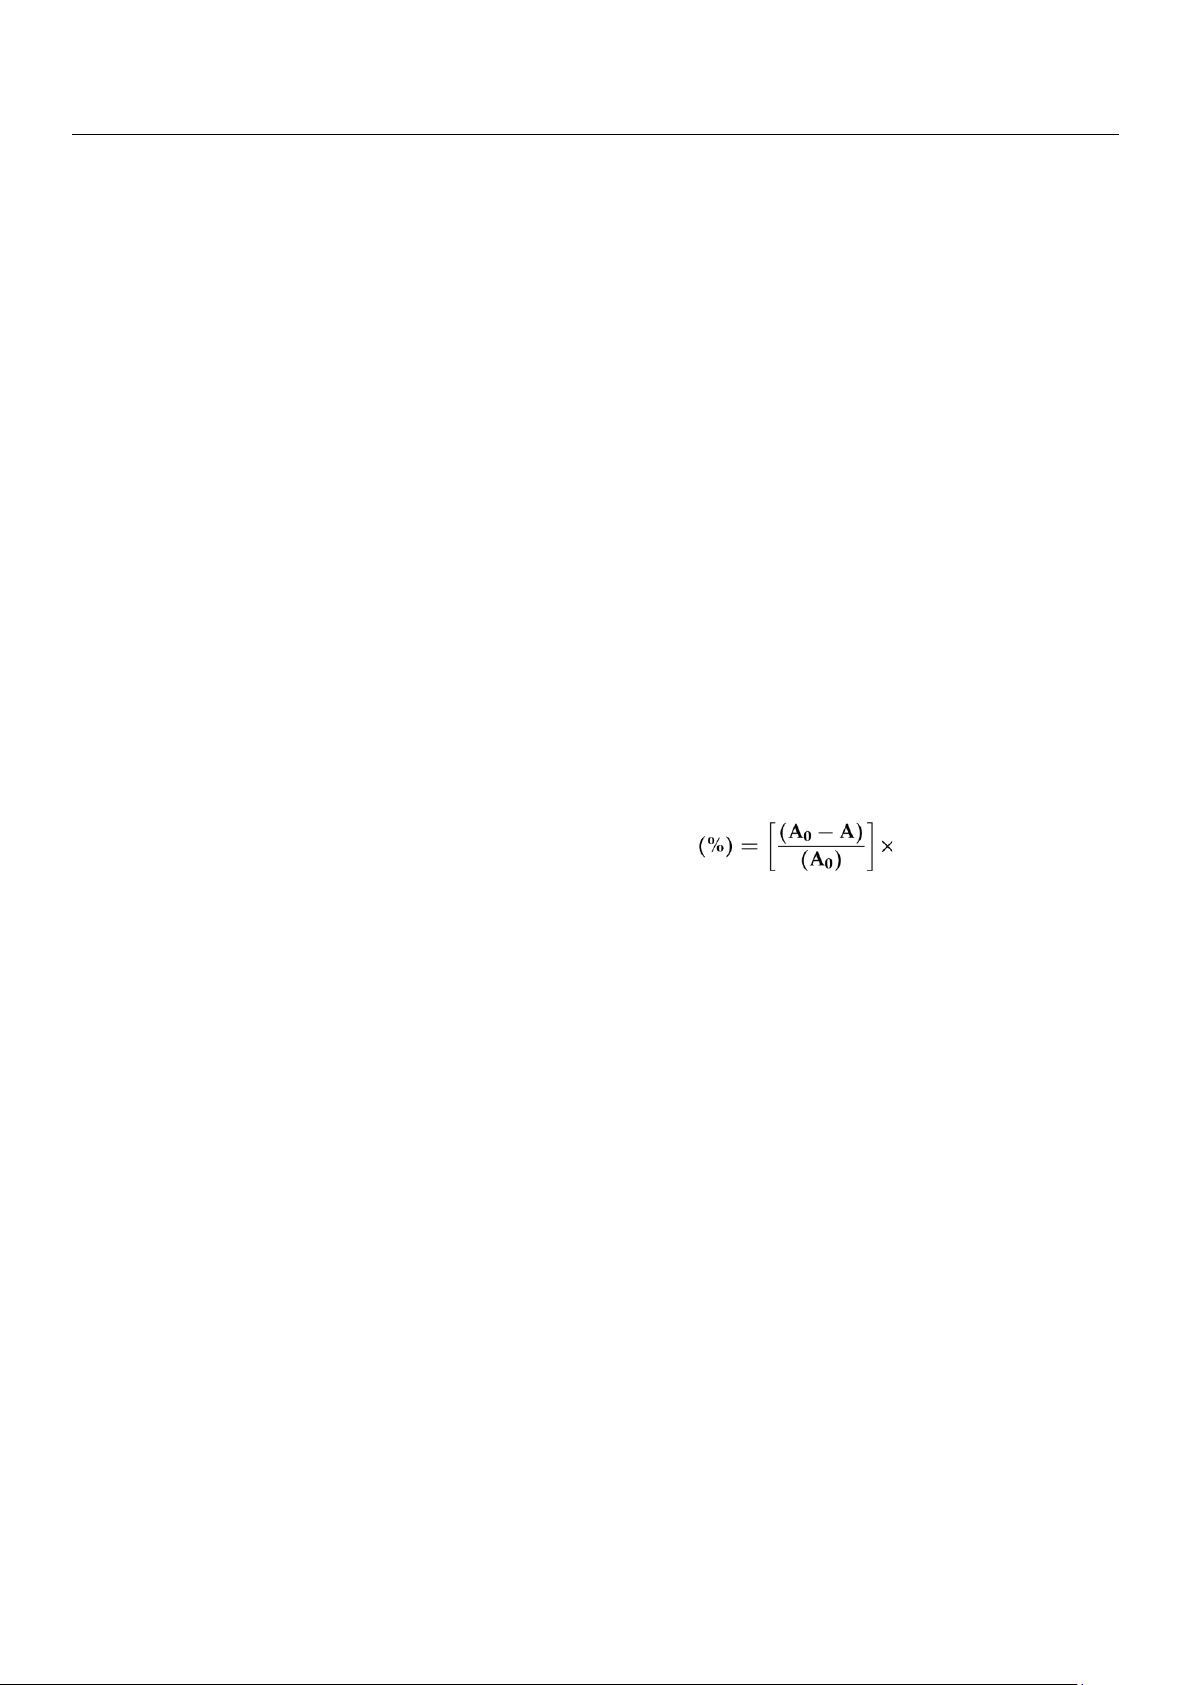
The antioxidant activity of both DPPH free radical and H2O2 scavenging activity assays can be calculated as follows: Antioxidant activity 100% (2)
where A0 is the blank control absorbance and A is the sample absorbance.
2.5. Determination of TPC
The total phenolic content (TPC) was determined by using the Folin–Ciocalteau (F–C) assay described by Li, et al. [3], but
with minor modifications. An aliquot of 400 µL extract was mixed with 2.0 mL of 10% F–C reagent and 1.60 mL 7.5% Na2CO3
solution. The mixture solution was shaken for 5 min and allowed to stand for 15 min at 37 ◦C followed by incubation in the
dark for 1 h. The same T60 UV-Visible spectrophotometer was used to measure the absorbance at 725 nm to determine the
TPC. Daily prepared standard calibration curves of gallic acid in methanol (20 to 250 µg/mL) was used to calculate the TPC,
expressed as milligrams of gallic acid equivalents per gram of dried powdered sample (mg GAE/g).
2.6. Determination of TFC
The total flavonoid content (TFC) was determined by using the NaNO2-AlCl3-NaOH assay by Li et al. [3], but with minor
modification. An aliquot of 0.40 mL extract (or standard) was mixed with 0.3 mL 5% NaNO2 and 2.0 mL distilled water. The
mixture solution was allowed to stand for 5 min and followed by the addition of 0.3 mL 10% AlCl3 and stood for another 6
min. After 1 min, the mixture solution was mixed with 2.0 mL 1.0 M NaOH and 3.2 mL distilled water, mixed with a vortex and
stood for 15 min at room temperature. The same T60 UV-Visible spectrophotometer was used to measure the absorbance at
422 nm to determine the TFC concentration. Daily prepared standard calibration curves of quercetin (20 to 600 µg/mL) were
used to calculate the TFC, expressed as milligrams of quercetin equivalents per gram of dried powdered sample (mg QE/g).
2.7. Determination of SPC Content
The selected phenolic compounds (SPC) content was separated and identified on HPLC-PAD system consisting of a Shimadzu
Nexera-i LC-2040C LC, a LC-2040 autosampler, a LC 2040 column oven, and a LC-2030/2040 PDA. An aliquot of 10 µL extract
was injected into the HPLC followed by separation performed at a flow rate of 1.0 mL/min on an Agilent Zorbax Eclipse Plus
C18 column (5 mm particle size, 150 mm length × 2.1 mm ID). Mobile phase A was 1.0% formic acid in deionized water and lOMoAR cPSD| 58504431
Antioxidants 2021, 10, 1530 4 of 15
mobile phase B was methanol. The initial mobile phase was 5% B and increased to 90% B in 20 min gradient elution time. The
column oven temperature is accordingly increased from initial 25 ◦C to final 90 ◦C. The absorbance was scanned in a range
from 190 to 800 nm. Five SPCs, namely curcumin, ferulic acid, naringin, gallic acid, and quercetin were used daily to prepare
the standard calibration curves. Other eluting peaks were tentatively identified by comparing their retention time to the
respective literature reported retention time.
2.8. Statistical Analysis
All experiments were performed in triplicate, unless otherwise stated. The results were presented as mean ± SD (standard
deviation). Taguchi experimental design results were analyzed by using Minitab 19 from Minitab, LLC (State College, PA, USA).
The correlation analysis results of AA with TPC, TFC, and SPC were expressed as Pearson correlation coefficients using SPSS
Version 24.0 (SPSS, Chicago, IL, USA). The slope of the calibration curve and the coefficient of determination (R2) were
obtained by using MS Excel 2010 from Microsoft (Redmond, WA, USA). 3. Results
3.1. Optimum Conditions for Ultrasonic Extraction
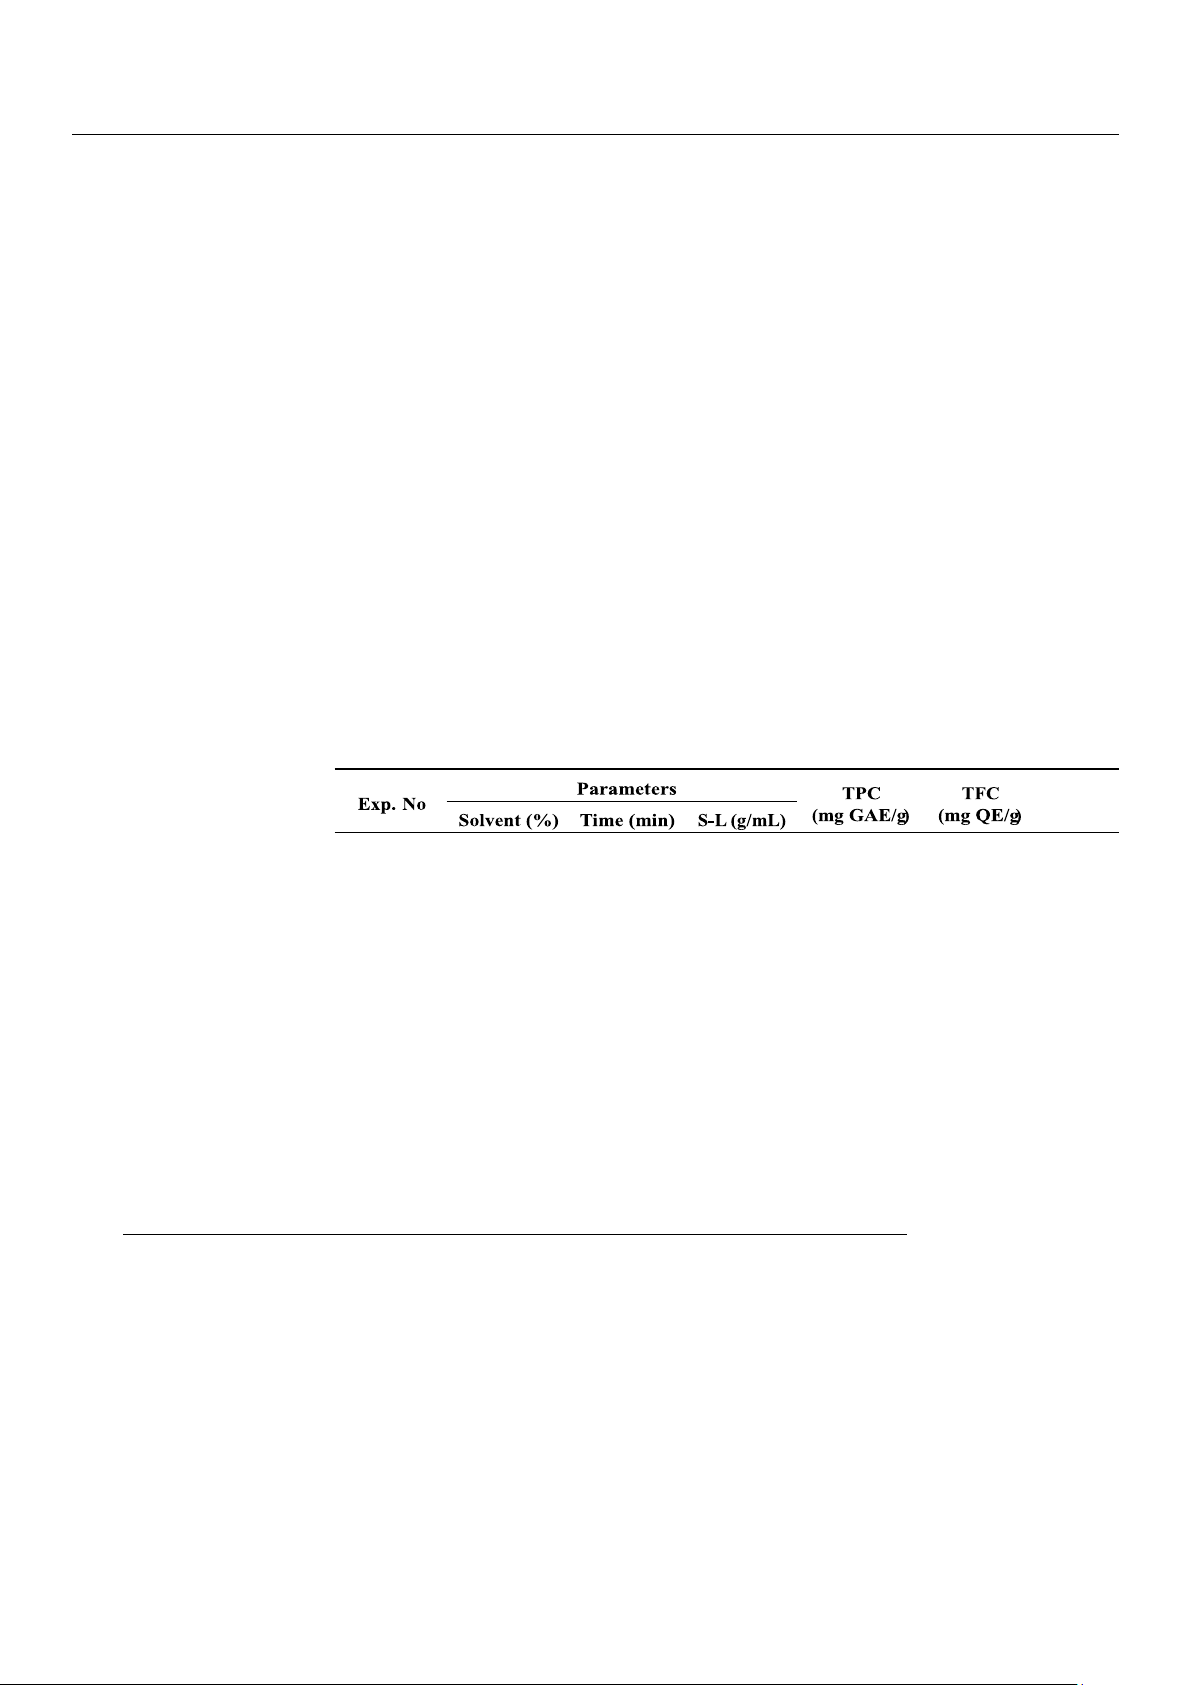
An orthogonal array L16 design was implemented to the ultrasonic extraction. Solvent concentration, extraction time, and
solid-to-liquid ratio (S-L) were selected parameters that could affect the antioxidant compounds extracted [21]. Using C.
zedoaria, one of Indonesian indigenous herbs that is already known as a traditional medicine, with high AA as a representative
sample, we see that the measured TPC, TFC, and AA values differ to a large extent with varying extraction parameters (Table 1).
Table 1. Experimental design (orthogonal array L16) and measured results using C. zedoaria. AA (%) 1 50 50 0.02 4.81 8.96 12.85 2 50 60 0.04 3.87 9.27 11.35 3 50 70 0.06 2.02 3.45 9.36 4 50 80 0.08 1.51 2.59 8.86 5 60 50 0.04 3.55 7.82 11.06 6 60 60 0.02 8.25 15.83 11.06 7 60 70 0.08 1.80 4.02 7.97 8 60 80 0.06 2.30 4.60 8.96 9 70 50 0.06 2.81 14.48 10.86 10 70 60 0.08 2.79 15.25 11.45 11 70 70 0.02 7.70 25.27 15.94 12 70 80 0.04 1.95 3.63 8.86 13 80 50 0.08 3.55 14.48 14.14 14 80 60 0.06 5.14 21.75 13.84 15 80 70 0.04 4.42 21.35 13.05 16 80 80 0.02 4.45 12.76 12.65
The overall optimum conditions selected were based on the main effects plot of SN ratio. Herein, we selected the larger-the-
better SN ratio approach to find the optimum conditions for AA (Figure 2). lOMoAR cPSD| 58504431
Antioxidants 2021, 10, 1530 5 of 15
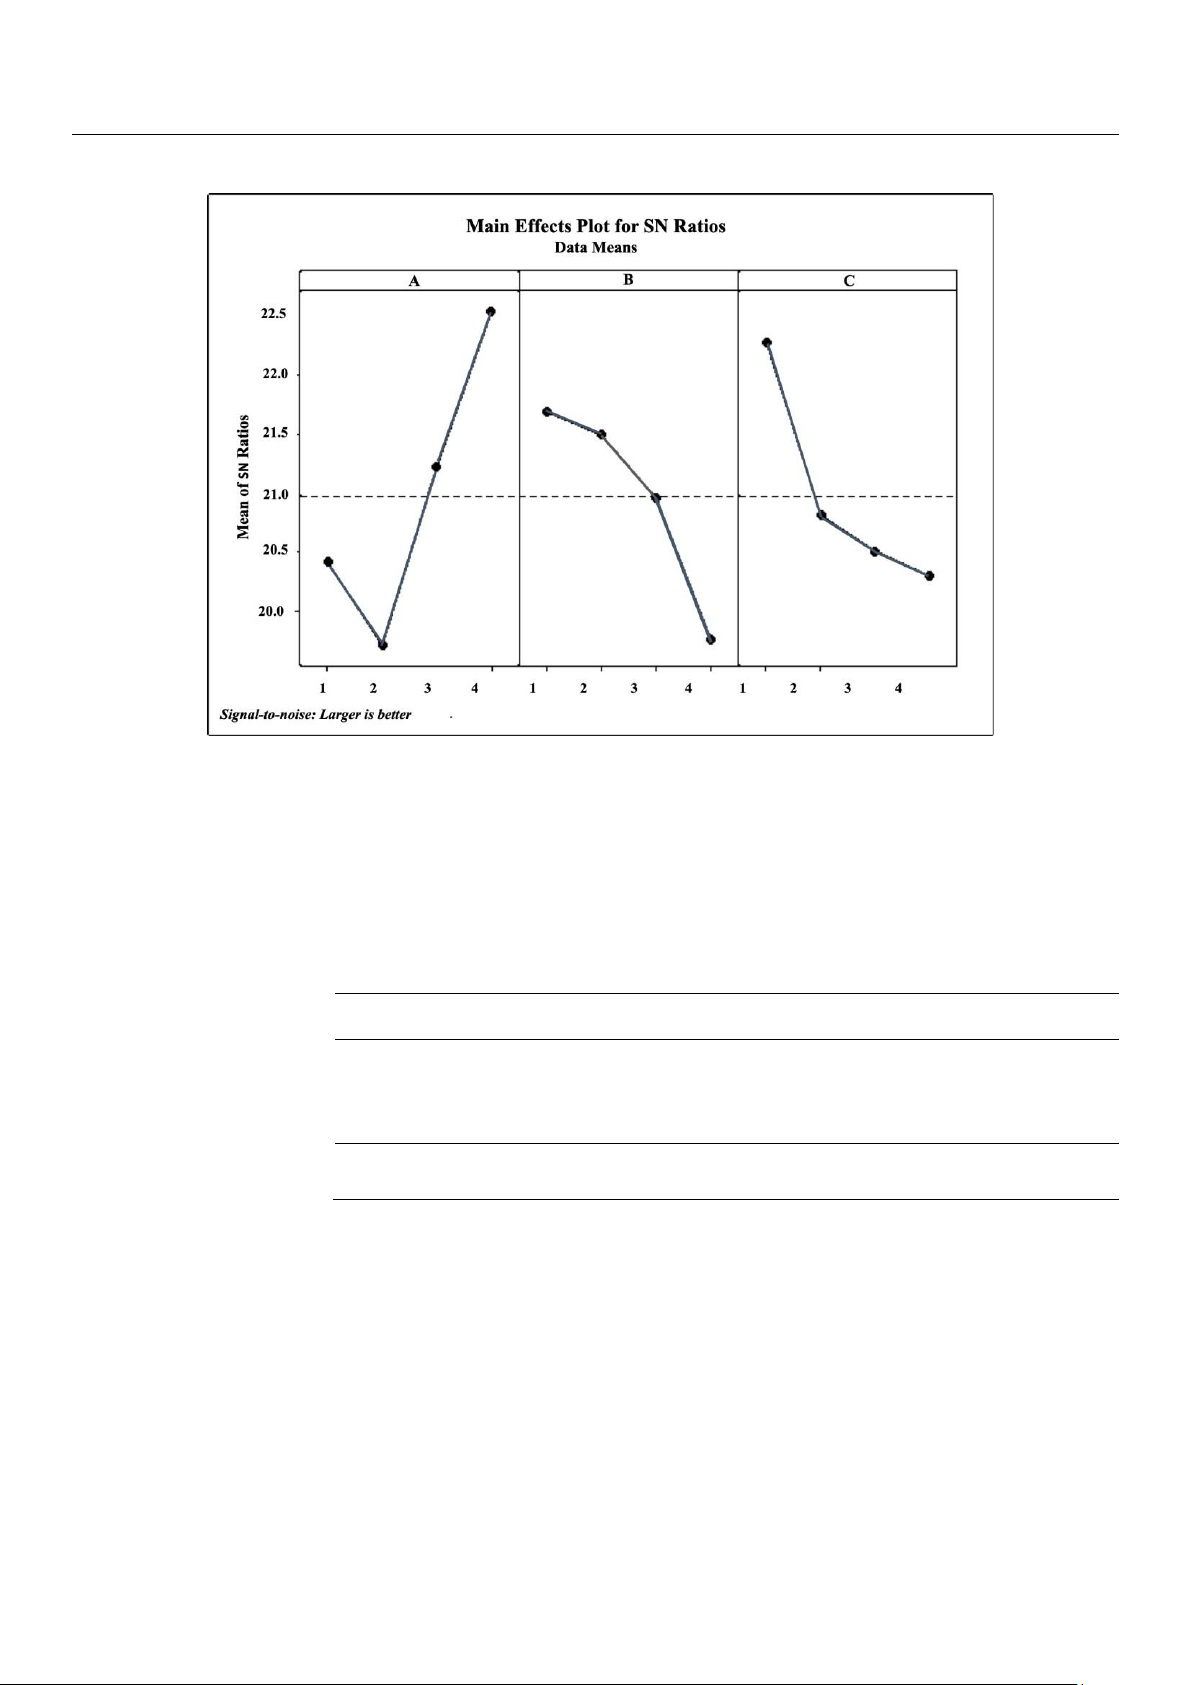
Figure 2. Main effects plot for SN ratio of AA. (A) Solvent concentration (50, 60, 70 and 80%), (B) extraction time (50, 60, 70 and 80
min), and (C) solid-to-liquid ratio (0.02, 0.04, 0.06 and 0.08 g/mL).
Ethanol concentration exhibited positive effect on higher AA (Figure 2A) was also obtained from previous AA compounds
(phenolics, flavonoids, tannin, alkaloids) isolated from various samples such as the extraction of 93 Chinese medicines [3],
Zingiberaceae species [11,20], Ipomoea batata leaves [12], and Algerian medicinal plants [22].
The calculated SN ratio of the AA response (Table 2) shows that the influence of solvent concentration has the main effect
on the antioxidant activity of the sample, followed by the solid-to-liquid ratio (S–L) and the extraction time.
Table 2. The calculated SN ratio of AA response for solvent concentration, extraction time, and solid-to-liquid ratio. Level Solvent (%) Time (min) S–L (mg/mL) 1 20.42 21.69 22.89 2 19.71 21.50 20.81 3 21.22 20.95 20.50 4 22.55 19.75 20.29 Delta 2.84 1.94 1.99 Rank 1 3 2
3.2. TPC, TFC, and Antioxidant Activity
TPC and TFC have been considered major contributors to plant AA [3]. The TPC (as mg GAE/g) was 32.57, i.e., the highest, in
C. longa and was 2.55, i.e., the lowest, in Z. zerumbet (Figure 3A). The TFC (as mg QE/g) was 279.87, i.e., the highest, in C.
longa and was 1.31, i.e., the lowest, in Z. officinale (Figure 3B). lOMoAR cPSD| 58504431
Antioxidants 2021, 10, 1530 6 of 15
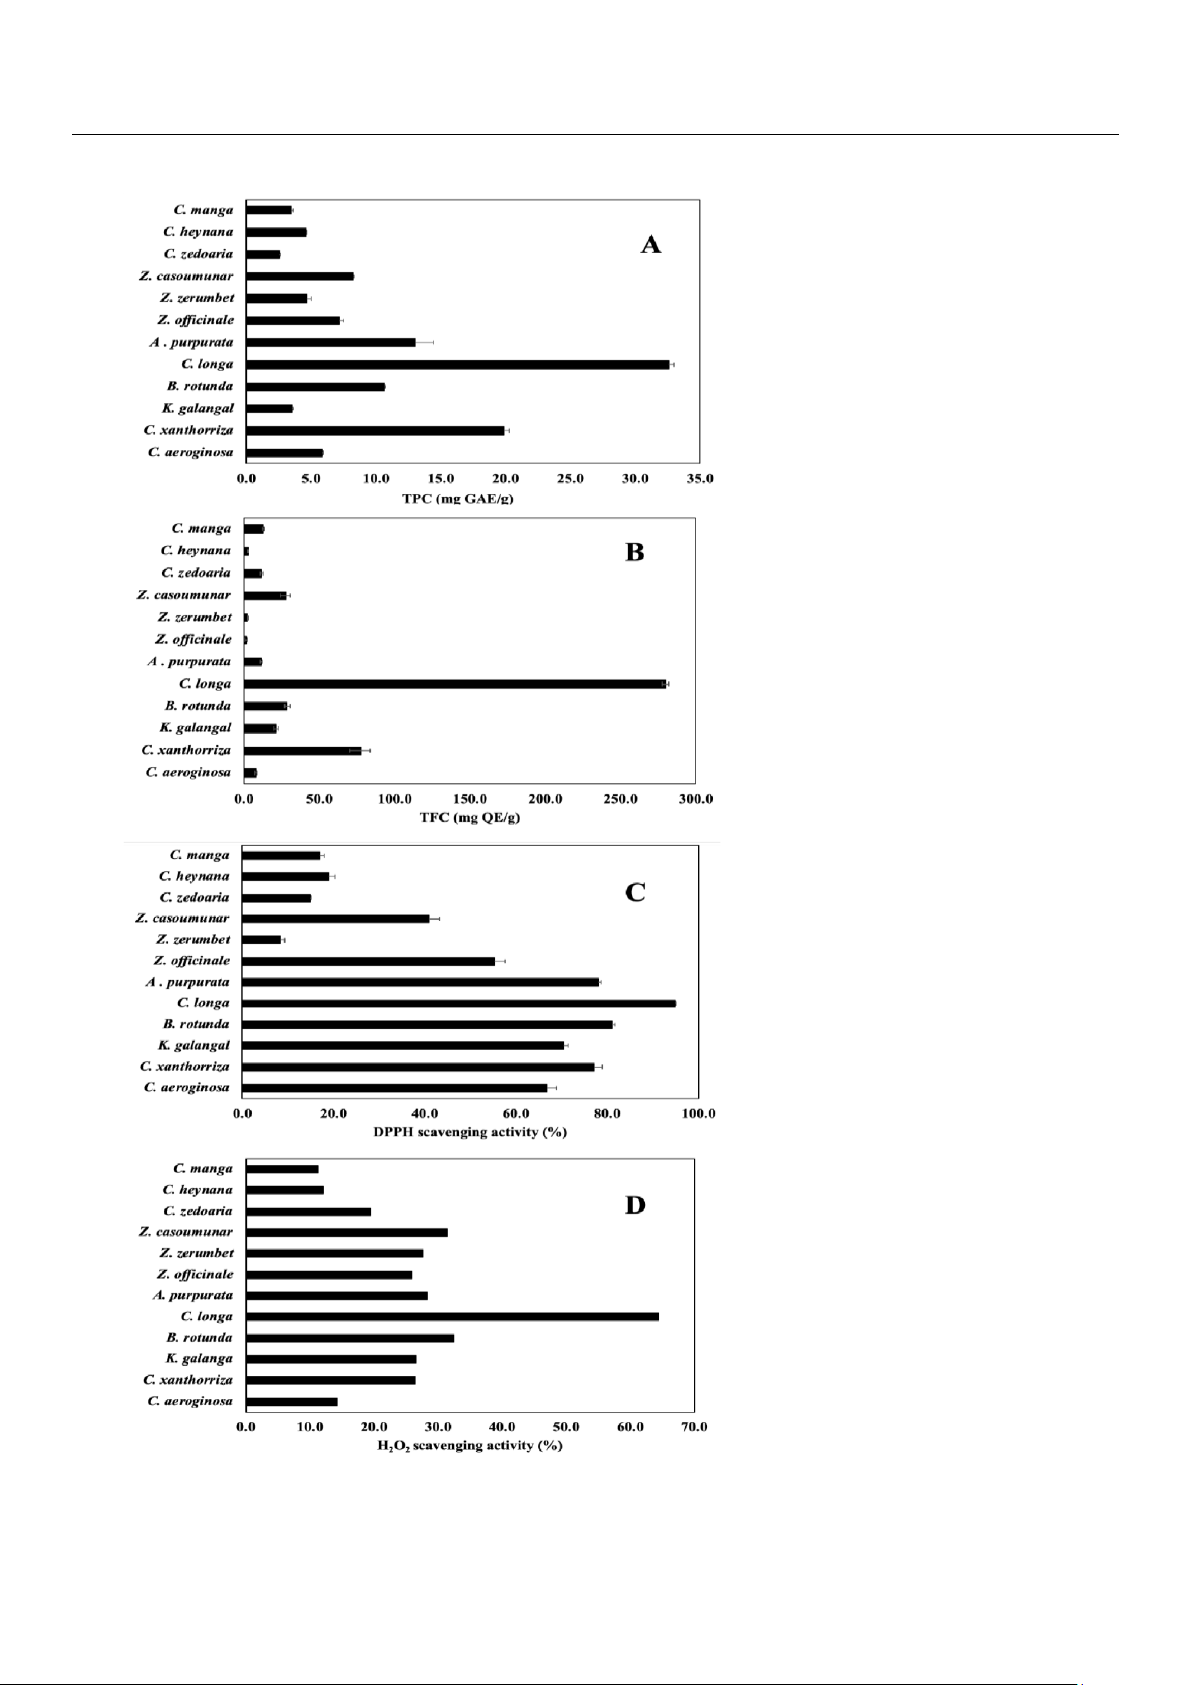
Figure 3. Chemical content and AA in Indonesian herbs: (A) TPC by Folin–Ciocalteau assay, (B) TFC by NaNO2-AlCl3-NaOH assay, (C) AA,
and (D) AA (H2O2), in 12 Indonesian herbs. (n = 3, error bars represent standard deviation). lOMoAR cPSD| 58504431
Antioxidants 2021, 10, 1530 7 of 15
The plant AA was caused by the presence of different antioxidant components in plant tissue. It was measured based on the
well-known DPPH assay [23] and H2O2 assay. The AA (as %) was found to be 94.85, i.e., the highest, in C. longa and 8.45, i.e.,
the lowest, in Z. zerumbet (Figure 3C), while the AA (H2O2) (as %) was 64.46, i.e., the highest, in C. longa and 11. 27, i.e., the
lowest, in C. manga (Figure 3D).
Among the 12 Indonesian herbs investigated, the C. longa, C. xanthorrhiza, A. purpurata, B. rotunda, and K. galangal
presented the highest AA, TPC and TFC obtained.
3.3. Correlation Analysis of AA with TPC and TFC
Typical TPC contributing more to plant AA were mainly phenolic acids and flavonoids. We adopted the Pearson correlation
coefficient (PCC), also referred to as Pearson’s r, to express the strength and direction of the linear relationship of correlation.
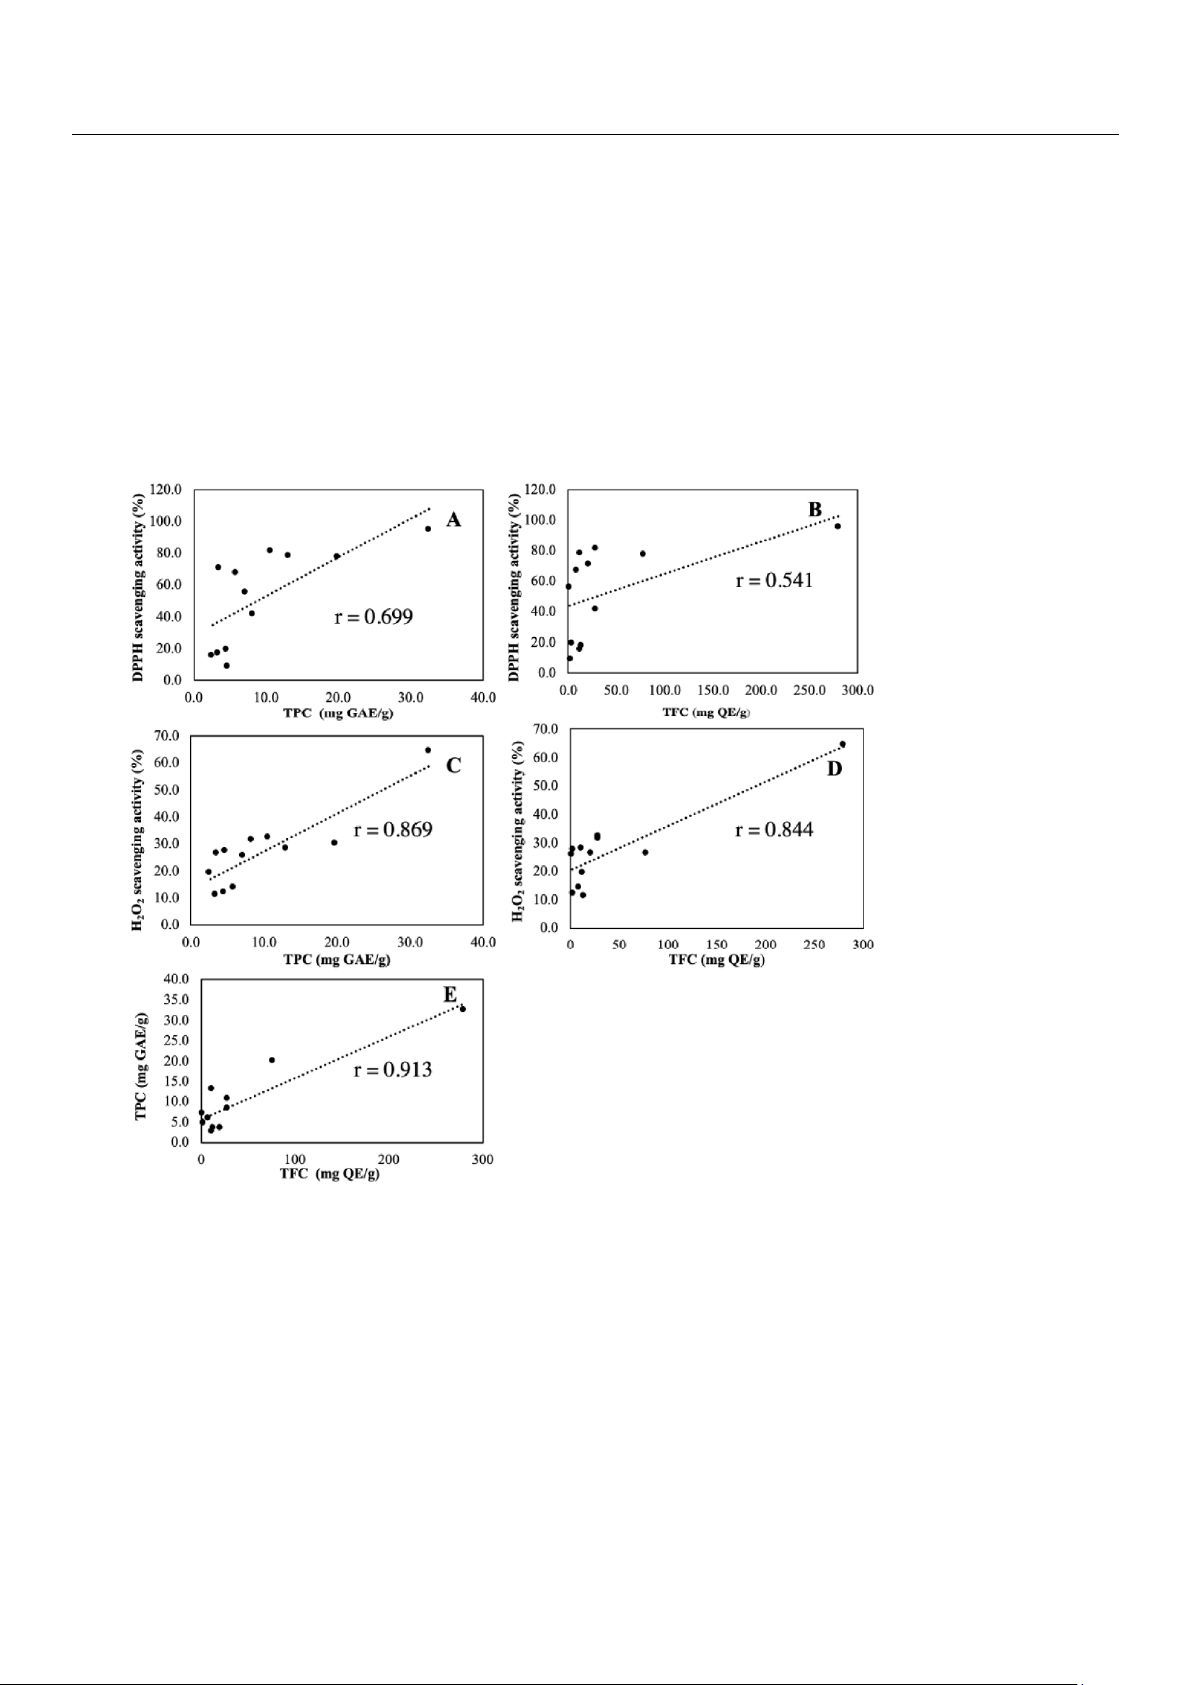
The PCC scatter plots of AA, TPC and TFC are shown in Figure 4.
Figure 4. Pearson correlation scatter plot of relationship between (A) AA and TPC, (B) AA and TFC, (C) AA (H2O2) and TPC (D) AA (H2O2)
and TFC, and (E) TPC and TFC.
3.4. Correlation Analysis of AA with SPC
The C. longa, B. rotunda, A. purpurata, C. xanthorrhiza, and K. galanga exhibiting high
TPC, TFC, and AA were further confirmed and quantified for five SPC. The analytical figures of merit (Table 3) of the adopted
HPLC-PAD method fit our research purpose. The chromatograms of the five SPC standards and five highest AA herbs are shown in Figure 5. lOMoAR cPSD| 58504431
Antioxidants 2021, 10, 1530 8 of 15
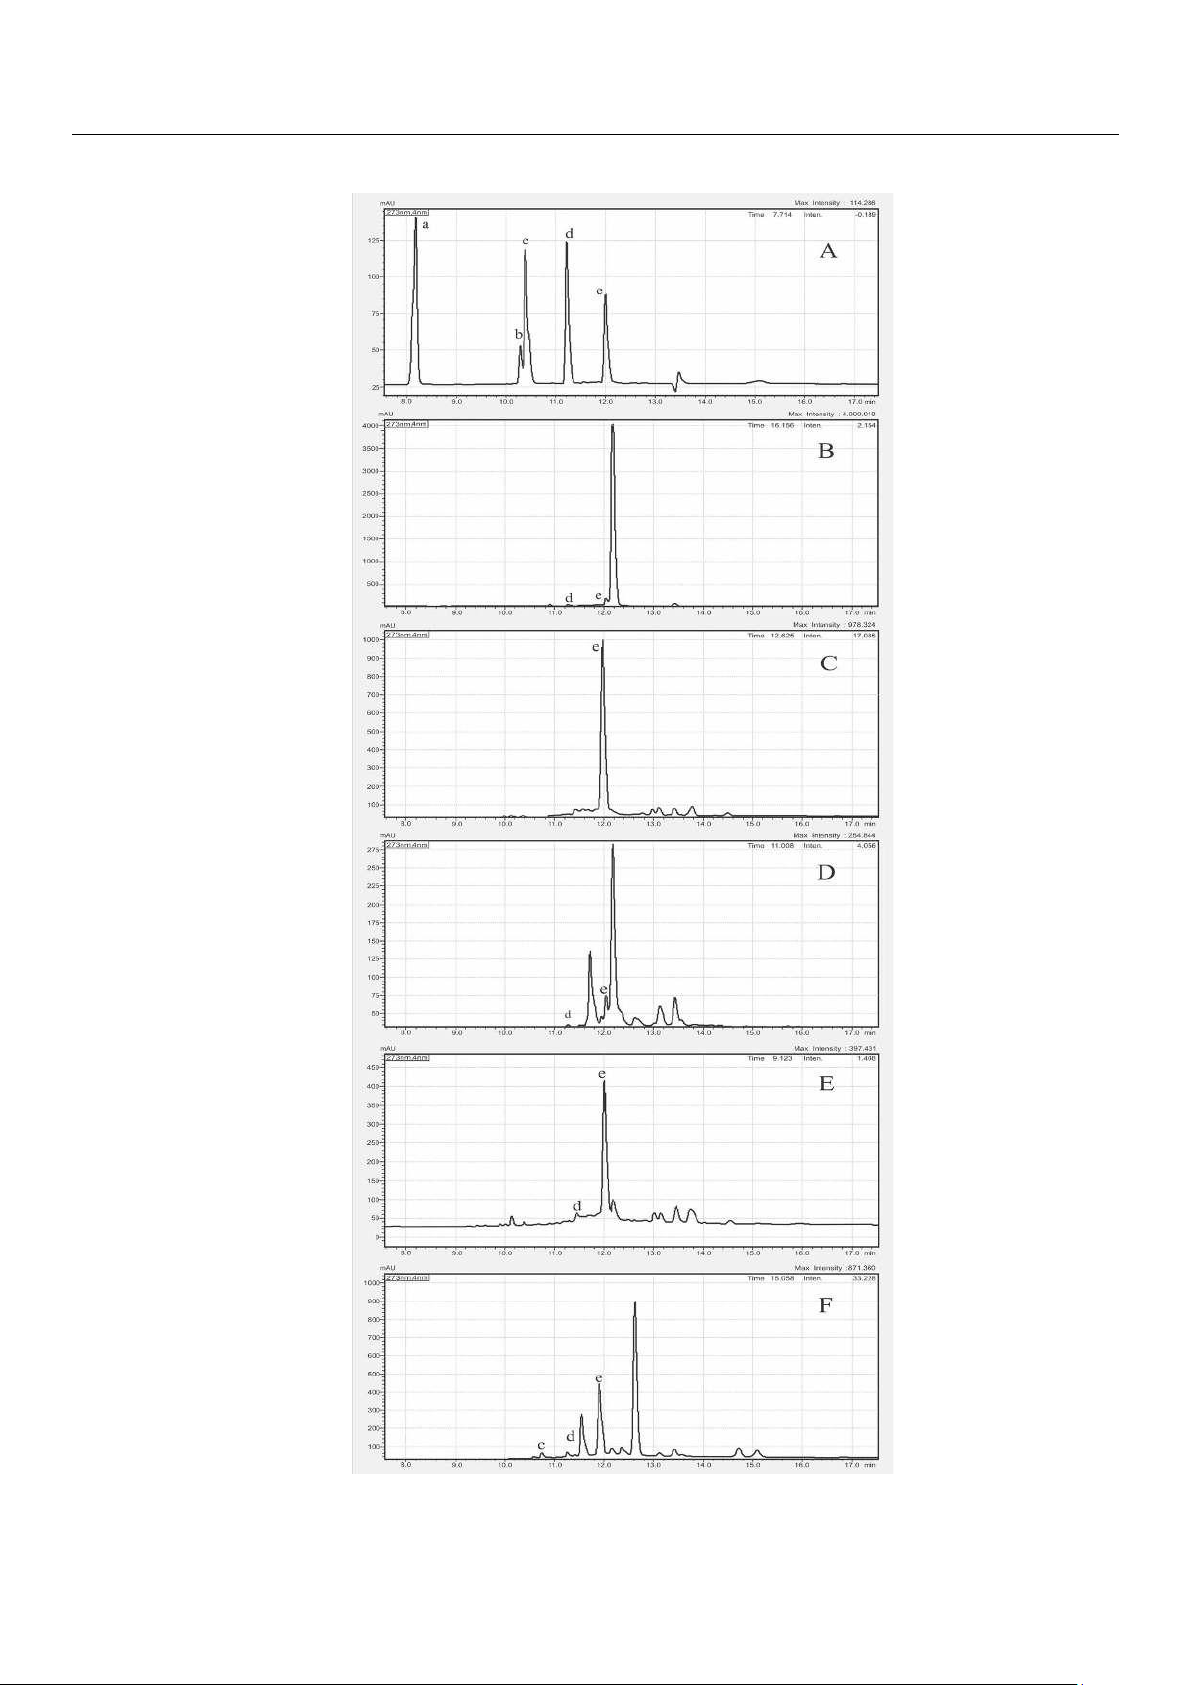
Figure 5. HPLC-PDA chromatograms of (A) five SPC standard solutions, (B) K. galangal, (C) C. longa, (D) A. purpurata, (E) C. xanthorrhiza.,
and (F) B. rotunda. (a: gallic acid, b: naringin, c: ferulic acid, d: quercetin, e: curcumin).
Table 3. Analytical figures of merit of HPLC-PAD method. lOMoAR cPSD| 58504431
Antioxidants 2021, 10, 1530 9 of 15 Retentio LOD LOQ Repeatabili Recover Compoun n Time (µg/m (µg/m ty y (%) d (min) L) L) (RSD%, n = 3) Gallic 8.20 ± 0.20 0.52 <2% 98 ± 1 acids 0.014 Naringin 10.30 ± 0.29 0.44 <5% 97 ± 4 0.004 Ferulic 10.41 ± 0.02 0.02 <4% 100 ± 3 acids 0.003 Quercetin 11.24 ± 0.02 0.02 <4% 100 ± 4 0.003 Curcumin 12.02 ± 0.18 0.33 <6% 98 ± 5 0.002
The SPC content measured by HPLC-PAD (Table 4) revealed that curcumin and quercetin were the most detected SPCs.
Table 4. SPC content (mg/g) measured by HPLC-PAD. SPC Gallic Naringin Ferulic Quercetin Curcumin Acid Acid C. longa ND ND ND ND 10.34 ± 0.02 B. rotunda ND ND ND 0.29 ± 0.61 ± 0.007 0.06 A. ND ND ND 0.07 ± 0.38 ± purpurata 0.002 0.022 C. ND ND 0.04 ± 0.43 ± 3.78 ± xanthorrhiza 0.005 0.026 0.553 K. ND ND ND 0.32 ± 0.99 ± galangal 0.02 0.08 ND: not detected.
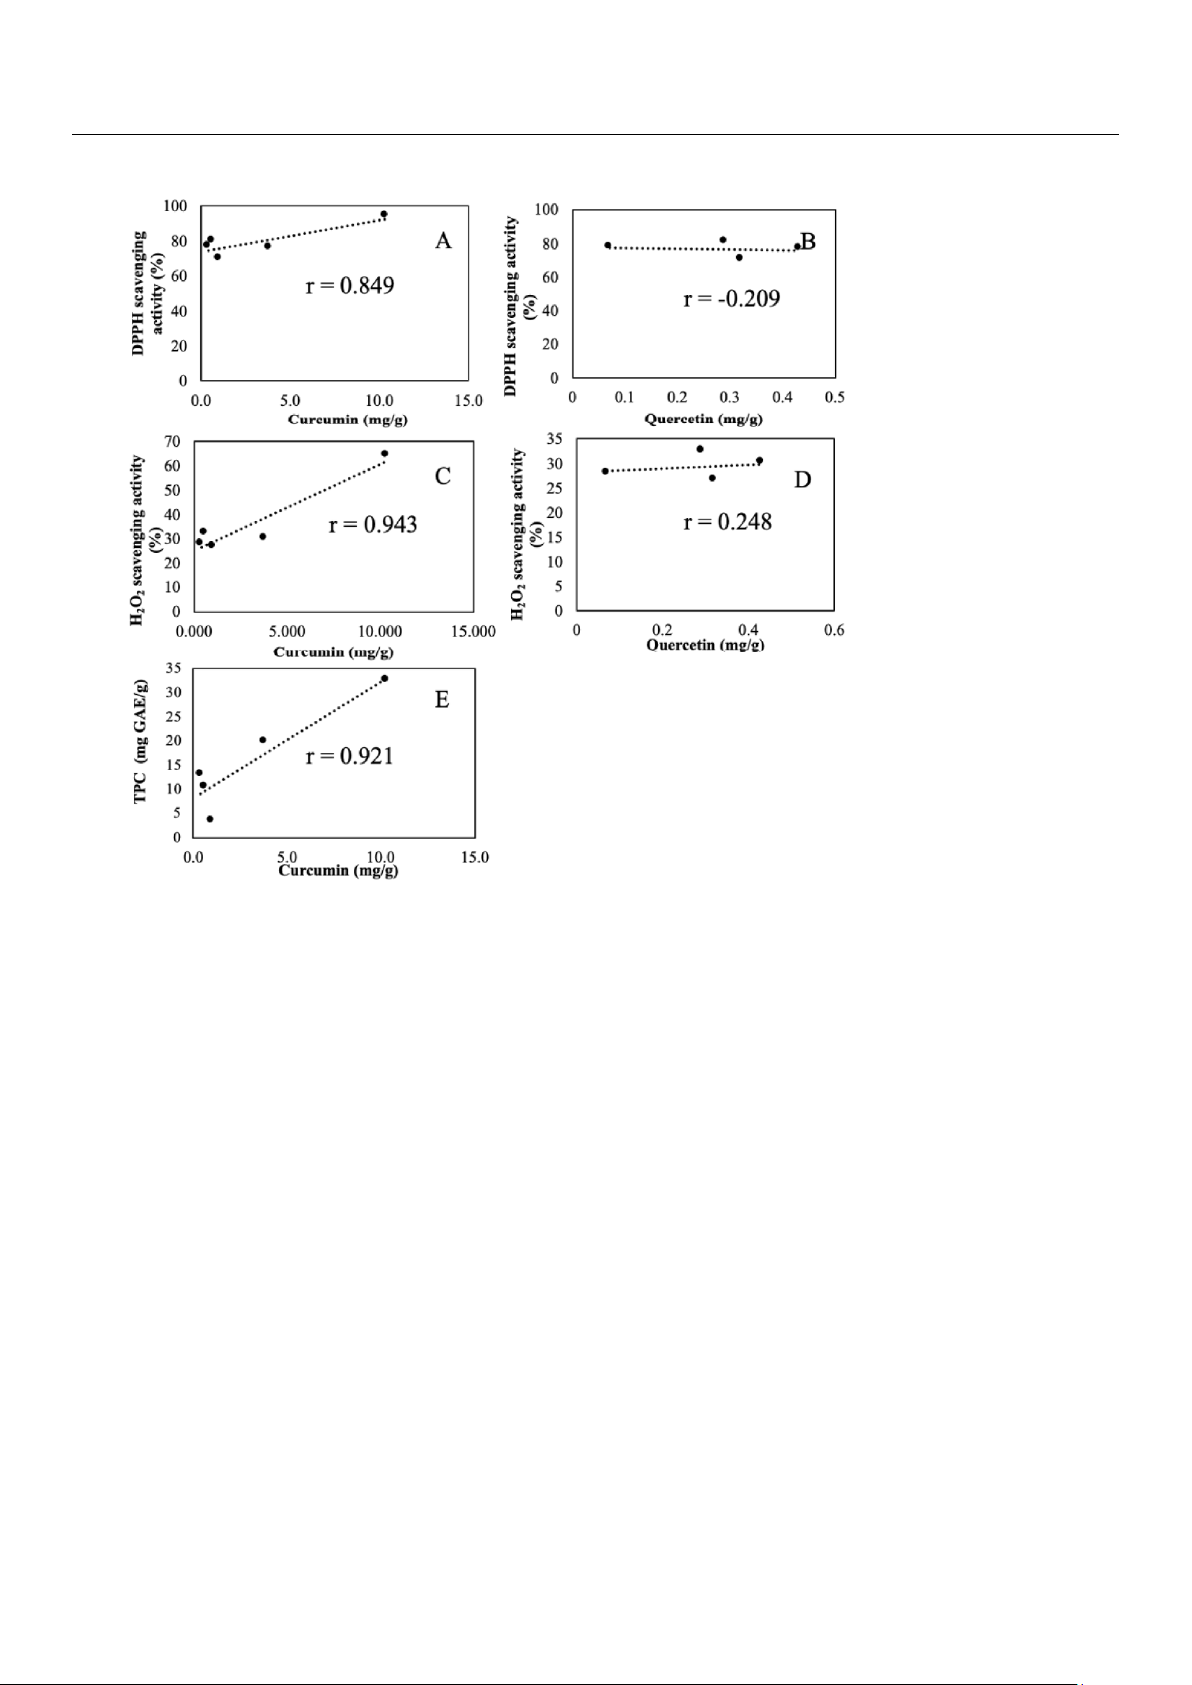
The correlation relationships between AA and curcumin/quercetin as well as between TPC and curcumin are shown in Figure 6. lOMoAR cPSD| 58504431
Antioxidants 2021, 10, 1530 10 of 15
Figure 6. Pearson correlation scatter plots of relationship between (A) AA and curcumin, (B) AA and quercetin, (C) AA (H2O2) and curcumin
(D) AA (H2O2) and quercetin, and (E)TPC and curcumin. 4. Discussion
The adoption of L16 orthogonal array design in ultrasonic extraction of Indonesian selected herb was a realistic alternative to
reduce the experimental trials while achieving similar optimum conditions [15]. We selected the less reported C. zedoaria as
a representative sample for initial optimization, as we were also interested in studying the matrix effect. C. zedoaria might
contain AA compounds different from C. longa, the most common herbs in Zingiberaceae family. Table 1 that shows the
measured TPC, TFC, and AA values differ to a large extent with varying extraction parameters. In a set of 16 experiments, the
corresponding change ranged from 1.51 to 8.25 mg GAE/g, 2.59 to 25.27 mg QE/g, and 7.97 to 15.94%, respectively. The
results indicated that under respective optimum conditions the enhancement factors (the ratio of the highest to the lowest
measured values) were TPC~6, TFC~10, and AA~2. The increasing AA activity of C. zedoaria indicated that the number of
extracted AA compounds was highly affected by the extraction conditions which were dictated by the characteristics of the
targeted antioxidant compounds. This observation also holds true for known TPC and TFC compounds. Figure 2 shows that
the overall optimum conditions selected, based on the main effects plot of SN ratios of AA was 80% ethanol concentration,
50 min extraction time, and 0.02 S-L. The ethanol concentration exhibited a positive effect on higher AA (Figure 2A). This
result was reached presumably because at higher concentration; the ability of ethanol to degrade the nonpolar cell walls via
semipolar interactions was enhanced, leading to the increasing release of intracellular phenolic and flavonoid compounds.
Ethanol was among the best extraction solvents irrespective of the extraction method [3,11,13,15,17], and increasing ethanol
concentration generally led to higher TPC yield [13,15,17]. Longer extraction time exhibited a negative effect of lower AA
(Figure 2B), which was presumably due to the resultant prolonged heat exposure leading to the decreasing amount of
targeted AA compounds [21,24]. The larger S–L also exhibited a similarly negative effect of lower AA (Figure 2C), presumably
due to the smaller solvent volume available to penetrate the sample and leading to reduced solubilizing of the AA compounds.
The calculated SN ratio for each factor (Figure 2) is presented numerically in Table 2. The table contains a column for each
factor (solvent %, time min, and S–L g/L), and each table contains six rows for SN ratio at each factor level followed by delta
and rank. Delta is the difference between the maximum and minimum average SN ratio for the factor. The factor with the lOMoAR cPSD| 58504431
Antioxidants 2021, 10, 1530 11 of 15
largest delta ranks as the first, which means the highest influencing effect on AA. Briefly, solvent concentration exhibits the
highest effect, followed by solid-to-liquid ratio, and extraction time.
TPC and TFC are widely present plant substances and have been considered as significant contributors to AA [3], mainly due
to their unique redox properties [8,14,25]. Plant TPC depends on their species/genetics and environmental conditions [26].
The F–C assay commonly used to measure the TPC; however, this assay measures the total reducing capacity of the sample,
not just TPC. The TPC (as mg GAE/g) was 32.57, i.e., the highest in C. longa and was 2.55, i.e., the lowest in Z. zerumbet (Figure
3A). The ~13 times TPC difference was similar to previous studies on TPC and AA in various herbs and spices that C. longa had
the highest TPC [23,27]. Other high TPC herbs such as C. xanthorrhiza [27,28],
A. purpurata [29], B. rotunda [30], and Z. cassoumounar [31] were also reported.
Flavonoids are a group of phenolic compounds that exhibit important biological effects and promising AA owing to their
capability to scavenge reactive oxygen species effectively. The AlCl3 assay measures the absorbing species in the final solution, not just TFC. Among
12 selected Indonesian herbs samples, the TFC (as mg QE/g) was 279.87, i.e., the highest in C. longa and was 1.31, i.e., the
lowest in Z. officinale (Figure 3B) similar to reported high curcuminoid content. Previous studies have found lesser TFC in Z.
officinale, Z. zerumbet, and C. heynana [27,29,30]. The ~214 times TFC difference might be attributed to the type of flavonoids
present in the herbs. The less polar ones (isoflavones, flavanones, flavones, and flavanols) could be better extracted by
nonpolar solvents, whereas the more polar ones (such as glycosides and aglycones) are better extracted by alcohol or water-
alcohol solvents [32]. The range of TFC is largely affected by genetic diversity, as well as biological, seasonal, and year-to-year variations [33].
The plant AA is caused by the presence of different antioxidant components in plant tissue. Previous studies have found that
the AA of bioactive components such as TPC, tannin, anthocyanin, TFC, phenols, alkaloids, and pro-anthocyanins are mainly
due to their unusual redox properties [2,8,11]. The AA was measured in an exact concentrationdependent manner based on
the well-known DPPH assay [23] by reducing violet-color DPPH solution to yellow-colored product, diphenyl picryl hydrazine.
The grade of color is equal to the synergetic effect by antioxidant ability and concentration of reducing components in the
sample [2]. The AA (as %) was 94.85, i.e., the highest in C. longa and 8.45 i.e., the lowest in Z. zerumbet (Figure 3C). The ~11
times AA difference was close to the ~13 times TPC difference. Meanwhile, the AA (H2O2) obtained the highest value (as %),
which was 64.46 in C. longa, and it obtained 11.27, which was the lowest in C. manga (Figure 3D). The different results of AA
by DPPH and peroxide assay were probably due to peroxide’s weak reactivity in aqueous solutions [34]. Nevertheless, the
variation pattern between these two AA results appeared similar except for Z. zerumbet, indicating the AA was mainly
contributed by the phytochemicals or substances essential in the herbs. A notable difference was an AA (%) range, specifically,
100% for DPPH assay and 70% for H2O2 assay, presumably due to the higher sensitivity of DPPH assay.
Typical TPC contribute more to plant AA are mainly phenolic acids and flavonoids. The matrix difference among plant species
from different geographical origin and variance in genetics and cultivation conditions make the correlation analysis between
AA with TPC and TFC a challenging work [21,23,28,29,31,35,36]. We adopted the Pearson correlation coefficient (PCC), also
referred to as Pearson’s r, to express the strength and direction of the linear relationship of correlation. The PCC between AA
and TPC (Figure 4A) was 0.699 (p-value < 0.011) revealing a strong positive relationship. Similar result of PCC 0.869 (p-value <
0.000) between AA (H2O2) and TPC in Figure 4C, revealed a strong positive correlation. According to this result, plant AA was
contributed mainly by TPC [1,3] and was highly influenced by the number and position of the hydrogen-donating hydroxyl
groups. However, TPC was not the sole contributing component, and other substances cannot be ignored, especially at lower
TPC (<10 mg GAE/g), which might elucidate the associated pronounced scattering extent. Another possible cause was that no
sample clean up procedure was followed before TPC determination, allowing other plant substances to contribute to the TPC
falsely. The PCC between AA and TFC (Figure 4B) was 0.541 (p-value < 0.069) revealing a moderate positive relationship, while
the PCC between AA (H2O2) and TFC (Figure 4D) was 0.844 (p-value < 0.000), revealed a strong positive correlation. The
stronger AA and TPC relationship compared to AA and TFC relationship might indicate that TFC contributes less AA than TPC,
according well with previous studies that TFC plays a less substantial AA contributing role [2,3]. The PCC between TPC and TFC
(Figure 4E) was 0.913 (p-value < 0.000) revealing an expected strong positive relationship as both classes all contribute to
plant AA. Plausible contributors from other families of compounds such as anthocyanins, carotenoids, ascorbic acids,
terpenoids, tannins, and tocopherols in medicinal plants [6] cannot be excluded. Confirmative analysis of these compounds
warrants advanced MS analysis or using standard compounds in the future.
C. longa, B. rotunda, A. purpurata, C. xanthorrhiza, and K. galanga exhibiting high
TPC, TFC, and AA, were further confirmed and quantified their five SPC content using HPLC-PAD. The chromatograms of the
five SPC standard solutions (Figure 5A) and herbs mentioned before disclose that the highest curcumin (peak e) amount was lOMoAR cPSD| 58504431
Antioxidants 2021, 10, 1530 12 of 15
found in C. longa (Figure 5C) and C. xanthorrhiza (Figure 5E) as reported in previous studies [23,37]. The intensive peak at
12.700 min RT in B. Rotunda (Figure 5F) was uncertainly assigned as antioxidant active panduratin, alpiretin, pinocembrin, or
cardamonin [35,36]. The high peak at 12.191 min RT in A. purpurata (Figure 5D) was tentatively assigned as kaempferol, rutin,
or oliconide [32]. At 12.199 min RT in K. galangal (Figure 5B), the peak was tentatively assigned as ethyl-p-methoxycinnamate
[38]. Confirmative analysis of these tentatively assigned compounds warrants relevant standard compounds and elaborated
MS analysis. The measured SPC content (Table 4) revealed that curcumin and quercetin were the most detected SPC.
Curcumin, a flavonoid polyphenol, was present in all five herbs with the highest being 10.34 mg/g in C. longa and the lowest
being 0.38 mg/g in A. purpurata. The
~10 times curcumin content difference is much larger than the ~2.5 times TPC difference. Quercetin, a flavonoid compound
present in most plants [30], was present in 4 herbs
(except C. longa) with the highest amount being 0.43 mg/g in C. xanthorrhiza and the lowest being 0.07 mg/g in A.
purpurata. The ~6 times quercetin content difference was similar to the ~6.7 times TFC difference. The PCC between AA and
curcumin (Figure 6A) was 0.849 (p-value < 0.069), and PCC between AA (H2O2) and curcumin (Figure 6C) was 0.943 (p-value <
0.016), revealing a strong positive relationship which indicated that AA was likely contributed mainly by curcumin. The PCC
between AA and quercetin (Figure 6B) was −0.209 (p-value < 0.559), revealing a weak negative relationship, while the PCC
between AA (H2O2) with quercetin (Figure 6D) was 0.248 (p-value < 0.807), revealing weak correlation. This unexpected result
was presumably due to the fact that quercetin was in flavonol glycoside form such as quercetin-3-O-β-D-glucoside [39] which
cannot be detected by the free quercetin specific HPLC-PAD method used in this study.
The PCC between AA (H2O2) and curcumin (Figure 6C) was 0.943 (p-value < 0.026), revealing a strong positive relationship
which indicated that AA (H2O2) was likely contributed mainly by curcumin. The PCC between AA (H2O2) and quercetin (Figure
6D) was 0.248 (p-value < 0.807), revealing a weak positive relationship. The PCC between TPC and curcumin (Figure 6F) was
0.921 (p-value < 0.026), revealing a strong positive linear relationship between TPC and curcumin. A strong positive linear
relationship between TPC and curcumin (Figure 6E) was revealed with PCC 0.921 (p-value < 0.026). The practice of the mixed-
method approach finds and confirms C. longa as the best natural antioxidant source in Indonesian indigenous Zingiberaceae herbs. 5. Conclusions
The chemical assay revealed a remarkable difference in AA, TPC and TFC in 12 Indonesian indigenous Zingiberaceae herbs
and the highest individual measured values in C. longa. HPLC-PAD analysis revealed curcumin in the five top antioxidant herbs
with the highest concentration in C. longa. Correlation analysis showed a strong positive linear relationship between AA and
TPC (or curcumin) and revealed TPC (or curcumin) to be the major antioxidant compound (or component). Our integration of
a mixed-method approach concludes C. longa as the best source of natural antioxidants in 12 Indonesian indigenous
Zingiberaceae herbs. We argue that the mixed-method approach can be useful for antioxidant studies as it can help deal with
complexity and facilitate a more profound understanding of individual results from chemical assay, instrumental analysis, and
correlation to obtain more comprehensive explanations. The use of the mixed-method approach to augment the findings of
solitary methods might facilitate future researchers being able to uncover deeper and hidden meanings.
Author Contributions: Conceptualization and methodology, Y.M.M. and Y.-C.L.; formal analysis and investigation, Y.M.M.; resources, Y.-
C.L.; writing—original draft preparation, Y.M.M.; writing— review and editing, G.G. and Y.-C.L.; supervision, Y.-C.L.; and funding acquisition,
Y.-C.L. All authors have read and agreed to the published version of the manuscript.
Funding: This research was partially supported by the Ministry of Science and Technology, Taiwan, ROC. under Grant No. MOST 107-2113-
M-007-020. Any opinions, findings, or recommendations expressed in this material are those of the authors and do not necessarily reflect the views of the MOST.
Institutional Review Board Statement: Not applicable.
Informed Consent Statement: Not applicable.
Data Availability Statement: Data is contained within the article.
Acknowledgments: Y.M. is grateful for the doctoral fellowship program from the 4 in 1 project of
University of Jember, Ministry of Education and Culture, Indonesia and Islamic Development Bank (IsDB).
Conflicts of Interest: The authors declare no conflict of interest. References
1. Huang, D.; Ou, B.; Prior, R.L. The Chemistry behind Antioxidant Capacity Assays. J. Agric. Food Chem. 2005, 53, 1841–1856. [CrossRef] lOMoAR cPSD| 58504431
Antioxidants 2021, 10, 1530 13 of 15
2. Saeed, N.; Khan, M.R.; Shabbir, M. Antioxidant activity, total phenolic and total flavonoid contents of whole plant extracts Torilis
leptophylla L. BMC Complement. Altern. Med. 2012, 12, 221. [CrossRef]
3. Li, M.; Paré, P.W.; Zhang, J.; Kang, T.; Zhang, Z.; Yang, D.; Wang, K.; Xing, H. Antioxidant Capacity Connection with Phenolic and Flavonoid
Content in Chinese Medicinal Herbs. Rec. Nat. Prod. 2018, 12, 239–250. [CrossRef]
4. Zyman´czyk-Duda, E.; Szmigiel-Merena, B.; Brzezin´ska-Rodak, M.; Klimek-Ochab, M. Natural antioxidants–properties and˙ possible
applications. J. Appl. Biotechnol. Bioeng. 2018, 5, 1. [CrossRef]
5. Wilson, D.W.; Nash, P.; Buttar, H.S.; Griffiths, K.; Singh, R.; De Meester, F.; Horiuchi, R.; Takahashi, T. The Role of Food Antioxidants,
Benefits of Functional Foods, and Influence of Feeding Habits on the Health of the Older Person: An Overview.
Antioxidants 2017, 6, 81. [CrossRef] [PubMed]
6. Bhatt, I.D.; Rawat, S.; Rawal, R.S. Antioxidants in Medicinal Plants. In Biotechnology for Medicinal Plants; Chandra, S., Lata, H., Varma,
A., Eds.; Springer Science and Business Media LLC: Berlin/Heidelberg, Germany, 2013; pp. 295–326.
7. Silva, S.; Ferreira, M.; Oliveira, A.S.; Magalhães, C.; Sousa, M.E.; Pinto, M.; Sousa Lobo, J.M.S.; Almeida, I.F. Evolution of the use of
antioxidants in anti-ageing cosmetics. Int. J. Cosmet. Sci. 2019, 41, 378–386. [CrossRef] [PubMed]
8. Mukherjee, P.K.; Maity, N.; Nema, N.K.; Sarkar, B.K. Bioactive compounds from natural resources against skin aging. Phytomedicine 2011,
19, 64–73. [CrossRef] [PubMed]
9. Xu, D.-P.; Li, Y.; Meng, X.; Zhou, T.; Zhou, Y.; Zheng, J.; Zhang, J.-J.; Li, H.-B. Natural Antioxidants in Foods and Medicinal Plants: Extraction,
Assessment and Resources. Int. J. Mol. Sci. 2017, 18, 96. [CrossRef] 10.
Cahyaningsih, R.; Brehm, J.M.; Maxted, N. Gap analysis of Indonesian priority medicinal plant species as part of their
conservation planning. Glob. Ecol. Conserv. 2021, 26, e01459. [CrossRef] 11.
Hamzah, B.; Zubair, M.S. Traditional Usages and Phytochemical Screenings of Selected Zingiberaceae from Central Sulawesi,
Indonesia. Pharmacogn. J. 2019, 11, 505–510. [CrossRef] 12.
Widyowati, R.; Agil, M. Chemical Constituents and Bioactivities of Several Indonesian Plants Typically Used in Jamu. Chem.
Pharm. Bull. 2018, 66, 506–518. [CrossRef] [PubMed] 13.
Parham, S.; Kharazi, A.Z.; Bakhsheshi-Rad, H.R.; Nur, H.; Ismail, A.F.; Sharif, S.; Krishna, S.R.R.; Berto, F. Antioxidant,
Antimicrobial and Antiviral Properties of Herbal Materials. Antioxidants 2020, 9, 1309. [CrossRef] [PubMed] 14.
Yordi, E.G.; Perez, E.M.; Matos, M.J.; Villares, U.V. Antioxidant and pro-oxidant effects of polyphenolic compounds and struc-
tureactivity relationship evidence. In Nutrition, Well-Being and Health. Bouyaed; Intechopen: London, UK, 2012; pp. 24–41. Available online:
https://www.intechopen.com/chapters/29974 (accessed on 18 July 2021). 15.
S¸ahin, S. Optimization of ultrasonic-assisted extraction parameters for antioxidants from Curcuma longa L. Trak. Univ. J. Nat.
Sci. 2018, 19, 121–128. [CrossRef] 16.
Chen, Y.-T.; Ling, Y.-C. An overview of supercritical fluid extraction in Chinese herbal medicine: From preparation to analysis.
J. Food Drug Anal. 2000, 8, 2. [CrossRef] 17.
Song, J.; Li, D.; Liu, C.; Zhang, Y. Optimized microwave-assisted extraction of total phenolics (TP) from Ipomoea batatas leaves
and its antioxidant activity. Innov. Food Sci. Emerg. Technol. 2011, 12, 282–287. [CrossRef] 18.
Lou, S.-N.; Hsu, Y.-S.; Ho, C.-T. Flavonoid compositions and antioxidant activity of calamondin extracts prepared using different
solvents. J. Food Drug Anal. 2014, 22, 290–295. [CrossRef] 19.
Wisdom, J.; Creswell, J.W. Mixed Methods: Integrating Quantitative and Qualitative Data Collection and Analysis While
Studying Patient-Centered Medical Home Models; AHRQ Publication No. 13-0028-EF; Agency for Healthcare Research and Quality: Rockville,
MD, USA, 2013. Available online: https://pcmh.ahrq.gov/page/mixed-methods-integrating-quantitative-and-qualitative-datacollec-tion-
and-analysis-while (accessed on 26 September 2021). 20.
Hernández-Rodríguez, G.; Espinosa-Solares, T.; Hernandez-Eugenio, G.; Villa-García, M.; ReyesTrejo, B.; Guerra-Ramírez, D.
Influence of Polar Solutions on the Extraction of Phenolic Compounds from Capulín Fruits (Prunus serotina). J. Mex. Chem. Soc. 2017, 60, 73–78. [CrossRef] 21.
Duan, S.-C.; Kwon, S.-J.; Eom, S.-H. Effect of Thermal Processing on Color, Phenolic Compounds, and Antioxidant Activity of
Faba Bean (Vicia faba L.) Leaves and Seeds. Antioxidants 2021, 10, 1207. [CrossRef] 22.
Azwanida, N.N. A Review on the Extraction Methods Use in Medicinal Plants, Principle, Strength and Limitation. Med. Aromat.
Plants 2015, 4, 196. [CrossRef] 23.
Sepahpour, S.; Selamat, J.; Abdul Manap, M.Y.; Khatib, A.; Abdull Razis, A.F. Comparative Analysis of Chemical Composition,
Antioxidant Activity and Quantitative Characterization of Some Phenolic Compounds in Selected Herbs and Spices in Different
Solvent Extraction Systems. Molecules 2018, 23, 402. [CrossRef] 24.
Ghafoor, K.; Ahmed, I.A.M.; Dog˘u, S.; Uslu, N.; Fadimu, G.J.; Al Juhaimi, F.; E Babiker, E.; Özcan, M.M.; Jamiu, F.G. The Effect
of Heating Temperature on Total Phenolic Content, Antioxidant Activity, and Phenolic Compounds of Plum and Mahaleb Fruits.
Int. J. Food Eng. 2019, 15, 11–12. [CrossRef] 25.
Djeridane, A.; Yousfi, M.; Nadjemi, B.; Boutassouna, D.; Stocker, P.; Vidal, N. Antioxidant activity of some algerian medicinal
plants extracts containing phenolic compounds. Food Chem. 2006, 97, 654–660. [CrossRef] lOMoAR cPSD| 58504431
Antioxidants 2021, 10, 1530 14 of 15 26.
Kainama, H.; Fatmawati, S.; Santoso, M.; Papilaya, P.M.; Ersam, T. The Relationship of Free Radical Scavenging and Total
Phenolic and Flavonoid Contents of Garcinia lasoar PAM. Pharm. Chem. J. 2020, 53, 1151–1157. [CrossRef]
27. Akinola, A.; Ahmad, S.; Maziah, M. Total Anti-Oxidant Capacity, Flavonoid, Phenolic Acid And Polyphenol Content In Ten Selected Species of
Zingiberaceae rhizomes. Afr. J. Tradit. Complement. Altern. Med. 2014, 11, 7–13. [CrossRef] [PubMed]
28. Akarchariya, N.; Sirilun, S.; Julsrigival, J.; Chansakaowa, S. Chemical profiling and antimicrobial activity of essential oil from Curcuma
aeruginosa Roxb., Curcuma glans K. Larsen & J. Mood and Curcuma cf. xanthorrhiza Roxb. collected in Thailand. Asian
Pac. J. Trop. Biomed. 2017, 7, 881–885. [CrossRef]
29. Victorio, C.P.; Kuster, R.M.; Lage, C.L.S. Detection of flavonoids in Alpinia purpurata (Vieill.) K. Schum. leaves using highperformance liquid
chromatography. Rev. Bras. Plantas Med. 2009, 11, 147–153. [CrossRef]
30. Piluzza, G.; Bullitta, S. Correlations between phenolic content and antioxidant properties in twenty-four plant species of traditional
ethnoveterinary use in the Mediterranean area. Pharm. Biol. 2010, 49, 240–247. [CrossRef] [PubMed]
31. Sytar, O.; Hemmerich, I.; Zivcak, M.; Rauh, C.; Brestic, M. Comparative analysis of bioactive phenolic compounds composition from 26
medicinal plants. Saudi J. Biol. Sci. 2018, 25, 631–641. [CrossRef]
32. Ovando-Domínguez, M.Y.; Luján-Hidalgo, M.C.; González-Mendoza, D.; Vargas-Díaz, A.A.; Ruiz-Lau, N.; Gutiérrez-Miceli, F.A.; Lecona-
Guzman, C.A. Total phenols, flavonoids and antioxidant activity in Annona muricata and Annona purpurea callus culture.
Phyton 2019, 88, 139–147. [CrossRef]
33. Aryal, S.; Baniya, M.K.; Danekhu, K.; Kunwar, P.; Gurung, R.; Koirala, N. Total Phenolic Content, Flavonoid Content and Antioxidant Potential
of Wild Vegetables from Western Nepal. Plants 2019, 8, 96. [CrossRef]
34. Siriwardhana, S.S.K.W.; Shahidi, F. Antiradical activity of extracts of almond and its by-products. J. Am. Oil Chem. Soc. 2002, 79, 903–908. [CrossRef]
35. Yusuf, N.A.; Suffian, M.; Annuar, M.; Khalid, N. Existence of bioactive flavonoids in rhizomes and plant cell cultures of
Boesenbergia rotunda (L.). Mansf. Kulturpfl. Aust. J. Crop. Sci. 2013, 7, 730–734.
36. Raj, C.A. Leaf extract of Alpinia purpurata (Vieill.) K. Schum screened for its phytochemical constituents and antibacterial and anticancer
activities. J. Chin. Integr. Med. 2012, 10, 1460–1464. [CrossRef]
37. Jantan, I.; Saputri, F.C.; Qaisar, M.N.; Buang, F. Correlation between Chemical Composition of Curcuma domestica and Curcuma xanthorrhiza
and Their Antioxidant Effect on Human Low-Density Lipoprotein Oxidation. Evid.-Based Complement. Altern. Med. 2012, 2012, 1–10. [CrossRef] [PubMed]
38. Sahoo, S.; Parida, R.; Singh, S.; Padhy, R.N.; Nayak, S. Evaluation of yield, quality and antioxidant activity of essential oil of in vitro propagated
Kaempferia galanga Linn. J. Acute Dis. 2014, 3, 124–130. [CrossRef]
39. Desai, S.; Tatke, P.; Gabhe, S. Enhanced HPLC-DAD Method for Fast Determination of Quercetin-3-O-β-d-Glucoside in Extracts and Polyherbal
Formulations Containing Azadirachta indica—Optimization and Validation. J. Chromatogr. Sci. 2017, 55, 706–711. [CrossRef]
Tài liệu liên quan:
-
Study Guide for Chapter 1 Concepts and Questions | Môn Microbiology - Trường Đại học Quốc tế, Đại học Quốc gia Thành phố Hồ Chí Minh
101 51 -
Case study 3: Optimizing Ultrasound-Assisted Extraction of Polyphenols from Carob Pods | Môn Microbiology - Trường Đại học Quốc tế, Đại học Quốc gia Thành phố Hồ Chí Minh
130 65 -
Case Study: Impact of Protein & Eating Frequency on Appetite in Obese Men | Môn Microbiology - Trường Đại học Quốc tế, Đại học Quốc gia Thành phố Hồ Chí Minh
119 60 -
Tổng quan về Vi sinh vật học - Tuần 1 | Môn Microbiology - Trường Đại học Quốc tế, Đại học Quốc gia Thành phố Hồ Chí Minh
87 44