Case Study: Impact of Protein & Eating Frequency on Appetite in Obese Men | Môn Microbiology - Trường Đại học Quốc tế, Đại học Quốc gia Thành phố Hồ Chí Minh
The purpose of this study was to determine the effects of dietary protein intake and eating frequency on perceived appetite, satiety, and hormonal responses in overweight/obese men. Tài liệu được sưu tầm gồm 10 trang, giúp bạn ôn tập tốt hơn. Mời các bạn đón xem.
Môn: Microbiology 10 tài liệu
Trường: Trường Đại học Quốc tế, Đại học Quốc gia Thành phố Hồ Chí Minh 2 K tài liệu
Tác giả:


Preview text:
lOMoAR cPSD| 58504431
nature publishing group ARTICLES
INTERVENTION AND PREVENTION
The Influence of Higher Protein Intake and
Greater Eating Frequency on Appetite
Control in Overweight and Obese Men
The purpose of this study was to determine the effects of dietary protein intake and eating frequency on perceived
appetite, satiety, and hormonal responses in overweight/obese men. Thirteen men (age 51 ± 4 years; BMI
31.3 ± 0.8 kg/m2) consumed eucaloric diets containing normal protein (79 ± 2 g protein/day; 14% of energy intake as
protein) or higher protein (138 ± 3 g protein/day; 25% of energy intake as protein) equally divided among three eating
occasions (3-EO; every 4 h) or six eating occasions (6-EO; every 2 h) on four separate days in randomized order.
Hunger, fullness, plasma glucose, and hormonal responses were assessed throughout 11 h. No protein × eating
frequency interactions were observed for any of the outcomes. Independent of eating frequency, higher protein led to
greater daily fullness (P < 0.05) and peptide YY (PYY) concentrations (P < 0.05). In contrast, higher protein led to
greater daily ghrelin concentrations (P < 0.05) vs. normal protein. Protein quantity did not influence daily hunger,
glucose, or insulin concentrations. Independent of dietary protein, 6-EO led to lower daily fullness (P < 0.05) and PYY
concentrations (P < 0.05). The 6-EO also led to lower glucose (P < 0.05) and insulin concentrations (P < 0.05) vs. 3-EO.
Although the hunger-related perceived sensations and hormonal responses were conflicting, the fullness-related
responses were consistently greater with higher protein intake but lower with increased eating frequency. Collectively,
these data suggest that higher protein intake promotes satiety and challenge the concept that increasing the number of
eating occasions enhances satiety in overweight and obese men.
Obesity (2010) 18, 1725–1732. doi:10.1038/oby.2010.45 INTRODUCTION
1 Department of Dietetics & Nutrition, University of Kansas Medical Center, Kansas City, Kansas, USA; 2Department of Foods & Nutrition, Ingestive Behavior
Research Center, Purdue University, West Lafayette, Indiana, USA. Correspondence: Heather J. Leidy (hleidy@kumc.edu)
Received 21 September 2009; accepted 10 February 2010; published online 25 March 2010. doi:10.1038/oby.2010.45 lOMoAR cPSD| 58504431 ARTICLES
INTERVENTION AND PREVENTION Experimental design
Specific testing day procedures METHODS AND PROCEDURES Subjects lOMoAR cPSD| 58504431 ARTICLES
INTERVENTION AND PREVENTION
Table 1 Subject characteristics of 13 overweight and obese men Subject characteristics Mean ± s.e.m. Age (year) 51 ± 4 Height (cm) 178 ± 2 Weight (kg) 99.6 ± 2.4 BMI (kg/m2) 31.3 ± 0.8 Body fat (%) 31 ± 3 Fasting glucose (mg/dl) 97 ± 1 Eating occasions Fasting insulin (pmol/l) 75 ± 16
Habitual meal pattern (# meals/day) 2.9 ± 0.3
Data expressed as mean ± s.e.m.
Table 2 Dietary characteristics of the test day diets Normal protein testing day Higher protein testing day 3 Eating occasions (3-EO) 6 Eating occasions (6-EO) 3 Eating occasions (3-EO) 6 Eating occasions (6-EO) Average Average Average Average Dietary eating eating eating eating characteristics occasion Total (sum) occasion Total (sum) occasion Total (sum) occasion Total (sum) Energy 710 ± 30a 2,130 ± 80b 352 ± 15c 2,110 ± 90b 728 ± 28a 2,180 ± 80b 360 ± 15b 2,160 ± 90b content (kcal) PRO (g) 26 ± 1a 79 ± 2b 13 ± 0c 78 ± 2b 46 ± 1d 139 ± 4e 23 ± 1a 137 ± 4e CHO (g) 109 ± 6a 331 ± 15b 55 ± 3c 327 ± 15b 91 ± 4d 272 ± 13e 45 ± 2f 270 ± 13e Fat (g) 21 ± 1a 63 ± 2b 10 ± 0c 62 ± 3b 21 ± 1a 64 ± 3b 11 ± 1c 63 ± 3b
Data presented as mean ± s.e.m. Different letters denote significance across rows; significance P < 0.05; repeated measures ANOVA within and between treatments.
Eating occasion columns include the average for each of the eating occasions consumed during the testing day. Total (sum) columns include the sum of all of the
eating occasions consumed during the testing day.
CHO, carbohydrate; PRO, protein. a Perceived appetite Period I Period II Period III 100 12 12 12 10 90 10 10 8 8 8 80 6 6 6 4 4 70 4 2 2 2 60 0 0 0 NP H P 3 - 6 E -E O O NP HP 3 - EO 6-EO NP HP 3 - EO 6-EO 50 NP–3-EO NP–6-EO 40 HP–3-EO HP–6-EO 30 20 10 0 lOMoAR cPSD| 58504431 ARTICLES
INTERVENTION AND PREVENTION 0 60 120 180 240 300 360 420 480 540 600 Time (min) b Perceived satiety Period I Period II Period III 100 NP–3-EO NP–6-EO 90 HP–3-EO HP–6-EO 80 70 60 50 * NP v s. HP 20 20 20 * 18 3-EO vs. 6-EO 18 18 40 16 16 16 14 14 14 30 12 12 12 10 10 10 8 8 8 20 6 6 6 4 4 4 2 2 10 2 0 0 0 NP HP 3-EO 6-EO NP HP 3-EO 6-EO NP HP 3 - E O 6-EO 0 *3-EO vs. 6-EO 0 60 120 180 240 300 360 420 480 540 600 Time (min)
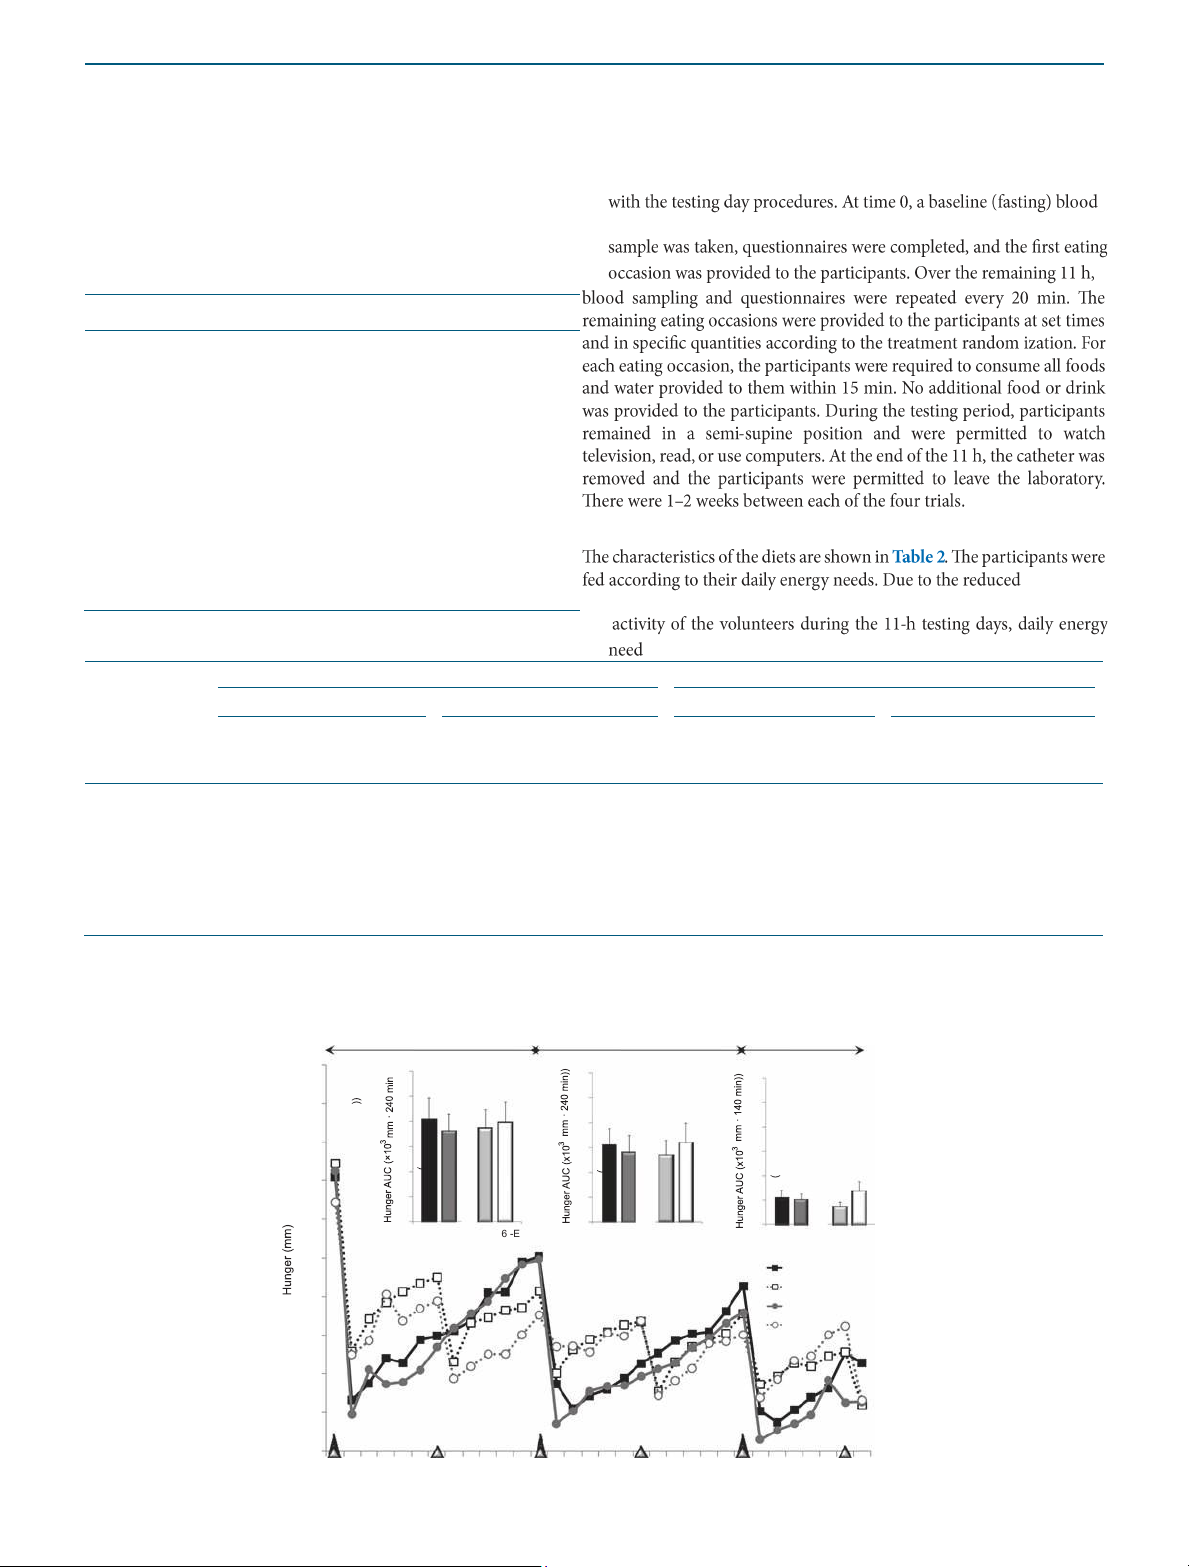
Figure 1 Perceived appetite and satiety throughout the 11-h testing days following the dietary protein and eating frequency treatments. *Main
effects; P < 0.05. Period I: time 0–240 min; period II: time 240–480 min; period III: time 480–620 min.
Appetite questionnaires lOMoAR cPSD| 58504431 ARTICLES
INTERVENTION AND PREVENTION a Plasma glucose Period I Period II Period III 200 30 * 3-EO vs. 6-EO 30 30 25 25 25 180 20 20 20 15 15 15 10 10 10 160 5 5 5 0 0 0 NP H P 3 - EO 6- EO NP HP 3-EO 6-EO NP HP 3-EO 6-EO 140 120 NP–3-EO 100 NP–6-EO HP–3-EO HP–6-EO 80 0 60 120 180 240 300 360 420 480 540 600 Time (min) b Plasma insulin Period I Period III 1 ,400 175 175 175 150 * 3-EO vs. 6-EO 150 150 * 3-EO vs. 6-EO 1,200 125 125 125 100 100 100 75 75 75 * 3- EO vs. 6-EO 1,0 00 50 50 50 25 25 25 0 0 0 800 NP HP 3-EO 6-EO NP HP 3-EO 6-EO NP HP 3-EO 6-EO NP–3-EO 600 NP–6-EO HP–3-EO HP–6-EO 400 200 0 Period II 0 60 120 180 240 300 360 420 480 540 600 Time (min)
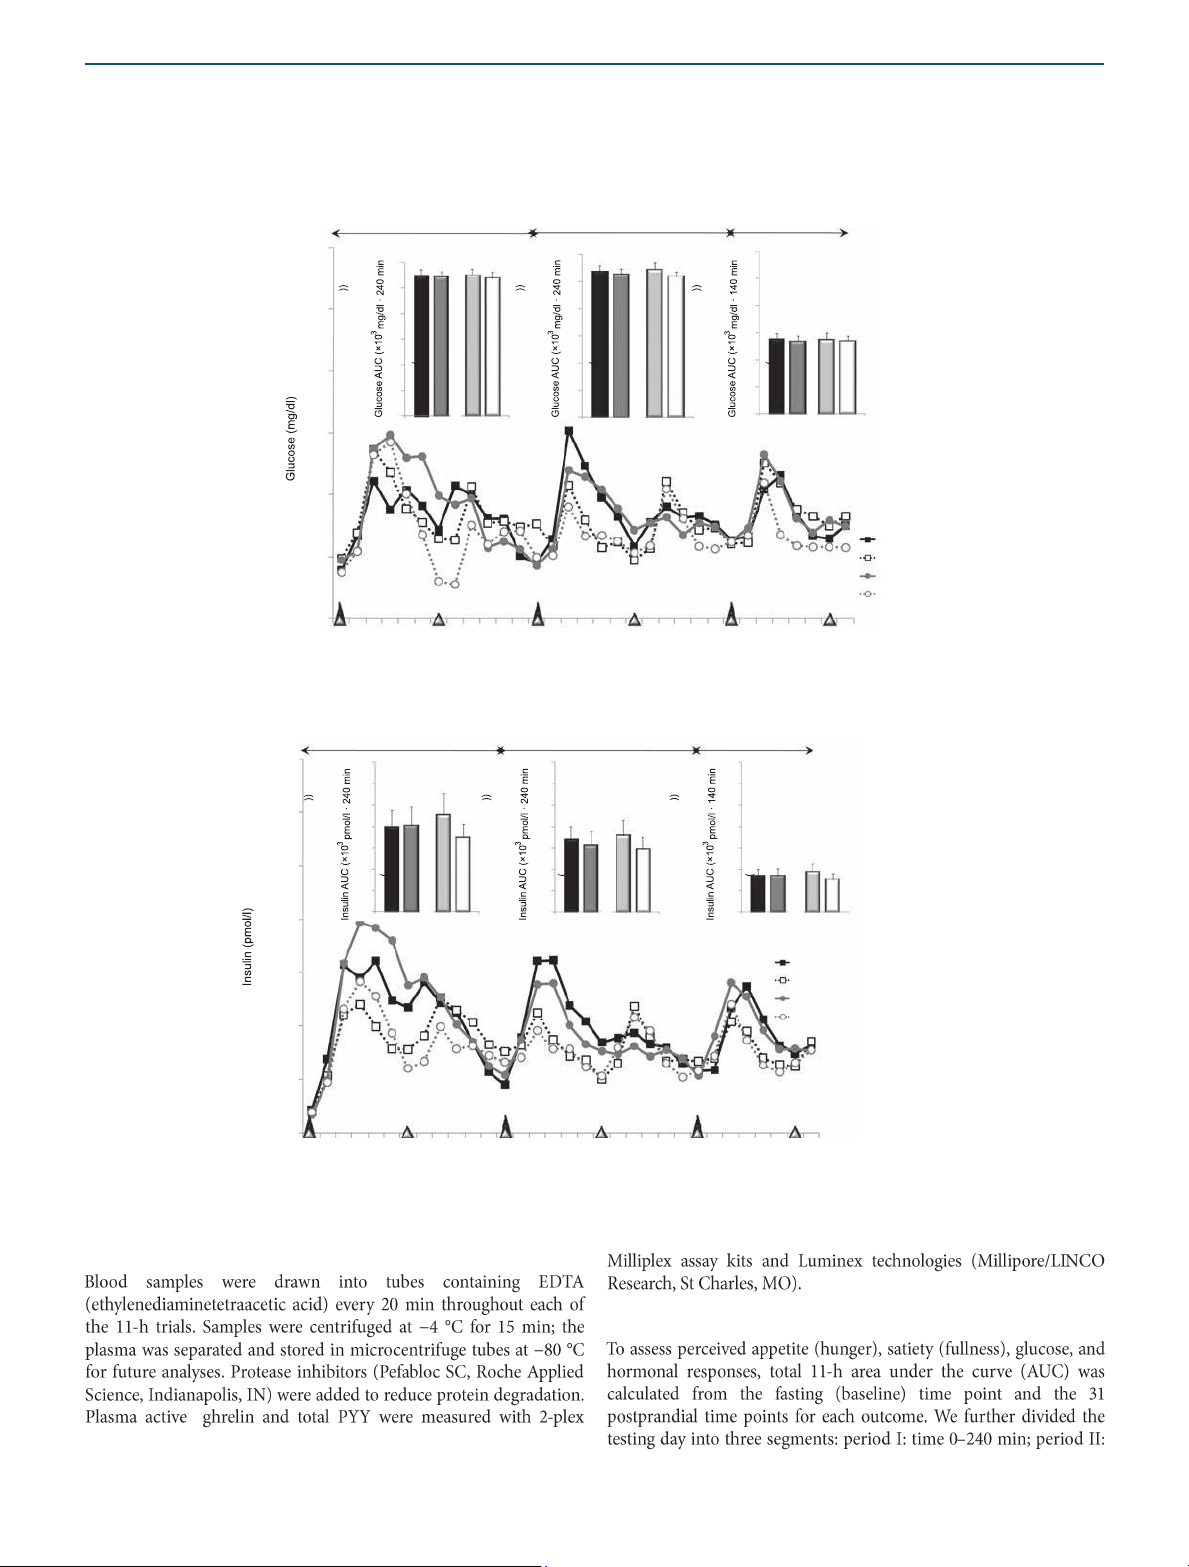
Figure 2 Plasma glucose and insulin responses throughout the 11-h testing days following the dietary protein and meal frequency treatments.
*Main effects; P < 0.05. Period I: time 0–240 min; period II: time 240–480 min; period III: time 480–620 min. Hormonal responses
Data and statistical analysis lOMoAR cPSD| 58504431 ARTICLES
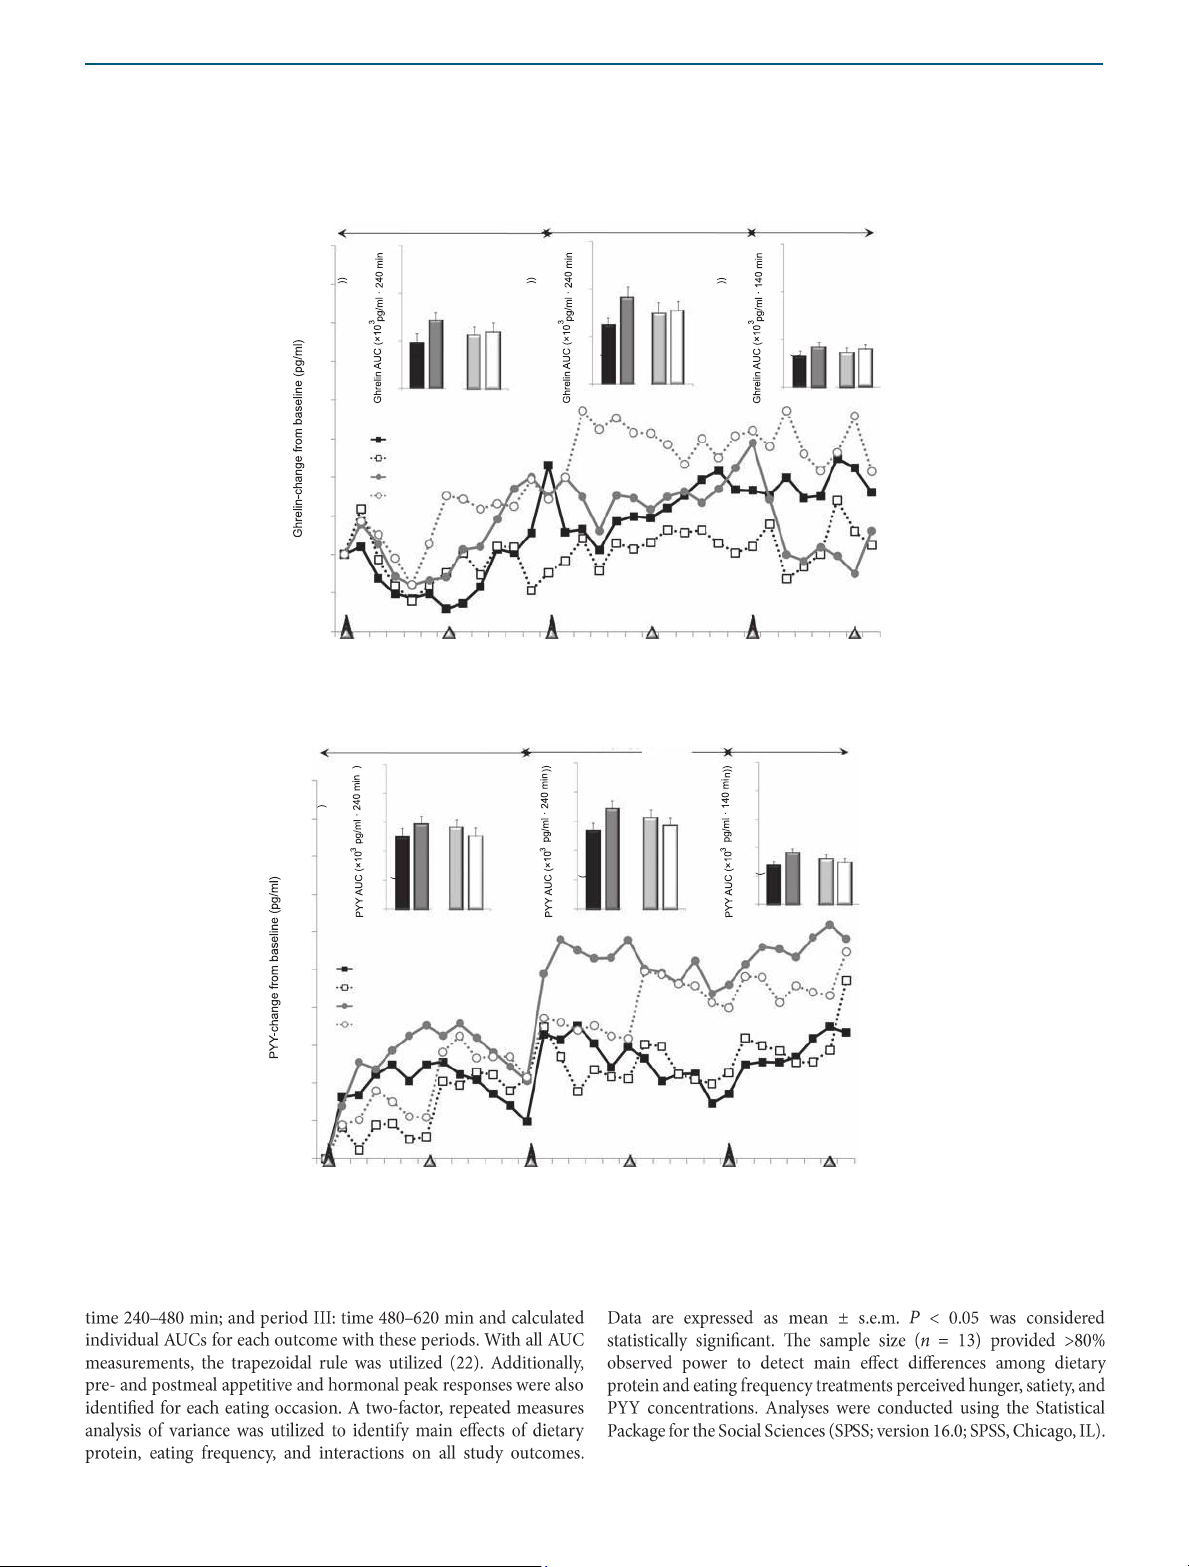
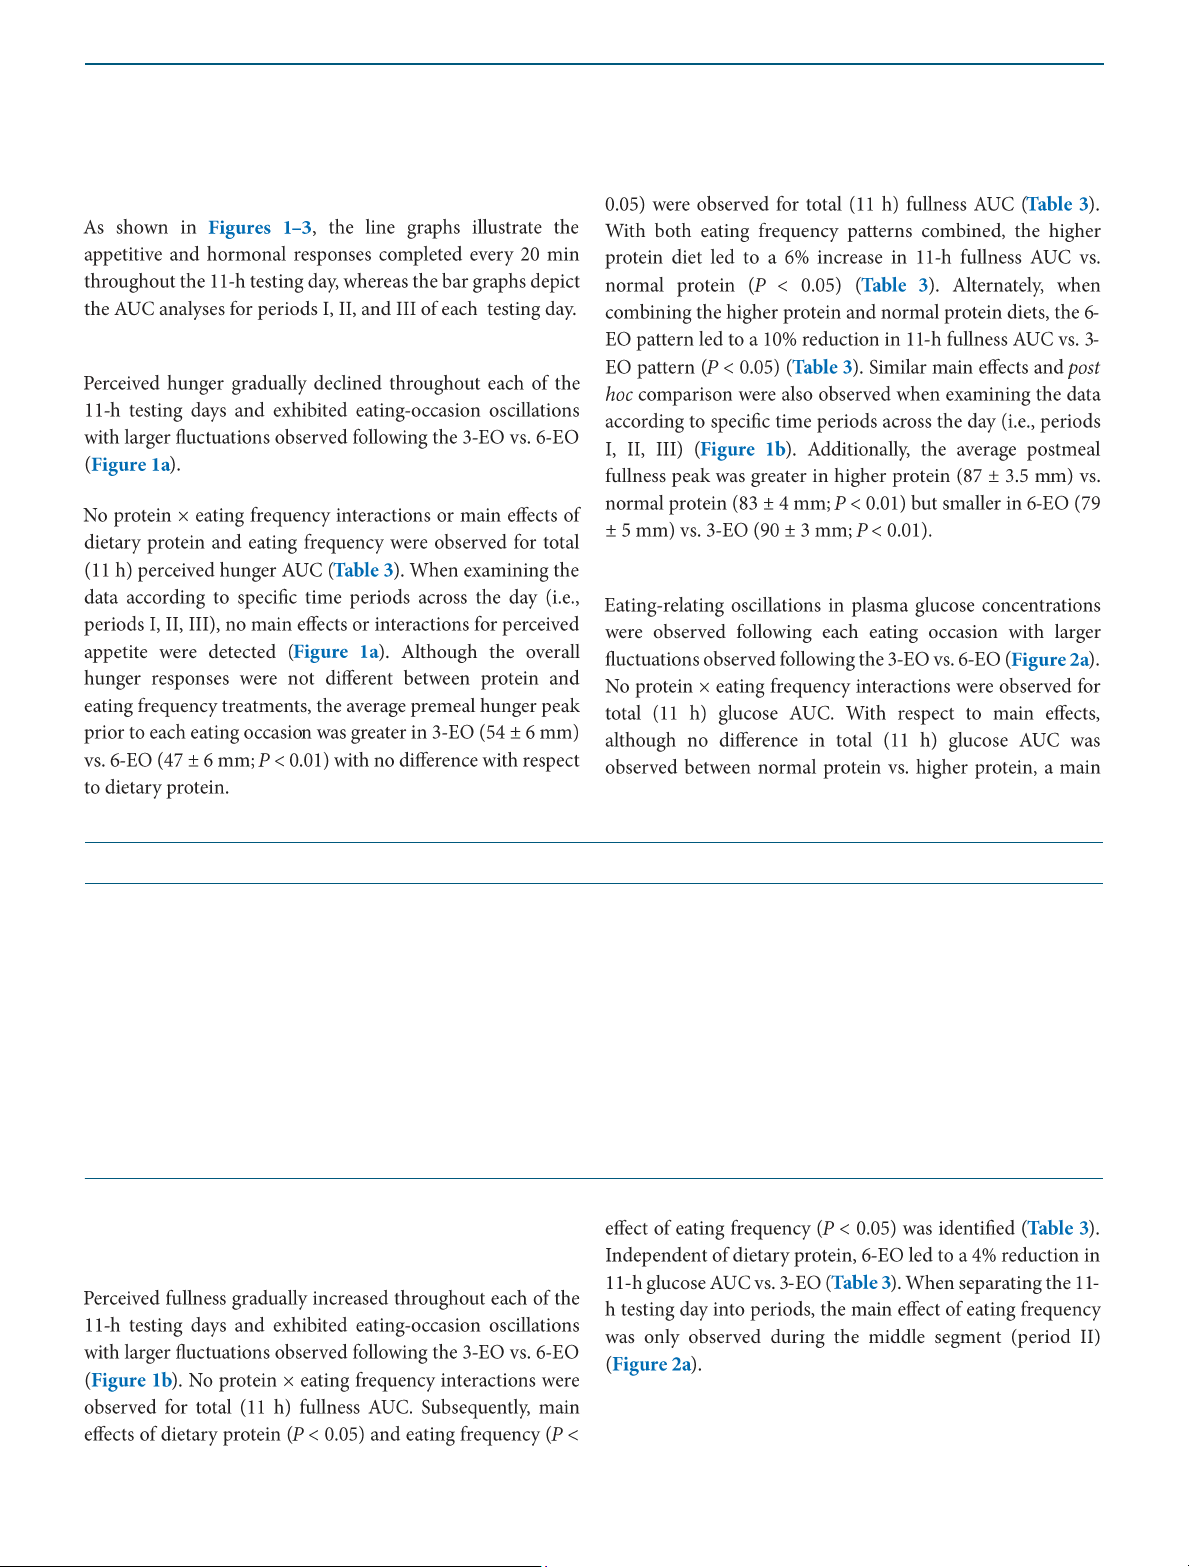
INTERVENTION AND PREVENTION a Active ghrelin Period I Period II Period III 40 15 15 15 * NP vs. HP 35 10 10 10 30 * NP vs. HP 5 5 5 25 0 0 0 NP HP 3-EO 6-EO NP 20 H P 3 - EO 6 - EO NP HP 3-EO 6-EO 15 NP–3-EO NP–6-EO 10 HP–3-EO HP–6-EO 5 0 –5 –10 0 60 120 180 240 300 360 420 480 540 600 Time (min) b Total PYY 25 25 25 50 20 20 20 * NP vs. HP * NP vs. HP * 3-EO vs. 6-EO * 3- EO vs. 6-EO 45 * 3-EO vs. 6-EO 15 15 15 * NP vs. HP 10 40 10 10 5 5 5 35 0 0 0 NP HP 3- EO 6-EO NP HP 3- EO 6-EO NP HP 3- EO 6-EO 30 25 NP–3-EO NP–6-EO 20 HP–3-EO HP–6-EO 15 10 5 0 Period I Period II Period III 0 60 120 180 240 300 360 420 480 540 600 Time (min)
Figure 3 Plasma active ghrelin and total PYY responses throughout the 11-h testing days following the dietary protein and meal
frequency treatments. *Main effects; P < 0.05. Period I: time 0–240 min; period II: time 240–480 min; period III: time 480–620 min. lOMoAR cPSD| 58504431 ARTICLES
INTERVENTION AND PREVENTION RESULTS Perceived appetite Glucose
Table 3 Total area under the curve (AUC) assessments for the appetitive and hormonal responses following each study
treatment in 13 overweight and obese men Outcomes NP; 3-EO NP; 6-EO HP; 3-EO HP; 6-EO Perceived sensations Hunger (×103 (mm·620 min)) 15.3 ± 3.6 17.8 ± 7.1 13.5 ± 2.7 16.2 ± 3.9
Fullness (×103 (mm·620 min))a,b 42.9 ± 3.7 38.6 ± 3.6 45.0 ± 3.0 41.0 ± 3.5
Plasma glucose (×103 (mg/dl·620 min))b 68.4 ± 27.9 67.6 ± 34.3 69.1 ± 26.4 64.8 ± 23.2 Hormonal responses
Insulin (×103 (pmol/l·620 min))b 248 ± 47 205 ± 38 250 ± 56c 191 ± 36
Ghrelin (×103 (pg/ml·620 min))a 13.3 ± 2.5 14.6 ± 3.2 19.9 ± 3.0 20.3 ± 3.1
PYY (×103 (pg/ml·620 min))a,b 35.1 ± 3.3 32.5 ± 3.8 42.6 ± 3.6 38.5 ± 3.5
Data expressed as mean ± s.e.m.
NP, normal protein; PYY, peptide YY; 3-EO, 3 eating occasions; 6-EO, 6 eating occasions.
aMain effect of protein; P < 0.05. bMain effect of eating occasion; P < 0.05. Perceived satiety lOMoAR cPSD| 58504431 ARTICLES
INTERVENTION AND PREVENTION Insulin DISCUSSION Active ghrelin Total PYY lOMoAR cPSD| 58504431 ARTICLES
INTERVENTION AND PREVENTION Limitations ACKNOWLEDGMENTS
The authors thank the study participants for their dedication and compliance
during the testing days; Trent Wisehart, Carmen Martin, Matt Greiser, Laura
Hass, and Amanda Sands for their efforts in performing the testing day
procedures, sample processing, and data entry; Janice Green for preparing
all study foods; Arthur Rosen, MD, who provided medical coverage; and
Doug Maish, EMT-P, who performed all catheter insertions and provided
clinical laboratory services. This study was funded by the National Pork
Board and the American Egg Board—Egg Nutrition Center, with additional
support provided by the Purdue University Ingestive Behavior Research
Center (postdoctoral fellowship to HJL), and the NIH-sponsored Building
Interdisciplinary Research Careers in Women’s Health (BIRCWH) NIH-5 K12 HD052027-04. DISCLOSURE
The authors declared no conflict of interest. lOMoAR cPSD| 58504431 ARTICLES
INTERVENTION AND PREVENTION © 2010 The Obesity Society
22. Wolever TM, Bolognesi C. Prediction of glucose and insulin responses
of normal subjects after consuming mixed meals varying in energy, REFERENCES
protein, fat, carbohydrate and glycemic index. J Nutr 1996;126:2807–
1. Ogden CL, Carroll MD, Curtin LR et al. Prevalence of overweight and 2812.
obesity in the United States, 1999-2004. JAMA 2006;295:1549–1555.
23. Lejeune MP, Westerterp KR, Adam TC, Luscombe-Marsh ND,
2. Wang Y, Beydoun MA, Liang L, Caballero B, Kumanyika SK. Will all
WesterterpPlantenga MS. Ghrelin and glucagon-like peptide 1
Americans become overweight or obese? estimating the progression
concentrations, 24-h satiety, and energy and substrate metabolism
and cost of the US obesity epidemic. Obesity (Silver Spring) 2008;16:
during a high-protein diet and measured in a respiration chamber. Am 2323–2330.
J Clin Nutr 2006;83:89–94.
3. http://www.google.com/search?hl=en&q=6+meals+and+high+protein+f
24. Westerterp-Plantenga MS, Lejeune MP, Smeets AJ, Luscombe-Marsh
or+ weight+loss. Eat 6 meals a day with increased protein, 2009.
ND. Sex differences in energy homeostatis following a diet relatively
4. Dietary Reference Intakes for Energy, Carbohydrate, Fiber, Fat, Fatty
high in protein exchanged with carbohydrate, assessed in a respiration
Acids, Cholesterol, Protein, and Amino Acids. Washington, DC:
chamber in humans. Physiol Behav 2009;97:414–419. National Academy Press, 2002.
25. Diepvens K, Häberer D, Westerterp-Plantenga M. Different proteins
5. Halton TL, Hu FB. The effects of high protein diets on thermogenesis,
and biopeptides differently affect satiety and anorexigenic/orexigenic
satiety and weight loss: a critical review. J Am Coll Nutr 2004;23: 373–
hormones in healthy humans. Int J Obes (Lond) 2008;32:510–518. 385.
26. Solomon TP, Chambers ES, Jeukendrup AE, Toogood AA, Blannin AK.
6. Westerterp-Plantenga MS, Nieuwenhuizen A, Tomé D, Soenen S,
The effect of feeding frequency on insulin and ghrelin responses in
Westerterp KR. Dietary protein, weight loss, and weight maintenance.
human subjects. Br J Nutr 2008;100:810–819.
Annu Rev Nutr 2009;29:21–41.
27. Jenkins DJ, Wolever TM, Vuksan V et al. Nibbling versus gorging:
7. Layman DK, Evans E, Baum JI et al. Dietary protein and exercise
metabolic advantages of increased meal frequency. N Engl J Med
have additive effects on body composition during weight loss in adult 1989;321: 929–934.
women. J Nutr 2005;135:1903–1910.
28. Bloomgarden ZT. Approaches to treatment of pre-diabetes and obesity
8. Leidy HJ, Carnell NS, Mattes RD, Campbell WW. Higher protein intake
and promising new approaches to type 2 diabetes. Diabetes Care
preserves lean mass and satiety with weight loss in pre-obese and 2008;31:1461–1466.
obese women. Obesity (Silver Spring) 2007;15:421–429.
9. Leidy HJ, Mattes RD, Campbell WW. Effects of acute and chronic
protein intake on metabolism, appetite, and ghrelin during weight loss.
Obesity (Silver Spring) 2007;15:1215–1225.
10. Veldhorst M, Smeets A, Soenen S et al. Protein-induced satiety:
effects and mechanisms of different proteins. Physiol Behav
2008;94:300–307. 11. Smeets AJ, Soenen S, Luscombe-Marsh ND,
Ueland Ø, WesterterpPlantenga MS. Energy expenditure, satiety, and
plasma ghrelin, glucagonlike peptide 1, and peptide tyrosine-tyrosine
concentrations following a single high-protein lunch. J Nutr 2008;138:698–702.
12. Leidy HJ, Bossingham MJ, Mattes RD, Campbell WW. Increased
dietary protein consumed at breakfast leads to an initial and sustained
feeling of fullness during energy restriction compared to other meal
times. Br J Nutr 2009;101:798–803.
13. Batterham RL, Heffron H, Kapoor S et al. Critical role for peptide YY in
protein-mediated satiation and body-weight regulation. Cell Metab 2006;4:223–233.
14. Bellisle F, McDevitt R, Prentice AM. Meal frequency and energy
balance. Br J Nutr 1997;77 Suppl 1:S57–S70.
15. Taylor MA, Garrow JS. Compared with nibbling, neither gorging nor a
morning fast affect short-term energy balance in obese patients in a
chamber calorimeter. Int J Obes Relat Metab Disord 2001;25:519– 528.
16. Smeets AJ, Westerterp-Plantenga MS. Acute effects on metabolism
and appetite profile of one meal difference in the lower range of meal
frequency. Br J Nutr 2008;99:1316–1321.
17. Jackson SJ, Leahy FE, Jebb SA et al. Frequent feeding delays the
gastric emptying of a subsequent meal. Appetite 2007;48:199–205.
18. Speechly DP, Rogers GG, Buffenstein R. Acute appetite reduction
associated with an increased frequency of eating in obese males. Int J
Obes Relat Metab Disord 1999;23:1151–1159.
19. Stote KS, Baer DJ, Spears K et al. A controlled trial of reduced meal
frequency without caloric restriction in healthy, normal-weight, middle-
aged adults. Am J Clin Nutr 2007;85:981–988.
20. Harris JL, Bargh JA. Television viewing and unhealthy diet:
implications for children and media interventions. Health Commun 2009;24:660–673.
21. Hill AJ, Blundell JE. Nutrients and behaviour: research strategies for
the investigation of taste characteristics, food preferences, hunger
sensations and eating patterns in man. J Psychiatr Res 1982;17:203– 212.
Tài liệu liên quan:
-
Study Guide for Chapter 1 Concepts and Questions | Môn Microbiology - Trường Đại học Quốc tế, Đại học Quốc gia Thành phố Hồ Chí Minh
103 52 -
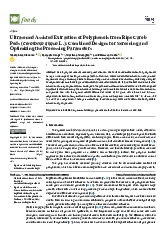
Case study 3: Optimizing Ultrasound-Assisted Extraction of Polyphenols from Carob Pods | Môn Microbiology - Trường Đại học Quốc tế, Đại học Quốc gia Thành phố Hồ Chí Minh
134 67 -
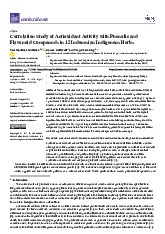
Case Study 1.3: Correlation of Antioxidant Activity in Indonesian Herbs | Môn Microbiology - Trường Đại học Quốc tế, Đại học Quốc gia Thành phố Hồ Chí Minh
120 60 -
Tổng quan về Vi sinh vật học - Tuần 1 | Môn Microbiology - Trường Đại học Quốc tế, Đại học Quốc gia Thành phố Hồ Chí Minh
87 44