Đề thi cuối kỳ học phần Engineering Probability and Statistics năm 2019 | Trường Đại học Quốc tế, Đại học Quốc gia Thành phố Hồ Chí Minh

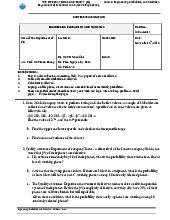
The tensile strength of Portland cement is being studied. Four different mixing techniques can be used economically. A completely randomized experiment was conducted and the following data were collected: Analyze the data from this experiment (use α=0.05) and draw conclusions. A study was performed on wear of a bearing y and its relationship to x1 oil viscosity and x2 load. The following data were obtained. Tài liệu giúp bạn tham khảo, ôn tập và đạt kết quả cao. Mời bạn đón xem.

Thông tin:
4 trang 1 tháng trước

Bình luận

Vui lòng đăng nhập hoặc đăng ký để gửi bình luận.

Đề thi cuối kỳ học phần Engineering Probability and Statistics năm 2019 | Trường Đại học Quốc tế, Đại học Quốc gia Thành phố Hồ Chí Minh

The tensile strength of Portland cement is being studied. Four different mixing techniques can be used economically. A completely randomized experiment was conducted and the following data were collected: Analyze the data from this experiment (use α=0.05) and draw conclusions. A study was performed on wear of a bearing y and its relationship to x1 oil viscosity and x2 load. The following data were obtained. Tài liệu giúp bạn tham khảo, ôn tập và đạt kết quả cao. Mời bạn đón xem.

25 13 lượt tải Tải xuống
THE INTERNATIONAL UNIVERSITY (IU) Course: Engineering Probability and Statistics
School of Industrial Engineering and Management
1
FINAL EXAMINATION
1. This is an open book examination.
2. Calculator and dictionary are allowed. Student takes 2 decimal digits in calculation.
3. Laptop, mobile phone, discussion and materials transfer are strictly prohibited.
Total pages: 05 (including this page)
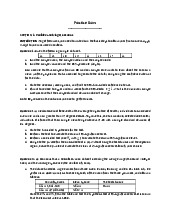
Question 1: (15 pts)
The time to repair an electronic instrument is a normally distributed random variable measured in
hours. The repair times for 16 such instruments chosen at random are as follows:
a) Set up appropriate hypotheses and test for investigating this issue. Use .
b) Construct a 95 percent confidence interval on mean repair time.
Question 2: (15 pts)
The following are the burning times (in minutes) of chemical flares of two different formulations.
The design engineers are interested in both the mean and variance of the burning times
LOGISTICS AND SUPPLY CHAIN MANAGEMENT
Duration:
120
minutes
Dean of School of
Industrial Engineering
and Management:
Dr. Nguyen Van Hop
Dr. Phan Nguyen Ky Phuc
Ms. Nguyen Thi My Hanh
Student ID:
Name:
Date:
Dec, 2019
INSTRUCTIONS:
THE INTERNATIONAL UNIVERSITY (IU) Course: Engineering Probability and Statistics
School of Industrial Engineering and Management
2
a) Test the hypothesis that the two variances are equal. Use .
b) Assumed that two variances are equal, test the hypothesis that the mean burning times areequal.
Use .
Question 3: (20 pts)
The tensile strength of Portland cement is being studied. Four different mixing techniques can be
used economically. A completely randomized experiment was conducted and the following data
were collected: Analyze the data from this experiment (use α=0.05) and draw conclusions.
Technique
Tensile Strength
1
3129 3000
2865
2890
2
3200 3300
2975
3150
3
2800 2900
2985
3050
4
2600 2700
2600
2765
Question 4: (20 pts)
A study was performed on wear of a bearing y and its relationship to x1 oil viscosity and x2 load.
The following data were obtained:
No y X1 X2
THE INTERNATIONAL UNIVERSITY (IU) Course: Engineering Probability and Statistics
School of Industrial Engineering and Management
3
1 160.7045105 100 114 2
206.0939375 132 134
3 270.5334385 151 98
4 154.106724 99 95
5 128.9484191 84 104
6 201.2957487 122 100 7 137.9861501 91 119
8 236.2158622 150 130
The result after making analysis is given as follow:
a) Filling the blank of ANOVA table and make the proper conclusion
b) Write down the regression model and calculate the value of y at x1 = 2 and x2 =100
c) Conduct the proper test to consider whether some inputs can be excluded from the model.
Question 5: (15 pts)
The school of Industrial Engineering and Management would like to add a module into the
curriculum to help students increase their scores. Scores of 10 random students collected before and
after the module is applied are shown below:
ANOVA
df
SS
MS
F
Regression
9262.99772
Residual
Total
18659.18791
Coefficients
Standard
Error
35.86725182
Intercept
15.51762953
2.022718328
0.076818746
X1
-0.772485225
0.13596799
X2
Student
Pre – module score
Post – module score
THE INTERNATIONAL UNIVERSITY (IU) Course: Engineering Probability and Statistics
School of Industrial Engineering and Management
4
a. At 5% level of significance, should the school still add the module in the curriculum?
b. Construct the 99% confidence interval for µ1 - µ2 = µd from these data.
Question 6: (15 pts)
The following data indicate the eect of mixing on temperature of wood pulp
a. Write the regression equation to show the relationship between dependent variable
andindependent variable
b. Estimate the expected temperature of the wood pulp when we use 20 hours of mixing.
GOOD LUCKS!
1
77
72
2
80
81
3
69
68
73
4
73
73
5
75
72
6
70
75
7
73
77
8
75
Hours of mixing
Temperature of wood pulp
2
21
4
27
6
29
8
64
86
10
92
12
| 1/4

Preview text:


THE INTERNATIONAL UNIVERSITY (IU)
Course: Engineering Probability and Statistics
School of Industrial Engineering and Management FINAL EXAMINATION
LOGISTICS AND SUPPLY CHAIN MANAGEMENT Duration: 120 minutes Dean of School of Lecturer: Student ID: Date: Industrial Engineering Dec, 2019 and Management: Dr. Phan Nguyen Ky Phuc Name: Dr. Nguyen Van Hop Ms. Nguyen Thi My Hanh INSTRUCTIONS: 1.
This is an open book examination. 2.
Calculator and dictionary are allowed. Student takes 2 decimal digits in calculation. 3.
Laptop, mobile phone, discussion and materials transfer are strictly prohibited.
Total pages: 05 (including this page) Question 1: (15 pts)
The time to repair an electronic instrument is a normally distributed random variable measured in
hours. The repair times for 16 such instruments chosen at random are as follows:
a) Set up appropriate hypotheses and test for investigating this issue. Use .
b) Construct a 95 percent confidence interval on mean repair time. Question 2: (15 pts)
The following are the burning times (in minutes) of chemical flares of two different formulations.
The design engineers are interested in both the mean and variance of the burning times 1
THE INTERNATIONAL UNIVERSITY (IU)
Course: Engineering Probability and Statistics
School of Industrial Engineering and Management
a) Test the hypothesis that the two variances are equal. Use .
b) Assumed that two variances are equal, test the hypothesis that the mean burning times areequal. Use . Question 3: (20 pts)
The tensile strength of Portland cement is being studied. Four different mixing techniques can be
used economically. A completely randomized experiment was conducted and the following data
were collected: Analyze the data from this experiment (use α=0.05) and draw conclusions.
Technique Tensile Strength 1 3129 3000 2865 2890 2 3200 3300 2975 3150 3 2800 2900 2985 3050 4 2600 2700 2600 2765 Question 4: (20 pts)
A study was performed on wear of a bearing y and its relationship to x1 oil viscosity and x2 load.
The following data were obtained: No y X1 X2 2
THE INTERNATIONAL UNIVERSITY (IU)
Course: Engineering Probability and Statistics
School of Industrial Engineering and Management 1 160.7045105 100 114 2 206.0939375 132 134 3 270.5334385 151 98 4 154.106724 99 95 5 128.9484191 84 104 6 201.2957487 122 100 7 137.9861501 91 119 8 236.2158622 150 130
The result after making analysis is given as follow: ANOVA df SS MS F Regression 9262.99772 Residual Total 18659.18791 Standard Coefficients Error Intercept 35.86725182 15.51762953 X1 2.022718328 0.076818746 X2 -0.772485225 0.13596799
a) Filling the blank of ANOVA table and make the proper conclusion
b) Write down the regression model and calculate the value of y at x1 = 2 and x2 =100
c) Conduct the proper test to consider whether some inputs can be excluded from the model. Question 5: (15 pts)
The school of Industrial Engineering and Management would like to add a module into the
curriculum to help students increase their scores. Scores of 10 random students collected before and
after the module is applied are shown below: Student Pre – module score Post – module score 3
THE INTERNATIONAL UNIVERSITY (IU)
Course: Engineering Probability and Statistics
School of Industrial Engineering and Management 1 77 72 2 80 81 3 69 68 4 73 73 5 73 75 6 72 70 7 75 73 8 77 75
a. At 5% level of significance, should the school still add the module in the curriculum?
b. Construct the 99% confidence interval for µ1 - µ2 = µd from these data. Question 6: (15 pts)
The following data indicate the effect of mixing on temperature of wood pulp Hours of mixing
Temperature of wood pulp 2 21 4 27 6 29 8 64 10 86 12 92
a. Write the regression equation to show the relationship between dependent variable andindependent variable
b. Estimate the expected temperature of the wood pulp when we use 20 hours of mixing. GOOD LUCKS! 4