Đề thi cuối kỳ học phần Engineering Probability and Statistics năm 2022 | Trường Đại học Quốc tế, Đại học Quốc gia Thành phố Hồ Chí Minh

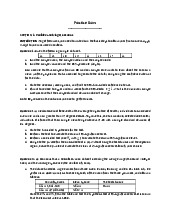
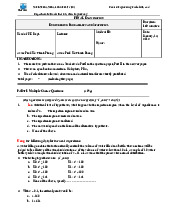
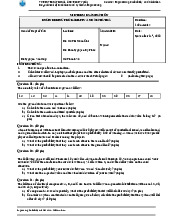
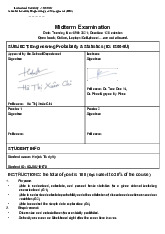
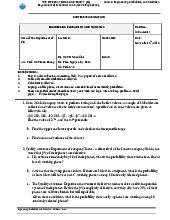
To estimate μ, the average nicotine content of a newly marketed cigarette, 25 of these cigarettes are randomly chosen, and their nicotine contents are determined. It is known from past experience that the standard deviation of the nicotine content of a cigarette is equal to 0.8 milligrams. If the average nicotine finding is 1.74 milligrams, what is a 90% confidence interval estimator of μ? (20p). Tài liệu giúp bạn tham khảo, ôn tập và đạt kết quả cao. Mời bạn đón xem.

Thông tin:
5 trang 1 tháng trước

Bình luận

Vui lòng đăng nhập hoặc đăng ký để gửi bình luận.

Đề thi cuối kỳ học phần Engineering Probability and Statistics năm 2022 | Trường Đại học Quốc tế, Đại học Quốc gia Thành phố Hồ Chí Minh

To estimate μ, the average nicotine content of a newly marketed cigarette, 25 of these cigarettes are randomly chosen, and their nicotine contents are determined. It is known from past experience that the standard deviation of the nicotine content of a cigarette is equal to 0.8 milligrams. If the average nicotine finding is 1.74 milligrams, what is a 90% confidence interval estimator of μ? (20p). Tài liệu giúp bạn tham khảo, ôn tập và đạt kết quả cao. Mời bạn đón xem.

30 15 lượt tải Tải xuống
International University - VNUHCM
School of Industrial Engineering and Management
Final Examination
Date: Thursday, Jan 20, 2022; Duration: 120 minutes
INSTRUCTIONS: the total of point is 100 (equivalent to 40% of the course)
1. Purpose:
Conduct the one population and 2 populations hypothesis testing (G3)
Conduct the ANOVA test and Linear Regression (G4)
2. Requirements:
Read carefully each question and answer it
Write the answers and draw models CLEAN and TIDY directly in the exam paper.
Submit your exam including this paper on Blackboard when the exam time is over.
QUESTIONS
Open/close book
;
Online;
Laptops are
allowed.
SUBJECT: Engineering Probability & Statistics (ID: IS004IU)
Approval by the School/Department of
Full name:
Lecturer: Dr. Tran Duc Vi
Signature
Full name: Tran Duc Vi
Full name: Phan Nguyen Ky Phuc
Proctor 1
Full name:
Proctor 2
Signature
Full name:
STUDENT INFO
Student name:
Student ID:
International University – VNUHCM Student Name:………... …………. School of Industrial
Engineering and Management Student ID:
……………………….
/62
Question 1: (20 points)
To estimate μ, the average nicotine content of a newly marketed cigarette, 25 of these cigarettes are randomly
chosen, and their nicotine contents are determined. It is known from past experience that the standard deviation
of the nicotine content of a cigarette is equal to 0.8 milligrams. If the average nicotine finding is 1.74 milligrams,
what is a 90% confidence interval estimator of μ? (20p)
Answer
From the sample
The 90% CI of UB:
LB:
Question 2: (20 points)
When a certain production process is operating properly, it produces items that each has a measurable
characteristic with mean 122 and standard deviation 9. However, occasionally the process goes out of control,
which results in a change in the mean of the items produced. Given a random sample of 10 recently produced
items had the following values:
a. Is the production process operating properly? Conduct the appropriate test of hypothesis and draw the
conclusion at a 10% significance level. (15p)
b. Calculate 95% confidence interval of population parameter given in this question. (5p)
Answer
From the sample:
Hypothesis
Test statistic: , z-table is used for looking up the critical values
Critical value with
Since , we cannot reject H
0
. There is no strong evidence that the process is out of control
95% CI for the mean of population UB:
LB:
Question 3: (20 points)
An automobile manufacturer wants to test whether the new type of lubricant changes the fuel consumption of
its car models. The new type of lubricant is tested at a random sample of 12 car models. Data on the amount of
fuel consumption (gallons) the week before and the week after the change in lubricant are given below:
123
120
115
125
132
127
130
118
125
128
Car model
1
2
3
4
5
6
7
8
9
10
11
12
Fuel
Consumption
)
(
gallons
Before
4.4
4.0
5.8
4.7
4.3
5.0
5.4
6.0
4.6
4.8
5.5
4.6
After
5.8
4.4
5.4
5.6
4.3
5.7
5.0
5.7
4.8
5.1
4.6
4.6
International University – VNUHCM Student Name:………... …………. School of Industrial
Engineering and Management Student ID:
……………………….
Is there any difference in fuel consumption level before and after the change in type of lubricant? If yes, should
the automobile manufacturer change the type of lubricant for fuel efficiency? Conduct the hypothesis and draw
the conclusion at α = 0.05 (20p)
Answer
Define the Difference = After-Before
From the data
Hypothesis
Test statistic: , t-table with dof = 11 is used for looking up the critical values
Critical value with
Since , we cannot reject H
0
. There is no strong evidence that new type of lubrican change fuel consumption.
Question 4: ANOVA (20 points)
Five servings each of three different brands of processed meat were tested for fat content. The following data
(in fat percentage per gram) resulted.
1. Does the fat content differ depending on the brand? (15p)
2. Find confidence intervals for quantities μ
1
– μ
2
that, with 95 percent confidence, are valid. (5p)
Answer
Hypothesis
H
1
: At least one
Anova: Single Factor
SUMMARY
Brand 1 5 165 33 2.5
/36
Brand 2
5
171
34.2
19.7
Brand 3
5
164
32.8
14.7
ANOVA
Source of Variaon
SS
df
MS
F
P-value
F crit
Between Groups
5.733
2
2.867
0.233
0.796
3.88
Brand 1
Brand 2
Brand 3
32
41
36
34
32
37
31
34
30
35
29
28
33
35
33
Groups
Count
Sum
Average
Variance
International University – VNUHCM Student Name:………... …………. School of Industrial
Engineering and Management Student ID:
……………………….
/64
Within Groups
147.6
12
12.3
Total
153.33
3
14
From the ANOVA table we cannot reject H
0
. It can be concluded that the fat content does not differ depeding on
brand
Question 5: Regression (20 points)
Given a regression model in form of: Y = β
0
+ β
1
X
1
+ β
2
X
2
a. Find linear regression equation to the following data set. (10p)
b. Among two variables X
1
, X
2
, is there any variable that can be eliminated from the regression equation
with α=5%. Why? (10p) Given that standard error of X
1
= 5.05 and X
2
= 2.28
Define the differ = Brand 1 – Brand 2
Brand 1
Brand 2
32
41
34
32
34
31
29
35
35
33
mean
33
34.2
std
4.438
1.581
3.94
0.5
w
df
4.999
RD =4
2.776
T-val
-7.050
LB
4.650
UB
X
1
X
2
Y
14
11
84
16
10
81
22
9
73
24
74
8
20
4
67
29
8
87
26
77
16
15
76
25
29
69
6
24
82
12
International University – VNUHCM Student Name:………... …………. School of Industrial
Engineering and Management Student ID:
……………………….
SUMMARY OUTPUT
Mulple R
0.242
R Square
0.0584
Adjusted R Square
-0.211
Standard Error
7.149
Observaons
10
ANOVA
df
SS
MS
F
Signicanc
e F
Regression
2
22.191
11.096
0.217
0.810
Residual
7
357.808
51.115
Total
9
380
Y= 74.565 -0.017X
1
+ 0.257X
2
Here we can make 2 conclusions:
From the ANOVA table: the significant F is much larger than p-value => The linear regression model is
unsuitable to explain the data
Or
Based on the 2
nd
table, it can be seen that both X
1
and X
2
have P-value much higher than significant level
alpha 5% => we can exclude both X
1
and X
2
from the model
/56
– END –
Coecient
s
Standard
Error
t Stat
P-value
LB 95%
UB 95%
Intercept
74.565
13.149
5.671
0.001
43.472
105.659
X1
-0.017
0.470
-0.036
0.972
-1.129
1.095
X2
0.257
0.437
0.589
0.574
-0.775
1.290
Regression Stascs
| 1/5

Preview text:

International University - VNUHCM
School of Industrial Engineering and Management Final Examination
Date: Thursday, Jan 20, 2022; Duration: 120 minutes
Open/close book ; Online; Laptops are allowed.
SUBJECT: Engineering Probability & Statistics (ID: IS004IU)
Approval by the School/Department of Lecturer: Dr. Tran Duc Vi Signature Signature Full name: Full name: Tran Duc Vi
Full name: Phan Nguyen Ky Phuc Proctor 1 Proctor 2 Signature Signature Full name: Full name: STUDENT INFO Student name: Student ID:
INSTRUCTIONS: the total of point is 100 (equivalent to 40% of the course) 1. Purpose:
• Conduct the one population and 2 populations hypothesis testing (G3)
• Conduct the ANOVA test and Linear Regression (G4) 2. Requirements:
• Read carefully each question and answer it
• Write the answers and draw models CLEAN and TIDY directly in the exam paper.
• Submit your exam including this paper on Blackboard when the exam time is over. QUESTIONS
International University – VNUHCM Student
Name:………... …………. School of Industrial
Engineering and Management Student ID: ……………………….
Question 1: (20 points)
To estimate μ, the average nicotine content of a newly marketed cigarette, 25 of these cigarettes are randomly
chosen, and their nicotine contents are determined. It is known from past experience that the standard deviation
of the nicotine content of a cigarette is equal to 0.8 milligrams. If the average nicotine finding is 1.74 milligrams,
what is a 90% confidence interval estimator of μ? (20p) Answer From the sample The 90% CI of UB: LB: Question 2: (20 points)
When a certain production process is operating properly, it produces items that each has a measurable
characteristic with mean 122 and standard deviation 9. However, occasionally the process goes out of control,
which results in a change in the mean of the items produced. Given a random sample of 10 recently produced
items had the following values: 123 120 115 125 132 127 130 118 125 128
a. Is the production process operating properly? Conduct the appropriate test of hypothesis and draw the
conclusion at a 10% significance level. (15p)
b. Calculate 95% confidence interval of population parameter given in this question. (5p) Answer From the sample: Hypothesis
Test statistic: , z-table is used for looking up the critical values Critical value with
Since , we cannot reject H0. There is no strong evidence that the process is out of control
95% CI for the mean of population UB: LB:
Question 3: (20 points)
An automobile manufacturer wants to test whether the new type of lubricant changes the fuel consumption of
its car models. The new type of lubricant is tested at a random sample of 12 car models. Data on the amount of
fuel consumption (gallons) the week before and the week after the change in lubricant are given below: Car model 1 2 3 4 5 6 7 8 9 10 11 12 Fuel Before 4.7 4.3 4.8 5.4 6.0 4.6 5.0 5.5 4.6 4.4 4.0 5.8 Consumption After 5.6 4.6 4.3 5.7 5.0 5.7 4.8 5.1 4.6 4.4 5.8 5.4 ( gall ) ons /62
International University – VNUHCM Student
Name:………... …………. School of Industrial
Engineering and Management Student ID: ……………………….
Is there any difference in fuel consumption level before and after the change in type of lubricant? If yes, should
the automobile manufacturer change the type of lubricant for fuel efficiency? Conduct the hypothesis and draw
the conclusion at α = 0.05 (20p) Answer
Define the Difference = After-Before From the data Hypothesis
Test statistic: , t-table with dof = 11 is used for looking up the critical values Critical value with
Since , we cannot reject H0. There is no strong evidence that new type of lubrican change fuel consumption.
Question 4: ANOVA (20 points)
Five servings each of three different brands of processed meat were tested for fat content. The following data
(in fat percentage per gram) resulted. Brand 1 Brand 2 Brand 3 32 41 36 34 32 37 31 34 30 35 29 28 33 35 33
1. Does the fat content differ depending on the brand? (15p)
2. Find confidence intervals for quantities μ1 – μ2 that, with 95 percent confidence, are valid. (5p) Answer Hypothesis H1: At least one Anova: Single Factor SUMMARY Groups Count Sum Average Variance Brand 1 5 165 33 2.5 /36 Brand 2 5 171 34.2 19.7 Brand 3 5 164 32.8 14.7 ANOVA Source of Variation SS df MS F P-value F crit Between Groups 5.733 2 2.867 0.233 0.796 3.88
International University – VNUHCM Student
Name:………... …………. School of Industrial
Engineering and Management Student ID: ………………………. Within Groups 147.6 12 12.3 153.33 Total 3 14
From the ANOVA table we cannot reject H0. It can be concluded that the fat content does not differ depeding on brand
Define the differ = Brand 1 – Brand 2 Brand 1 Brand 2 32 41 34 32 31 34 35 29 33 35 mean 33 34.2 std 1.581 4.438 w 0.5 3.94 df 4.999 RD =4 T-val 2.776 LB -7.050 UB 4.650
Question 5: Regression (20 points)
Given a regression model in form of: Y = β0 + β1X1 + β2X2 X 1 X 2 Y 14 11 84 16 10 81 22 9 73 24 8 74 20 4 67 29 8 87 26 16 77 15 25 76 29 6 69 24 12 82
a. Find linear regression equation to the following data set. (10p)
b. Among two variables X1, X2, is there any variable that can be eliminated from the regression equation
with α=5%. Why? (10p) Given that standard error of X1 = 5.05 and X2 = 2.28 /64
International University – VNUHCM Student
Name:………... …………. School of Industrial
Engineering and Management Student ID: ………………………. SUMMARY OUTPUT Regression Statistics Multiple R 0.242 R Square 0.0584 Adjusted R Square -0.211 Standard Error 7.149 Observations 10 ANOVA Coefficient Standard s Error t Stat P-value LB 95% UB 95% Intercept 74.565 13.149 5.671 0.001 43.472 105.659 X1 -0.017 0.470 -0.036 0.972 -1.129 1.095 X2 0.257 0.437 0.589 0.574 -0.775 1.290 Significanc df SS MS F e F Regression 2 22.191 11.096 0.217 0.810 Residual 7 357.808 51.115 Total 9 380 Y= 74.565 -0.017X1 + 0.257X2
Here we can make 2 conclusions:
From the ANOVA table: the significant F is much larger than p-value => The linear regression model is
unsuitable to explain the data Or
Based on the 2nd table, it can be seen that both X1 and X2 have P-value much higher than significant level
alpha 5% => we can exclude both X1 and X2 from the model /56 – END –