Emerging from Turbulence - Analysis & Recommendations (2023) | Môn Business Analysis and Valuation - Trường Đại học Quốc tế, Đại học Quốc gia Thành phố Hồ Chí Minh
Emerging from Turbulence - Analysis & Recommendations (2023) Môn Business Analysis and Valuation. Tài liệu được sưu tầm gồm 33 trang, giúp bạn ôn tập tốt hơn. Mời các bạn đón xem.
Môn: Business Analysis and Valuation (BAV 2023) 6 tài liệu
Trường: Trường Đại học Quốc tế, Đại học Quốc gia Thành phố Hồ Chí Minh 2 K tài liệu
Tác giả:


Preview text:
lOMoAR cPSD| 59085392 lOMoAR cPSD| 59085392 30 th September 2022
Qantas Airways Limited ( ASX : QAN )
‘ E merging from turbulence , Australia’s Phoenix soars to new heights ’
GICS Sector: Industrials
GICS Industry: Transportation
Australian Securities Exchange (ASX) RECOMMENDATION: BUY EXECUTIVE SUMMARY Exhibit 1: QAN.ASX Overview Positive update on 4-Nov RASK uplift through 22 QAN AGM First Trading Date Aug-95 capacity discipline Target Price A$6.41 ACCC Quarterly Better than expected 7-Dec Airline airfare price index Current Price* A$5.24 22 Competition reflecting rational report competitive behaviour Upside 22.3% Dividend yield 0.0% Market appreciation for QAN's ability to Feb-23 1H23 earnings preserve unit Market capitalisation* (A$m) 9,958 announcement profitability in spite of cost inflation concerns Shares outstanding* (m) 1,886 QAN’s FY23 ROIC and Free Float 99% EBIT margins add Aug-23 FY23 results further credibility to released FY24 Management 1 Month VWAP* A$5.20 targets 52 Week High A$5.97 Source: SURG Analysis
We initiate coverage on Qantas Airways Limited (ASX:QAN) with a BUY Recommendation based on a 12-month target 52 Week Low A$4.21
price of $6.41, implying a 22.3% upside to the last close of $5.24 as at 29 September 2022. This blended target
*All prices as of close 29 Sep 2022
price represents a weighted mix of our discounted cash flow and relative valuation models.
Source: Refinitiv Eikon, SURG Analysis
QAN is Australia’s enduring and globally recognised flagship carrier with dominant market share in an oligopolistic
domestic airline industry. Over the past two years, QAN battled through the grounding of its fleet from COVID-related
border closures which cost the company almost A$20b in foregone revenue. Yet, QAN is rising from the ashes and
emerging from the pandemic with greater earnings power and operational efficiency. Australia’s red kangaroo has
discovered a renewed runway to create shareholder value.
Our proprietary analysis suggests that QAN’s post-COVID rebirth has been materially mispriced as the market has
underappreciated (1) the robustness of QAN’s demand outlook, (2) QAN’s operational agility to recover cost
headwinds and (3) QAN’s resilient, diverse portfolio with a Loyalty flywheel complemented by Freight growth.
Consequently, we expect positive earnings announcements to catalyse a re-rating of QAN’s share price over the next
12 months as it continues to exemplify the ‘Spirit of Australia’: an Australian icon known as a quality, agile business.
1. Clear skies ahead: the market has underestimated the strength and resilience of QAN’s demand profile
The market has not accurately assessed the forward passenger demand profile of QAN, underappreciating the
robustness of near-term pent-up demand release and overstating the medium-term demand tapering. Our estimates
diverge from market consensus on two key metrics: load factors and yields across the short and medium term. Our
differentiated view is materialised in a FY23 Group RASK uplift of 18.4% and sustained medium term load factors
regressing to historically averages. Additionally:
Exhibit 2: 5-Year Share Price Rebased Exhibit 3: Financial Ratios •
QAN’s demand recovery has been severely discounted comparative to European and North American peers, with
QAN priced ~2 standard deviations below historical trading patterns across key peer sets; Ratios FY23e •
QAN’s share price has remained depressed due to transitory operational challenges, notwithstanding all
underlying performance metrics indicating a recovery; and Net Debt / EBITDA 1.6x •
Despite leading indicators supporting a reasonably sustained demand environment post FY23, QAN’s market
price implies a significant 6.2% FY24/25 load factor drawdown below long-term averages. Interest Coverage Ratio 4.6x
2. The sky’s the limit: a renewed cost base and accretive CAPEX enhance QAN’s post-COVID profitability EBITDA Margin 16.6%
QAN has emerged from the pandemic a fundamentally more agile carrier with a reduced fixed cost base and NPAT Margin 4.9%
underappreciated unit profitability. Although it is flying into an inflationary environment characterised by high fuel
prices, QAN has significant operational flexibility to recover elevated costs by adjusting capacity settings. Together ROE* n.m.
with its focus on inflation-offsetting cost initiatives as well as margin-accretive CAPEX, the market has undervalued
the strength of QAN’s post-COVID earnings power. Our FY24e EBIT margin is 42bps above consensus, reflecting:
*Book equity distorted due to FY20-FY22 statutory losses •
Industry-wide capacity discipline coupled with greater cost variabilisation allowing QAN to optimise Available
Seat Kilometres (ASKs) and recoup higher fuel prices;
Source: Refinitiv Eikon, SURG Analysis •
An overlooked target to offset inflation, key to ensuring that QAN’s cost-reducing Recovery Plan translates into
sustainable earnings uplift; and
Exhibit 4: Share Price Catalysts •
Domestic fleet renewal Project Winton to bring unit revenue benefits from route optionality and seat upgauging, Date Event Catalyst
whilst realising unit cost savings from higher aircraft utilisation and lower fuel consumption. HK/ Japan/ SE Asia travel demand Taiwan removing driving Oct-22
3. QAN’s portfolio flies under the radar: quality revenue diversification reduces cash flow risk hotel quarantine further international recovery lOMoAR cPSD| 59085392
QAN’s diverse portfolio mitigates
by materially increasing serviceable Available Freight Tonne Kilometres (AFTK); and
cash flow risk through providing •
QAN will capture further international freight demand given its valuable import and export route catchment multiple quality and cash-
footprint, resulting in increased freight yields and volumes. generative revenue streams
uncorrelated to the oil cycle. Its
Loyalty business model holds a KEY FINANCIALS competitive moat through a
cashgenerative earn and burn point
flywheel which increases customer Historical (Statutory) SURG Forecast
switching costs and stickiness. Fiscal Year Ending 30 June FY16a FY17a FY18a FY19a FY20a
FY21a FY22a FY23f FY24f FY25f FY26f FY27f FY28f
Further, QAN has fundamentally Revenue 16,200 16,057 17,128 17,966
9,108 18,162 19,419 20,094 20,894 21,684 22,445 14,257
changed gears to bolster its ability 5,934 Growth (0.9%) 6.7% 4.9% 53.5% 99.4% 6.9% 3.5% 4.0% 3.8% 3.5%
to capture Australia’s long term (20.6%) (58.4%) EBITDA 3,328 3,108 3,334 3,206 1,057 123 254 3,023 4,011 4,458 4,929 5,192 5,368
structural shift in ecommerce. We (underlying) expect that: •
QAN’s Loyalty flywheel holds Growth (6.6%) 7.3% (3.8%)
106.5% 1,090% 32.7% 11.2% 10.6% 5.3% 3.4% underappreciated scope to Margin
20.5% 19.4% 19.5% 17.8% 2.8%
16.6% 20.7% 22.2% 23.6% 23.9% 23.9% encourage members to match
their Points Earned with Points 7.4% 2.1% Burnt, fuelling unrivalled EBIT 1,643 1,370 1,534 1,474 (2,437) (2,050) (890) 1,532 2,162 2,464 2,813 2,949 2,999 customer participation and (statutory)
satisfaction in its ecosystem; • Exclusive contracts and PBT 1,424 1,181 1,352 1,192 (2,708) (2,351) (1,191) 1,279 1,786 2,048 2,366 2,494 2,600 arrangements with Australia NPAT 1,029 853 953 840 (1,964) (1,728) (860) 896 1,250 1,434 1,657 1,746 1,820 Post (A$1.4b), Toll Group and FCF 469 322 242 (940) (410) 2,344 (2,205) 643 959 1,228 1,328 1,366 Amazon, alongside 6 A321 DPS (cents) 0.07 0.14 0.17 0.25 0.00 0.00 0.00 0.00 0.36 0.41 0.47 0.50 0.52
freighter plane purchases, will allow QAN to accommodate
Australia’s e-commerce growth lOMoAR cPSD| 59085392
Exhibit 5a: QAN Domestic route network BUSINESS DESCRIPTION lOMoAR cPSD| 59085392 2017 2018 2019 2020 2021 2022E Source: BITRE Overview
QAN enjoys a history spanning more than 100 years, servicing Australia’s largest number of domestic and
international flights and destinations. The QAN Group has grown to a fleet of 311 aircrafts with 132 domestic
routes and 55 international destinations to serve 21m+ customers in FY22 and an annual 50m+ historically. As a
historically reliable Australian brand, QAN saw strong cash flows and top-line growth after the early 2010s capacity
wars and prior to COVID-19 border closures. Strategy: QAN aims to build brand equity as the ‘international carrier
of choice’ and curate customer stickiness through its Loyalty program. QAN has strategic focus on operational
efficiencies, with the domestic fleet renewal program Project Winton and ultra-long-haul Project Sunrise (providing
Australian-first Sydney to London/New York non-stop flights). Notably, QAN is in the third phase of its A$1b cost
recovery transformation plan, having undergone balance sheet repair and planning to return to ‘normal’ levels of
operation as benchmarked against FY19. This will further allow QAN to capitalise on the lower domestic competitive
intensity and remain ahead of international airlines slower to re-enter the Australian market. Business Model
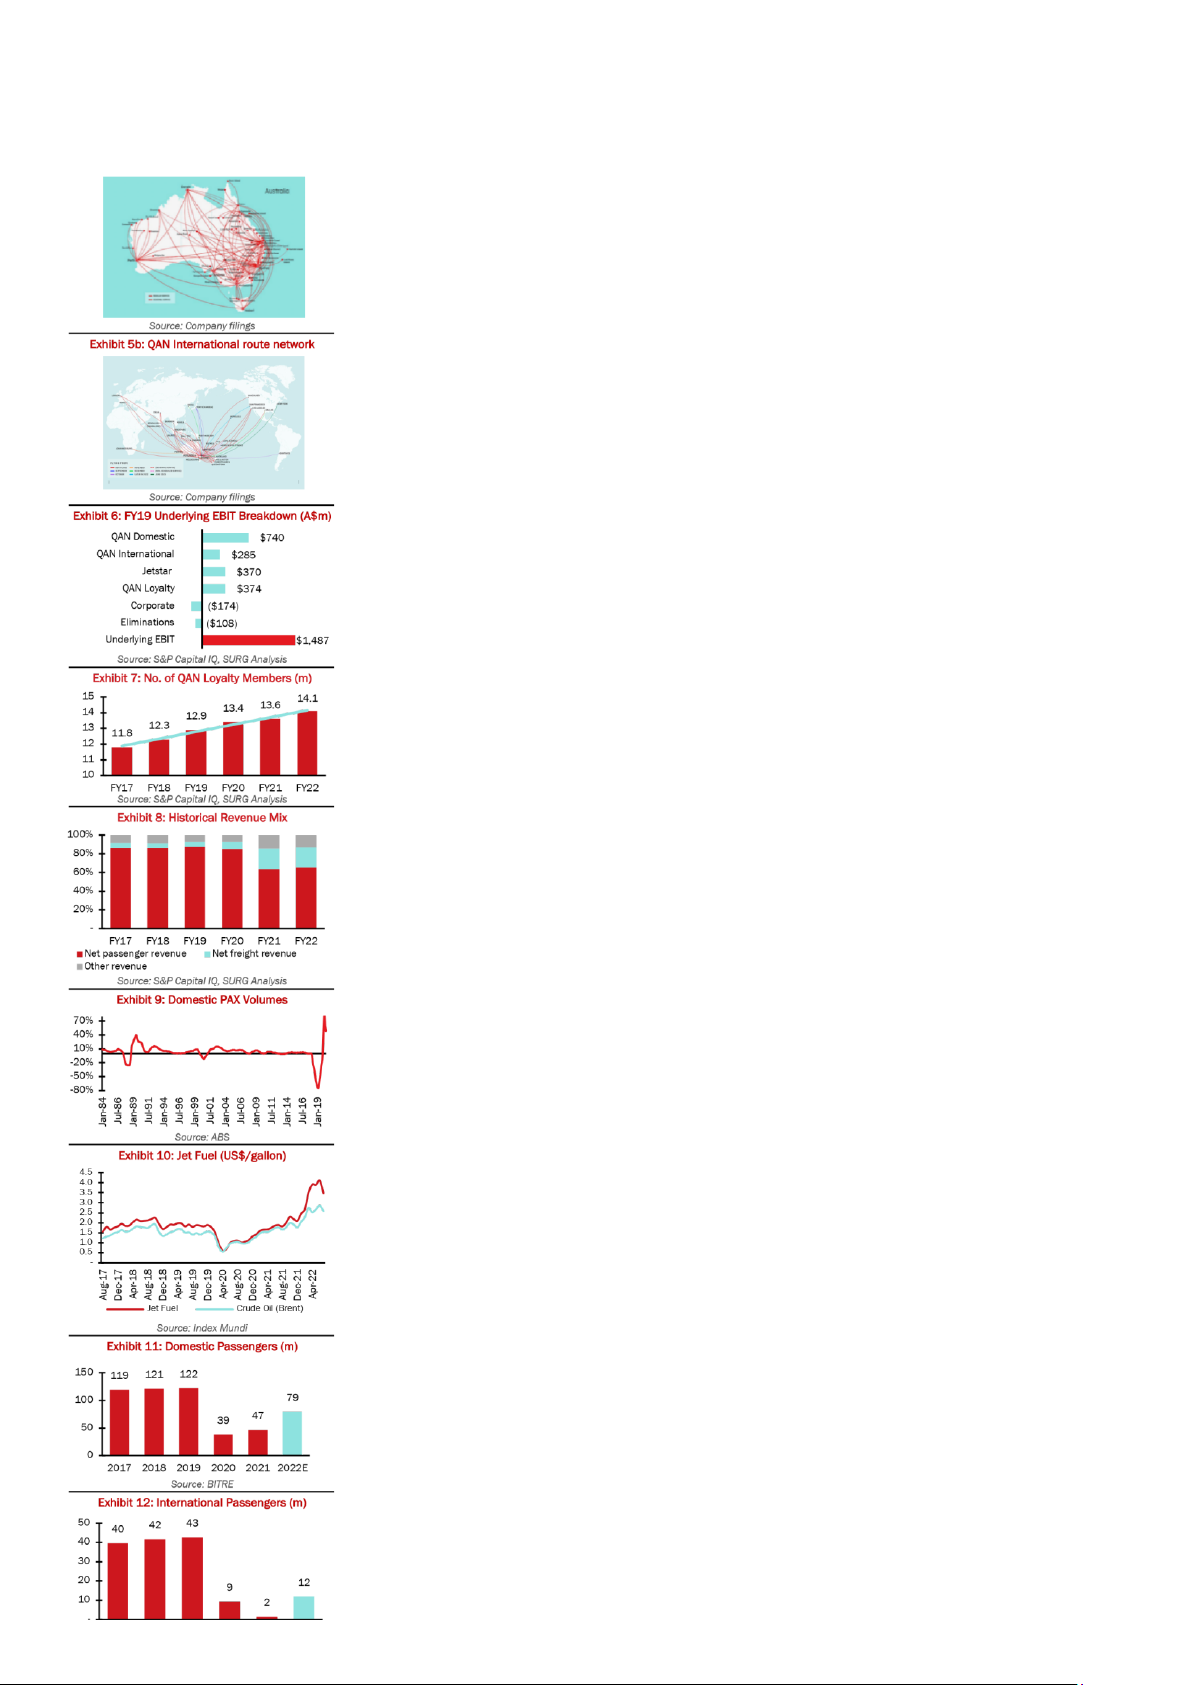
Segments: QAN provides a four-pronged offering to business and leisure customers: premium airline services, a
low-cost carrier (LCC), a world-leading loyalty program and growing freight services. Accordingly, QAN operates
across four segments: its premium QAN Domestic (49.8% of FY19 EBIT) and QAN International flight services
(19.2% of FY19 EBIT); budget airline Jetstar Group (24.9% of FY19 EBIT), and QAN Loyalty (25.2% of FY19 EBIT)
(Exhibit 6). (1) QAN Domestic includes passenger flights between major cities and tourist destinations. Regional
routes are operated via its QantasLink flights, with aircraft availability recently bolstered through QAN’s 2019
acquisition of a 19.9% interest in airline charter Alliance Aviation. Pending approval to acquire the remaining share
of Alliance (A$831m implied enterprise value), this would establish QAN as a quasi-monopoly player in regional
routes. (2) QAN’s International segment covers QAN’s flights outbound to its main North American, Asian and
European markets, as well as core international freight operations through its newly converted passenger fleet.
QAN Domestic and International are both full-service carriers (FSCs) that operate within a hub-and-spoke network,
with offerings including lounge services. (3) Additionally, Jetstar Group offers consistently low-fare domestic and
international routes, while it also includes interests in Jetstar Asia (Singapore) and Jetstar Japan. This low-cost
model works on a point-to-point network with a lower number of outbound planes to maximise utilisation. (4) QAN
Loyalty operates in two capacities for the accumulation and redemption of points: the Frequent Flyer program for
individuals and the Business Rewards program for businesses. Its diverse portfolio consists of more than 600
program partners providing redeemable rewards. The Frequent Flyer program alone boasts a 14.1m member base
(Exhibit 7), with QAN Loyalty accumulating a record high NPS in FY22.
Flight revenue drivers: QAN’s flight revenue is recorded as either net passenger revenue or net freight revenue
(Exhibit 8). Three levers drive the majority of QAN's passenger revenue – (1) capacity, measured by available seat
kilometres (ASKs); (2) load factors, the number of seats which generate revenue; and (3) yield, the return on each
of these revenue-generating seats. Revenue per passenger kilometre (RPK) further measures the number of paying
passengers multiplied by distance flown in kilometres. Further, freight revenue is measured according to available
freight tonne kilometres (AFTKs), the capacity for cargo in tonnes multiplied by kilometres flown.
Loyalty revenue drivers: Loyalty revenue is generated through marketing revenue and redemption margins. (1)
Marketing revenue is generated as the difference between the total cost at which QAN points are sold to partners,
and the fair value of points at the time of their issuance (Appendix 16). QAN also generates (2) Redemption Margin
when the value of points redeemed exceeds the cost that QAN can provide the product or service for.
INDUSTRY OVERVIEW & COMPETITIVE LANDSCAPE
Market Dynamics | Resilience in tough macroeconomic conditions
A rising rate environment threatens consumer balance sheets, however demand for travel remains strong. Qantas
faces macroeconomic headwinds, amidst the Reserve Bank of Australia’s continuing monetary policy tightening
through hawkish cash rate hikes (+50bps monthly through Jun-22 to Sep-22). The cash rate is expected climb
above 3% in mid-2023 in attempts to curb 6.1% inflation (Q2 CY22), leading to recessionary concerns if the central
bank overshoots. Lower consumer confidence (-27% YoY) and a projected softening of discretionary spending could
prima facie result in demand pullback and falling airline yields. However, we note that Australian passenger
volumes have remained relatively resilient in previous economic downturns. In the 1990-91 recession, Domestic
PAX volumes fell 25.6% (rolling 12-month basis) and returned to growth within 14 months (Exhibit 9) whilst
international PAX volumes retained a positive YoY growth. Notably, current conditions are differentiated by 10-year
record low domestic unemployment (3.5%) elevated household savings ratio (8.7%) and strong wage growth (2.4%),
a stark contrast to the 1990s recession characterised by 10.8% unemployment. It is also an unprecedented period
of pent-up demand after COVID-19 disrupted PAX volumes by 75%. Travel remains high priority and more resilient
than other areas of discretionary spending, with an Aug-22 ANZ Bank study showing that 43% of Australians are
still saving money to travel. Hence, we believe that QAN’s aviation activity is somewhat hedged from a slowing
economy, particularly as key SE Asian markets further ease restrictions.
Sustained inflation detrimental to industry operators, but asymmetrically affects smaller competitors: QAN faces
threats of cost-base expansion as surging domestic inflation is forecasted to reach 7.8% by Q4 CY22. Furthermore,
the supply shortage catalysed by the Russian-Ukraine conflict is expected to persist over the short-term, resulting
in elevated fuel prices (Exhibit 10). A significant cost is also the aircraft, which is rising in price from Boeing and
Airbus manufacturers (+20% YoY), while lease costs are up 10%-20% from Apr-20. Higher costs are unfavourable
for all operators, however it is harder for LCCs such as Bonza to pass on costs through fares. Smaller players with
tighter margins do not possess QAN and Jetstar’s scale advantage that reduces the impact of cost uplifts.
Airline Industry Dynamics | Playing to trends for future benefits
Travel demand remains pent-up post-COVID: Pent-up demand will drive QAN’s yields and RASK in the short to
medium term. Demand has picked up significantly as countries emerge from lockdown (Exhibit 11). Jun-22 saw
4.7m domestic passengers, the highest air travel volume since CY19. Global total passenger traffic stands at 74.6% lOMoAR cPSD| 59085392
of 2019 levels (as at Jul-22) and is expected to resume to 100% by mid-late CY23. However, staff shortages in
pilots, cabin crew and baggage handling, as well as COVID sick leave, constrain Australian airlines in meeting the
higher than expected surges in demand. Nonetheless, air fare prices reaching 2-year peaks in Aug-22 with resilient
demand suggests strong price inelasticity and reflects QAN’s ability to successfully pass on costs. Geopolitical
tensions rocking fuel costs: Hedging cannot alone curb all costs arising from a 42% rise in jet fuel prices since
Jan22 as commodity prices surged +140% YTD. Airline unit revenue has a positive relationship with fuel prices (Bouwer
Exhibit 13: Market shares of domestic and quasidomestic markets
Exhibit 18: Historical Scope 1 and 2 Emissions 15 10 5 - FY17 FY18 FY19 FY20 FY21 FY22
CO2-e emissions - Scope 2 (million tonnes of CO2)
CO2-e emissions - Scope 1 (million tonnes of CO2)
Source: Factset, MSCII, Refinitiv, Morningstar
Exhibit 19: Peer Total Scope 1 & 2 CO2 emissions (m) Ethihad Emirates Cathay Pacific American Airlines Singapore Air QAN - 10 20 30 Source: Company filings et al., 2022),
where cost increases must be passed on through airfares (jet fuel constitutes a substantial
25.7% of QAN’s FY22 OPEX). Rather, we have accounted for QAN’s exposure
to top-of-cycle prices from FY23-24 which will likely normalise through FY28 as the supply/demand balance returns and prices accordingly taper.
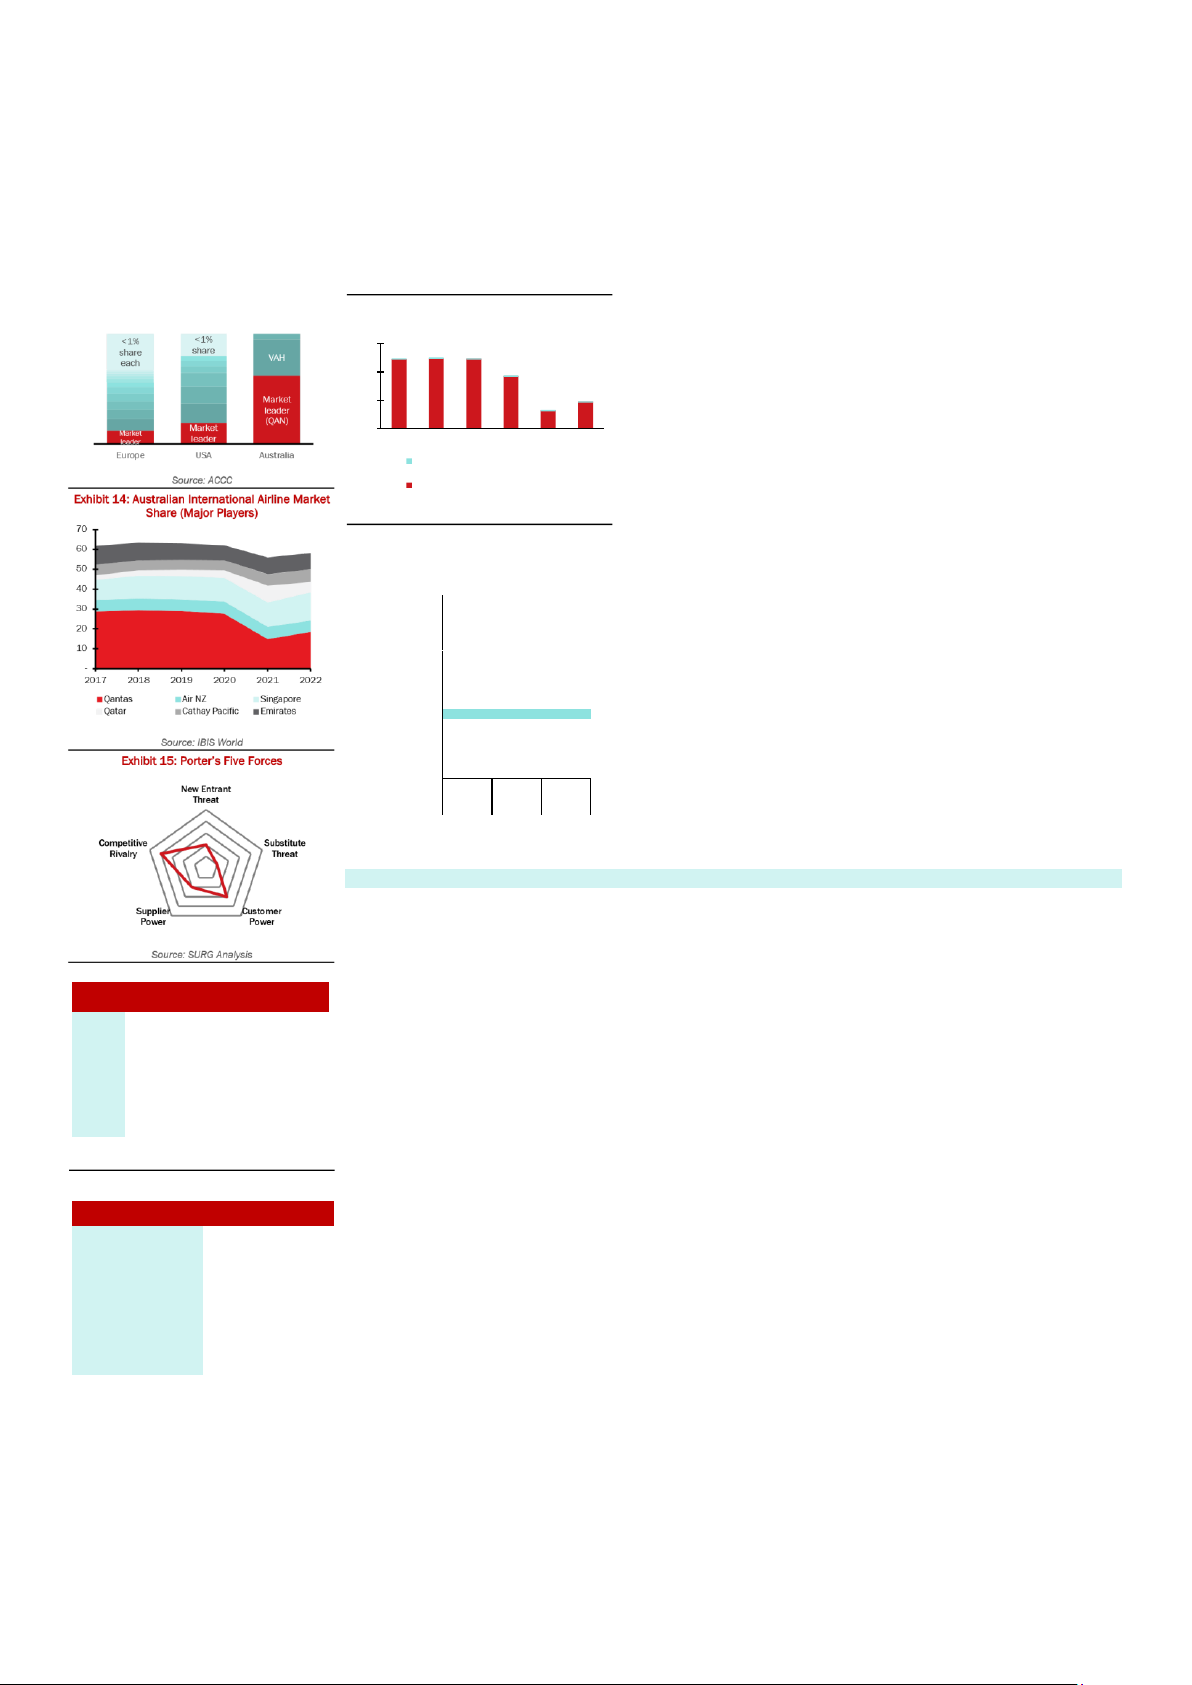
Competitive Positioning | The one-stop shop for all travel needs
Dominance through dual segment targeting: QAN Group is an established industry incumbent with a dominant 62%
market share (QAN Domestic/International 39%, Jetstar 23%) (Exhibit 13) in an oligopolistic market structure,
followed by Virgin with 33% and Rex at 4%. However, QAN has strategically placed itself at two ends of the service
offering spectrum: QAN Domestic/International dominating as a premium FSC, with Jetstar the only LCC before Exhibit 16: ESG Scorecard
Bonza’s entrance. Bain Capital’s purchase of Virgin post-voluntary administration has seen Virgin move to a Avg. Enviro. Social Gov.
domestic middle-market service shifting away from international offerings, providing QAN room to take some of FactSet Avg. 61% 48% 43%
Virgin’s 6.7% international market share. This is furthered by Virgin’s preparation towards an early 2023 IPO,
pivoting towards price rationalism to boost profitability. As such, we forecast QAN’s Domestic segment to grow to MSCII A Average Laggard Leade r
40.6% market share by FY28 from 37% in FY22. Despite Tiger Air’s LCC exit (formerly holding 7% market share),
we conservatively forecast that new entrants Rex and Bonza threaten some of QAN’s routes, reducing Jetstar Refinitiv B+ B+ B A
Domestic’s market share from 28.0% in FY22 to 23.2% in FY28. Morning Medium -star Risk N/A N/A N/A
Well positioned to capture capacity shortage internationally: QAN operates international flights in its 3 international (57.4%)
segments: Qantas International, Jetstar International and Jetstar Asia. The group held a consistent market-leading
international share of 25.3%-25.8% through CY14-19 (vs Singapore Air ~8%, Emirates ~8% & Virgin ~7%). Following
a highly disrupted CY20-21, QAN has retained a 25.1% share of seats across 1H CY22. The capacity of QAN’s
Source: Factset, MSCII, Refinitiv, Morningstar Exhibit 17: STIP Scorecard
international competition is forecasted to be 62% of FY19 throughout FY23. 25% of pre-COVID international carriers STIP Scorecard Category Weighting
have yet to return to Australia (in Jun-22), and the lack of global engineering capacity including delayed deliveries Financial Performance - 50%
of Boeing 787s has caused US airlines to focus on transatlantic as well as domestic routes. With intent to travel UPBT
internationally nonetheless ~60% higher than pre-COVID, QAN International has guided to reinstall 75% of capacity, Customer 20%
taking advantage of a capacity shortage amidst robust demand. Market Leadership 15%
Australia’s unique geographic (dis)advantages: QAN and players in the Australian market have an irreplaceable Workplace and 10%
offering stemming from the absence of an Australian interstate high-rail network. 66% of Australia’s population is Operational Safety
concentrated in its 8 capital cities, and consequently domestic airlines provide high-density routes between 11 Decarbonisation 5%
airports. The unfeasibility of construction plans manifesting in the short-medium term (requiring a 15+ year project Total 100%
timeline) solidifies air travel as the primary means of leisure and business transportation. QAN’s dominance on the
Source: Factset, MSCII, Refinitiv, Morningstar
Australian Golden SYD/BNE/MELB Triangle routes (SYD/MELB being the second busiest flight route in the world)
and connecting East-West capital cities positions it to best capture air travel demand.
A consumer-centric business driving the customer experience: QAN’s Frequent Flyer Program is world-class, with
~35% of Australian credit card transactions and 14.1m members, competing against Virgin’s Velocity program with
10.7m. Its longstanding consumer staples partnership with Everyday Rewards (12.6m members) provides more
scope for customer loyalty than competitor Velocity’s Flybuys partnership (Flybuys having 8.1m members). QAN’s
competitive advantage lies in unique data-driven analytics in creating bespoke customer experiences through its
2015 Taylor Fry data analytics acquisition and the creation of its Red Planet data arm, enhancing customer
behaviour analytics, loyalty design analytics and predictive modelling. lOMoAR cPSD| 59085392 ENVIRONMENTAL, SOCIAL &
indirect supply chain (Scope 3) contributing the remainder. We expect QAN’s market leadership on sustainable GOVERNANCE
aviation fuel (SAF) usage and new fleet renewal projects to materially improve its environmental score (‘B+’
Refinitiv, 61% FactSet – Exhibit 16). QAN’s use of aviation fuel contributes to majority of Scope 1 emissions (~87.6%
of total CO2 emissions during FY17-19). However, QAN now aims to use 10% SAF in overall fuel mix by 2030 and
Increasing social and regulatory focus ~50% by 2050, which can reduce GHG emissions by up to 80%. Transitioning away from traditional kerosene, QAN
on aviation’s environmental impact is the driving force behind Australian SAF use given its (1) sourcing of SAF from London/California (the first domestic and airline product
quality airline to do so); (2) A$50m R&D FY22 investment to establish Australia’s own SAF industry, and (3) market-first
necessitates an examination of QAN’s US$200m co-investment partnership with Airbus announced Jun-22. The market has underappreciated QAN’s
ESG profile. ESG is quantitatively industry-leading transformation: QAN’s share price fell 0.6% on the day of the first announcement, rising only 0.1%
incorporated into QAN’s Financial on the second. In addition, QAN’s fleet renewals in Projects Winton and Sunrise will use 50% SAF, with the new
Framework, weighted 20-30% in its fleet reducing fuel consumption up to 25% and carbon neutrality targeted ‘from day one’. QAN’s market-leading
Short-Term Incentive Plan (STIP) digital competencies to meet climate goals is also underappreciated. QAN is the only domestic airline, and one of
Scorecard and benchmarked against few international airlines, to introduce flight planning and fuel efficiency planning technologies FlightPulse and
the UN Sustainable Development Constellation. This will save $40m in fuel costs and in turn lower carbon emissions. Cumulatively, these initiatives
Goals. Currently, QAN is rated will target an annual YoY increase of 1.5% in fuel efficiency until 2030. For Scope 2 emissions, QAN has committed
‘average’ against industry peers to using 100% renewable energy in place of electricity in on-the-ground buildings (11.2% of CO2 emissions). QAN
(Exhibit 16), notably lagging in social is also responsible for Scope 3 emissions, which comprise its remaining emissions within secondary operations
aspects. QAN’s ESG score has and the supply chain. Exhibit 19 reveals the comparison between QAN’s
improved from its BB MSCI rating
across FY19-21 to A at FY22, where
we have strong belief QAN will improve
shareholder confidence in its brand beyond the balance sheet.
Environmental | A renewed green mindset for the Red Kangaroo
QAN strives to be a market leader in sustainability, with all climate
objectives set out in its 2022 Climate
Action Plan. We see QAN’s efforts to
transform its carbon emissions profile
as a significant priority: QAN’s
alignment with global environmental
standards is weighted 19% during
initial investment screening (MSCI).
Accountability: Our analysis indicates
that QAN will hold itself accountable in
meeting climate-related targets. QAN
is a proactive leader in decarbonising
the global airline industry, as a
founding member of the Oneworld
alliance and co-leading its 2050 carbon neutrality strategy.
Domestically, QAN’s position as the
national flagship airline means it must
align itself with the Sep-22 Climate
Change Bill, mandating net-zero emissions by 2050. QAN’s
accountability is also seen in its
market-first mechanism linking annual
executive bonuses with climate
targets, weighted 5% to its STIP Plan
Scorecard unlike any other peers
(Exhibit 17). This tangibly ensures climate progress, with its
Sustainability Team and a corporate-
first Chief Sustainability Officer
providing checks and measures.
Commitment: QAN has structurally incorporated environmental
considerations across all business
operations. QAN was one of the first
airlines to commit to net-zero by 2050
in 2019 – 2 years before most IATA members. Accordingly, QAN has
implemented Interim Targets for 2030
to reduce net Scope 1, 2 and 3
greenhouse gas (GHG) emissions by 25% from 2019 levels. Core
operations emissions (Scope 1)
contribute to 95% of QAN’s emissions
profile, with electricity (Scope 2) and lOMoAR cPSD| 59085392
Exhibit 20: July 2022 Domestic Peer On-Time Performance
Exhibit 26: Reverse DCF Analysis FY16-19 FY24/25 Average LF Projected LF QAN Dom. 76.8% 76.8% JSTR Dom. 84.9% 84.9% QAN Intl. 83.2% 83.2% JSTR Intl. 84.0% 84.0% JSTR Asia 82.4% 82.4%
Scope 1, 2 and 3 emissions vs competitors as at FY21. Beyond carbon neutrality, QAN has announced a zeroplastic
target across its supply chain by 2027, and zero waste to go to landfill by 2030 – in line with peers.
Influencing green consumer choices: We posit that QAN’s world class Loyalty program of 14.1m members – over
half the size of the Australian population – has unprecedented scope to incentivise uptake of sustainable flight
options. The airline’s successful customer offsetting program ‘Fly Carbon Neutral’ has seen ~10% of passengers
choosing an environmentally friendly alternative. Customers can gain QAN Points by contributing to carbon offset
programs, which works together with QAN Loyalty’s newly introduced Green Tier status. This is unmatched by
domestic competitors, demonstrating QAN’s genuine effort to realign ESG values with its member base.
Social | Connecting the QAN team with its neighbouring communities
A premium product and service? Whilst QAN’s reputation has recently been tarnished by flight delays, lost baggage
and customer service inadequacies, management guidance for the return to 75% on-time performance will catalyse
QAN’s rebirth to a renowned quality airline. QAN has faced extensive media scrutiny for its low on-time arrival and
departure rates, with a Group on-time arrival rate of 53% in Jul-22 (Exhibit 20). However, we note that this is in line
with the Australian domestic (~55%) and American average (~50%). Its FY22 overall on-time rate of 73.9% is only
slightly below its FY19 ‘normal’ average of 79.2% and has recovered from July lows to 71% in Sep-22. Domestic
performance is recovering as staff shortages have lowered across Q1 FY23. Further, QAN has a history of no fatal
crashes (alike its premium player peers) and a 68% brand preference (QAN, 2022) which only improve, as brand
equity is being rebuilt from a record high FY22 NPS score and QAN’s $50 one-off payment to customers as an
apology for its operational shortcomings.
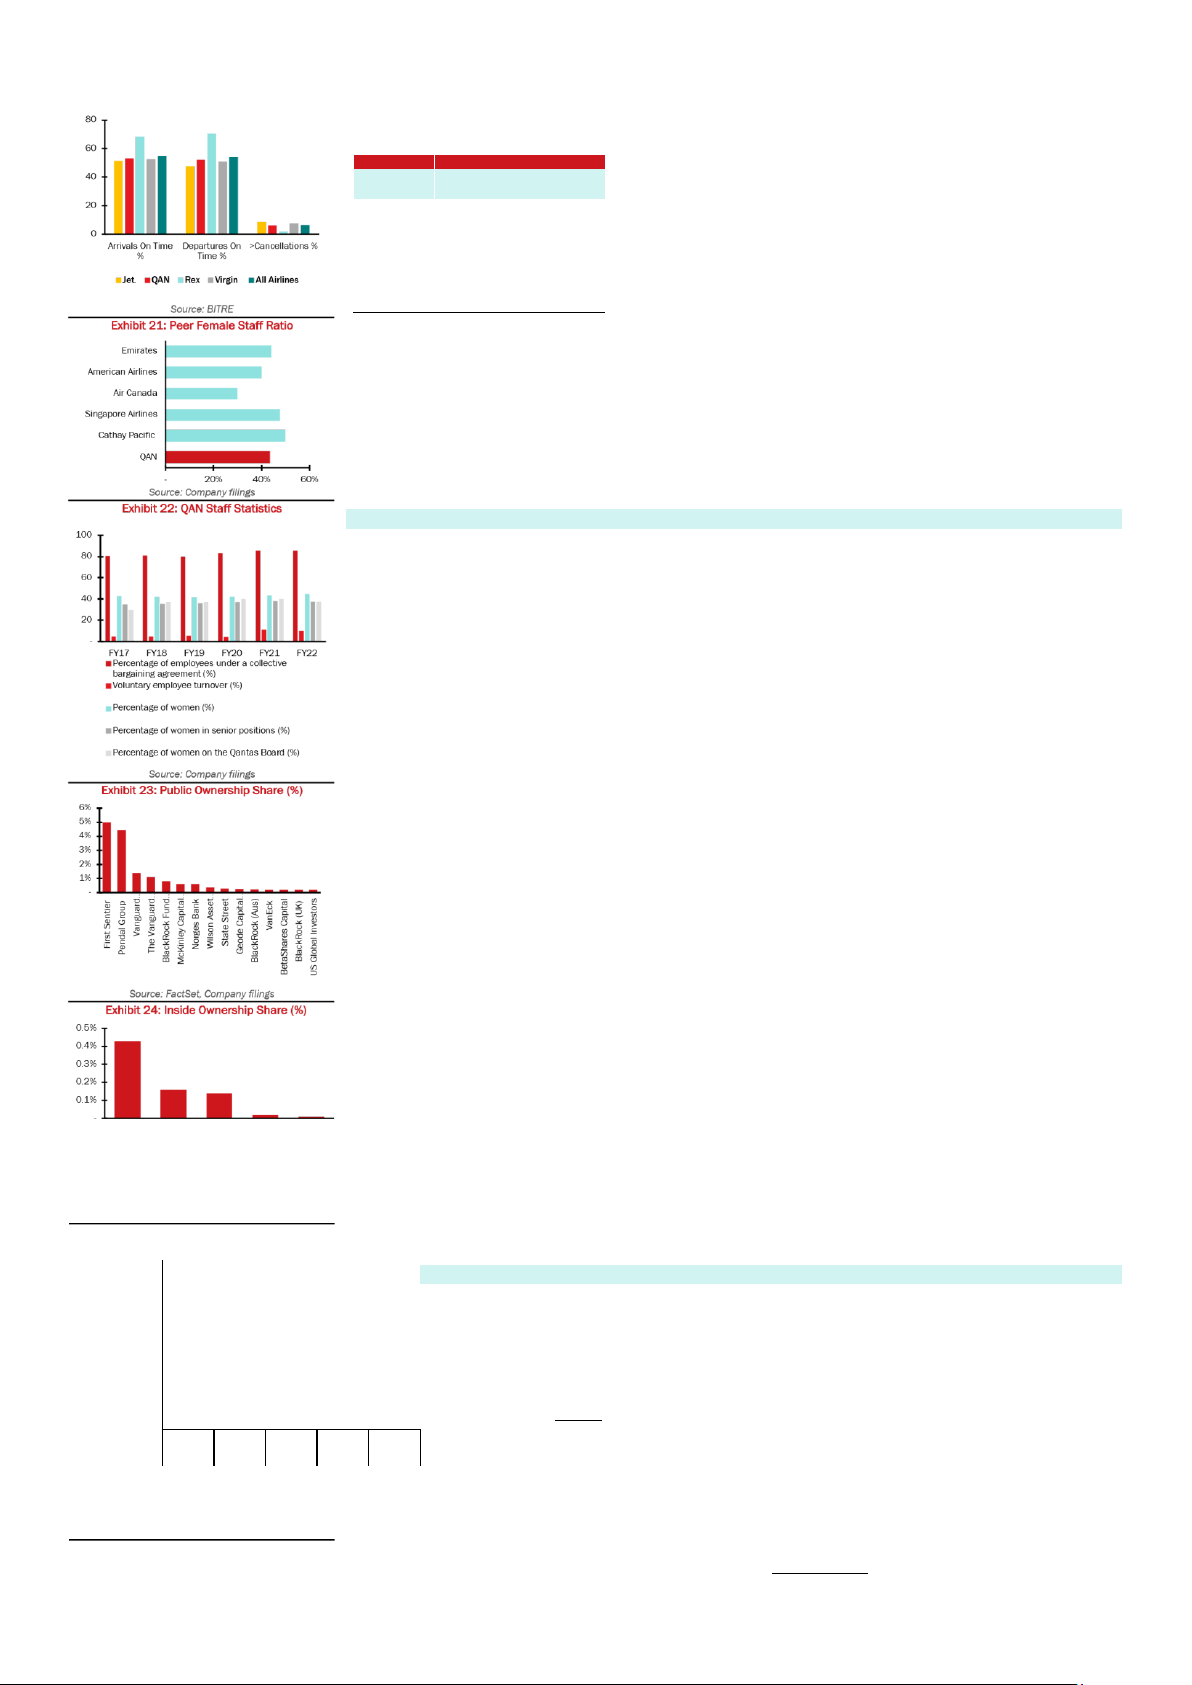
A team as diverse as its international reach: QAN integrates diversity of opinion from various sociocultural
backgrounds. Across FY16-22, QAN has seen a 2.2% increase in women across its workforce, now 44.8% of total
employees and 37.4% of senior positions. QAN has also set targets for senior management to have 42% women
by 2024. Its gender diversity is line with peers (Exhibit 21). QAN surpasses domestic competitors in First Nations
strategies with regular renewal of its Reconciliation Action Plans (RAPs). Whilst Virgin just launched an equivalent
RAP in 2022, QAN has long considered First Nations employment with a target 1.5% Aboriginal and Torres Strait
Islander (ATSI) participation in business units by FY24 (FY22 1.0%), and 49.2% of FY22 community investment
allocated to ATSI initiatives. Inclusion also includes support networks (Illuminate) and partnerships (Sydney Mardi
Gras) for LGBTQ+ employees. QAN holds itself via its Group Head of Inclusion and Diversity.
Labour standards: QAN renewed its Modern Slavery Statement in FY22, reviewing labour standards throughout its
supply chain and upgrading training programs. Safety beyond flights is also highly valued with the Safety, Health,
Environment and Security Committee overseeing accountable risks. Consequently, QAN’s FY22 Total Recordable
Injury Frequency Rate was 12.9% - down from 16.7%/17.0% in FY20/FY21 respectively. Its Lost Work Case
Frequency Rate (6.5%) is in line with the air transport industry average (6.6%).
Employee sentiment at an all-time low: We see well publicised employee dissatisfaction as QAN’s largest source of
ESG risk (46% human capital score on FactSet), with material impact. QAN’s RepTrack ranking fell from the No. 5
most trusted company reputation in FY21 to No 16 in FY22. (1) Industrial action is not new to QAN, where the 2011
industrial disputes led to management grounding the QAN fleet for 48 hours. This caused a $194m loss from the
balance sheet. (2) In Aug-22, QAN’s engineers participated in a 1-minute strike for a 12% wage rise over four years,
rejecting the Group’s current Enterprise Bargaining Agreement offer (2-year wage freeze followed by a 2% annual
wage rise). QAN’s attempted negotiation of a $5,000 bonus has been labelled a ‘bribe’ by the engineers’ union and
has garnered significant negative coverage. (3) QAN also faces a future High Court appeal for the illegal outsourcing
Maxfill Joyce Alan Alan Joyce Rayner Goyder
AustraliaPty Ltd.Joseph Pty Ltd. Paul AshleyRichard J B of ~1,680 ground-handlers. if the appeal is lost, significant court fees, potential compensation and a large penalty
may follow. QAN’s voluntary employee turnover rate of 10.4% in FY22 is significantly worse than the FY18-21 4.9%
average, requiring immediate rectification (albeit slightly decreasing from 11.2% in FY21). Therefore, QAN’s
Source: FactSet, Company filings
reputation as an employer is well-soiled and requires both significant time and effort to recover. However, we
Exhibit 25: CEO Tenure (years) Relative Analysis
believe QAN will again emulate their quick recovery from brand damage in the 2011 industrial strikes, where its
2011 73rd Global RepTrack ranking increased by ten places within one year. Average
Governance | A well-versed management team leading Australia’s trusted and loved airline Singapore Airlines
QAN’s management team have provided prudent stewardship through the challenges of COVID and will Air Canada
continue to do so, although succession risk could manifest. American Airlines
Executive Remuneration: QAN’s director rights are held under successive Long Term Incentive Plans QAN
(LTIP), the most recent 2021-23 LTIP aiming to maximise Total Shareholder Returns to be within the ‘top
quartile of the ASX100’. This solidifies QAN’s position as an ESG market leader in corporate governance (MSCI).
Board of Directors: Tenure: Alan Joyce has remained at the helm of QAN as CEO for the past 14 years,
above the average airline chief executive tenure of 6.7 years. Whilst QAN has a pool of divisional
executives willing and able to assume his role, there is some uncertainty surrounding the succession 0 5 10 15 20 25
plan which could affect the Group’s governance rating. For instance, Andrew Pike (CEO of QAN
Domestic/International) is no longer in the running due to his role in the ground-handling outsourcing decision,
Source: Company filings
whilst Group Chief Customer Officer Stephanie will replace Jetstar CEO Gareth Evans at the end of CY23 upon
completion of the A320neo fleet renewal and Jetstar Asia/Japan ramp-up. All existing Board members have a 4-9
year tenure range (avg. 5.3 years) and thus guided QAN’s COVID challenges, with this consistency indicative of a
strong management board ready to take QAN to new heights. Independence: All Board directors are independent lOMoAR cPSD| 59085392
non-executives to act in the best
interests of shareholders. Gender
Diversity: 37.5% of the FY22 Board are
women, down from 40% in FY20-21.
Public and Inside Ownership: Public
ownership of QAN is outlined in Exhibit
23. Material inside ownership by QAN
Board and management is outlined in
Exhibit 24, positively aligning the
interests of shareholders with agents
of the business. Our confidence in the
QAN team is further affirmed share
purchases by non-executive director
Mark L’Estrange in June 2022– an
increase of 15.3% of his individual
ownership. QAN’s $400m buyback in FY22 also provides a positive
asymmetric signal of management’s
conviction in QAN’s outlook. INVESTMENT SUMMARY Thesis 1 | QAN’s demand
environment to provide earnings upthrust We believe the market has not
accurately assessed QAN’s forward
passenger demand profile. It is the
team’s view that the market has
mispriced (1) QAN’s comparatively stronger domestic recovery vs
European and US peers; (2) the
resilience of QAN’s demand to
transitory operational challenges and
(3) the step-down of QAN load factors
following an FY23 release of pent-up demand.
1.1 Stronger domestic arena recovery:
We believe the comparative strength
of Australia’s domestic recovery, on
both a volume and price basis, has
been underappreciated by the market. QAN stands to be the primary beneficiary of these domestic
Source: Company filings, SURG Analysis
tailwinds, owing to uniquely dominant
Exhibit 31: QAN vs VAH vs REX EBITDA Margins
market positioning. QAN’s domestic
market has recovered flight volumes
(96.9% of PC in Jun-22) more strongly
and rapidly than similar intra-Europe (84.9% of PC) and VWAP implied LF Difference from min. historical LF QAN Dom. 70.7% (4.6%) JSTR Dom. 78.8% (4.4%) QAN Intl. 77.1% (3.9%) JSTR Intl. 77.9% (2.3%) JSTR Asia 76.2% (4.5%) FY24/25 FY24/25
domestic USA (85.7% of PC), as analysed in Appendix 21. Guided by adjacent indicators, we expect this recovery 18% 16% 14% 12% 10% 8% 6% 4% 2% 0% lOMoAR cPSD| 59085392 FY15 FY16 FY17 FY18
FY19 issues. QAN’s operational challenges have been excruciatingly well-covered on slower news days at the Australian
Financial Review (AFR), where it boasted 13x the coverage of Virgin throughout Sep-22. We believe the market VAH QAN REX
outlook has overestimated the impact on demand of QAN’s well-publicised challenges (baggage handling, on-time
Source: S&P Capital IQ, SURG A nalysis
performance (OTP) and flight cancellations). Illustrated in Exhibit 28, QAN’s OTP has trended in line with key
Exhibit 3 2 : Projected Load Factor Spread
competitor Virgin (95.2% correlation) and all flights across Europe (93.4% correlation). QAN’s most recent data
shows a strong trend back to pre-COVID levels: OTP has increased to 71% in Sep-22 (vs pre-COVID 80%), further
seen in Exhibit 28. Our valuation expects a one-off cost-in of A$240m in FY23 ($150m in employee pay, $35m in 100 % 45 % 90 % 40 %
operational disruption, $65m COVID-related), indicative of QAN's efforts to resolve these operational issues. RPKs 80 % 35 %
have proved robust in spite of operational challenges, increasing from 63.2% to 96.9% of CY19 levels across Q4 70 % 30 % % 60
FY22. While demand has remained robust, QAN’s trading price has not. Following the onset of widely covered % 25 50 %
operational and customer support challenges in June, QAN’s 1-month VWAP fell from $5.80 to $4.54 and has yet 20 % 40 % % 15
to fully recover. We posit this lagged share price response as a key indication of market mispricing. % 30 % 10 % 20
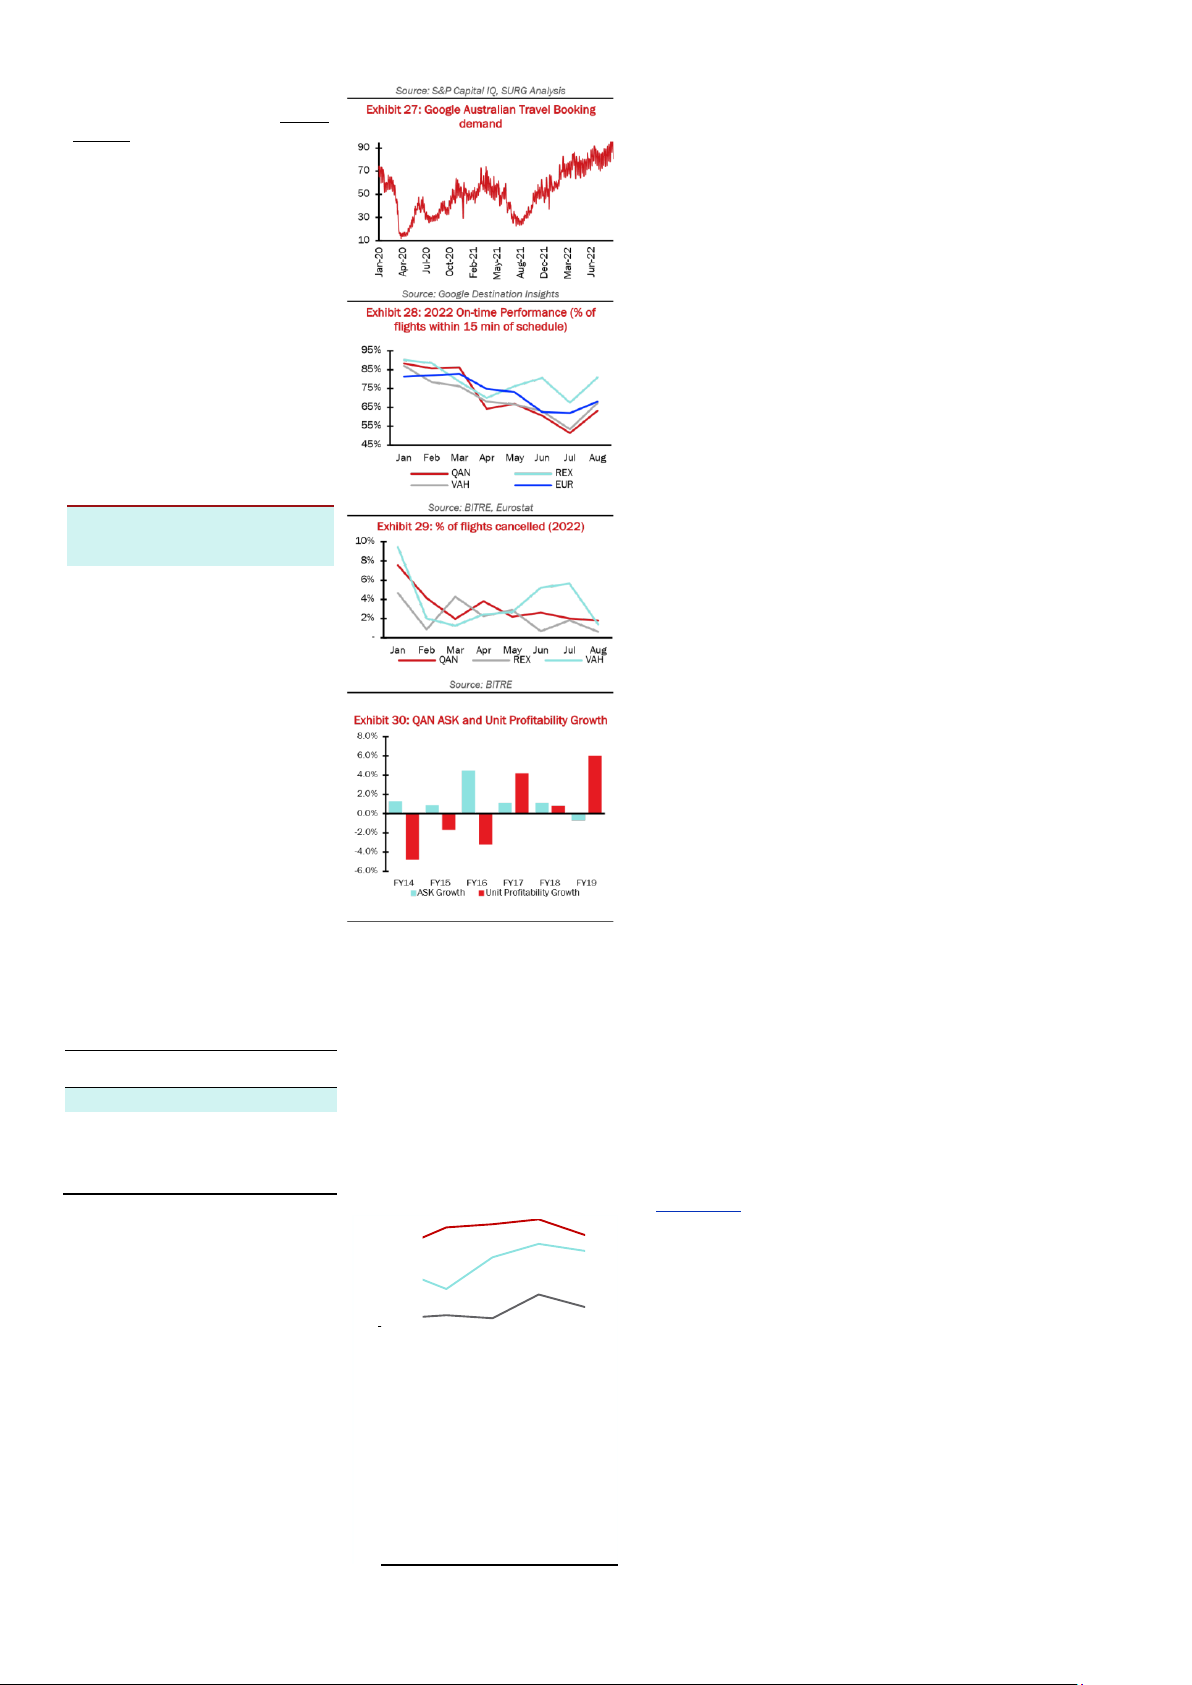
1.3 Market mispricing demand drawdown: While we anticipate a significant pull-forward of demand (FY23 divisional 10 % 5 %
load factor +5% vs corresponding FY16-19 maximum LF), we believe the market has overstated the magnitude of - - FY19 FY23
subsequent drawdown of passenger volumes following an FY23 release of pent-up demand. (1) Results from
Google’s Destination Insights platform measuring travel booking interest, a core leading indicator of travel demand, BELF LF Spread
are illustrated in Exhibit 27. Flight booking trends, with long lead times (2-3 months domestically and 6-7 months
internationally), have continued to trend upwards, supporting sustained interest in air travel. (2) Tourism Australia
Source: S&P Capital IQ, SURG Analysis
expects sustained uplift in domestic tourist nights in FY24 (+5.7% vs FY19) and FY25 (+4.3% vs FY19). (3) Finally,
a reverse DCF analysis was conducted to quantify current market expectations of demand pull-through (Exhibit 26).
to sustain: Tourism Australia forecasts
The current 1-month VWAP implied a group wide load factor drawdown in FY24/25 of 6.2% from current projections,
FY23 domestic overnight trips as
notably 2.3%-4.6% below the minimum historic load factor. We believe the market is overstating the demand
108% of pre-COVID levels. In addition
moderation that QAN faces, reinforced by supportive leading indicators.
to volumes, QAN’s domestic market, in
which they have a 65% share, has Thesis 2 | QAN possesses the earnings power to beat consensus unit profitability
seen the strongest recovery in price - QAN has emerged from the pandemic a fundamentally more agile, cost-efficient airline, operating within a
airfares have restored more quickly in
disciplined industry that allows it to prioritise profitability. Our FY24e EBIT margin is 42bps above consensus,
Australia (92.1% of pre-COVID by 3Q
reflecting our view that the market is underappreciating post-COVID unit profitability strength. Earnings power will
FY22), than in the US (83.4% of
be driven by (1) greater flexibility to adjust capacity due to rational competitors and a lower proportion of fixed costs
preCOVID by 3Q FY22) and Europe
(2) a meaningfully reduced cost base with an underappreciated focus on offsetting inflation and (3) medium-term
(52% of pre-COVID by 3Q FY22 for UK
unit profitability benefits from Project Winton.
– European flights). Upwards price 2.1. QAN has more operational flexibility than ever to adjust capacity and recoup higher fuel prices. Bain Capital
and volume pressure, a product of
owned Virgin will not be pursuing a ‘win at all costs’ market share strategy as its intentions to IPO necessitates a
strong demand and dominant market
track record of profits. Particularly as its publicly stated target market share of 33% was reached in Jul-22, irrational
positioning, contributes to uplifted
capacity expansions prior to listing are unlikely. This points to a disciplined industry with limited overcapacity driving
FY23 RASKs (+18.4%) and FY23/24
down yields, allowing QAN to focus on recovering costs. Furthermore, QAN has variabilised its cost base, heading
load factors (+5%) vs FY19. In addition
into a 40%+ variability vs 30% pre-COVID. Lower fixed costs alleviate pressure to spread expenses by increasing
to stronger demand recovery, QAN is
capacity. With capacity discipline positively correlated to unit profitability (Exhibit 30), we expect FY23 RASK growth
benefited by a concentrated industry
(+18.4% Group vs FY19) to adequately recover elevated fuel costs (+15.8% uplift in Group RASK needed), and position (Exhibit 13) and
investors to mimic Wall Street’s current love for capacity discipline (Forbes, 2022). QAN’s operational flexibility to
comparatively low LCC penetration
weather a high-fuel cost environment materialises in forecasted FY23/FY24 EBIT margins +60bps/+42bps above
(effects of which are discussed in
FY23/24 consensus. There is further upside as our forecasts remain below FY24 Management EBIT margin targets
Competitive Positioning). A relative
(18% QAN Dom; 22% Jetstar Dom), with FY23 results expected to add confidence to QAN earnings potential.
valuation analysis was conducted, 2.2. QAN’s dual focus on cost restructuring and inflation offsetting ensures its Recovery Plan will translate to comparing the relative trading
sustainable earnings uplift. QAN has completed >90% of its Recovery Plan initiatives, making it well-placed to
multiples of QAN with European, North
deliver the targeted A$1b annualised cost benefits by FY23. The Transformation playbook is tried and tested, with
American and APAC peer sets, shown
QAN notably surpassing its FY14-17 A$2b cost-reduction plan, and exceeding minimum pre-COVID annual targets
in Appendix 9. QAN is currently trading
of A$400m to offset inflation. The market is pricing in ~A$285m of cost inflation such that A$715m of Restructuring
greater than 2 standard deviations
Plan benefits fall to bottom line, which we think is overlooking QAN’s parallel BAU cost saving initiatives to offset
below its FY15-19 average premium or
inflation. Whilst we acknowledge the higher cost environment and remain conservative in our valuation by
discount to each geographic peer set.
forecasting A$172m of structural cost benefit to be eroded, QAN can partially offset FY23e inflation of A$200m
The mismatch of QAN’s concentrated
after having successfully renegotiated the cost of A380 engines and through cost-saving initiatives such as digitally
industry position, comparatively low
delivering newspapers. QAN’s economies of scale vs domestic peers have historically given rise to margin benefits LCC penetration and stronger
(Exhibit 31), and we think it will continue to be an outsized beneficiary of returning capacity. Our FY23e CASK (ex- passenger volume recovery,
fuel) of A$7.80c is 3.2% below consensus. On lower CASKs (-9.9% vs FY20), break-even load factor (BELF) has
compared to current trading relative to
reduced from 51.6% in FY20 to 47.7% in FY23. A 100bps reduction in BELF lifts share price by +12cps, while the
other geographies, suggests QAN’s
spread between BELF and realised load factor is 28.2% higher in FY23 vs FY19 (Exhibit 32). This cements our demand environment is
conviction of QAN’s stronger earnings power post-COVID due to structural cost savings, with an A$1.43c increase
underappreciated by the market.
in FY23 RASK/CASK (ex-fuel) differentials vs FY19 translating into a 4.5% EBIT margin uplift.
1.2 The Joe Aston effect: The market 2.3 Project Winton will provide medium term unit profitability upsides. Whilst market commentators have cast doubt
has priced QAN as if demand has not
on QAN’s significant CAPEX profile, we believe that QAN possesses sufficient balance sheet strength to invest
been resilient to transitory operational lOMoAR cPSD| 59085392
Thesis 3 | QAN’s multiple quality revenue streams reduce cash flow risk lOMoAR cPSD| 59085392
Profitability | QAN exits challenging periods with enhanced earnings power lOMoAR cPSD| 59085392
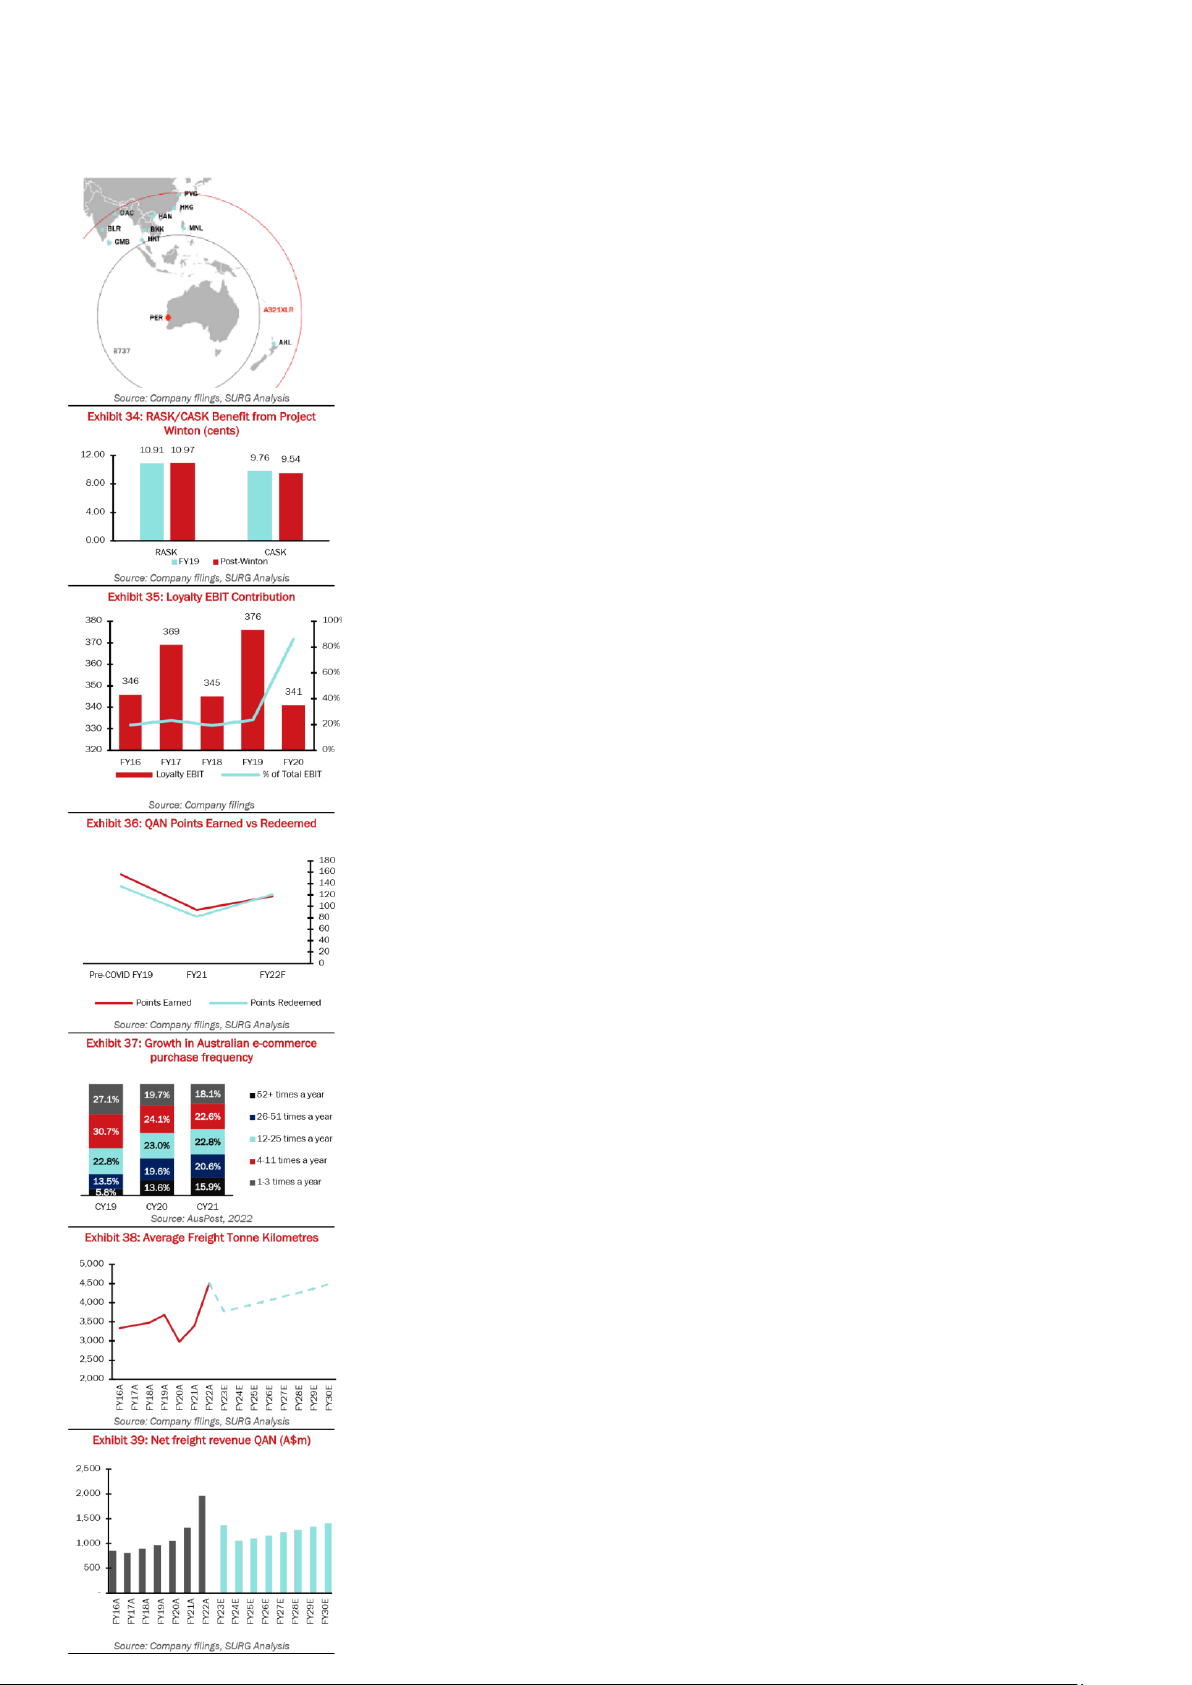
Exhibit 33: A321XLR APAC Range in its domestic fleet renewal Project Winton: a margin-accretive investment that enhances post-COVID profitability. Whilst lOMoAR cPSD| 59085392
United Airlines, Delta Airlines and American Airlines have a comparable average fleet age of 15 years (vs QAN 14.7
years), they have significantly less net debt to EBITDA covenant headroom than QAN (FY23e 4.0x/2.8x vs QAN
1.5x). We view A$400m buyback as further signalling management confidence, with QAN emerging from COVID-19
with above-peer financial strength to revolutionise unit metrics with new narrowbodies. The A321XLR and A220-
300’s greater seat capacity (+15% vs B737-800 and +25% vs B717s respectively) means QAN can lower unit
maintenance and airport costs whilst maximising the usage of Sydney airport peak slots. The new models bring
underappreciated route optionality. QAN can entrench its competitive advantage over Virgin as A321XLRs has a
2,400km greater range than Virgin’s new B737 MAX, critical for today’s demand for direct flights. New ‘thin’ routes
including Sydney-Siem Reap or Perth-Dhaka can be captured (Exhibit 33) where there is insufficient demand for a
widebody. QAN can also increase aircraft utilisation, for instance flying domestically during the day and adding a
‘back-of the-clock’ night flight to South-East Asia and Bali to reach 15 utilisation hours vs 10 hours on existing
B737s. Operational costs are further expected to be reduced by fuel efficiencies (A220-300 -28%; A321 -17% fuel
burn per seat). With new aircrafts to deliver a 13% CASK benefit/3% RASK benefit and assuming 17% of capacity
replaced (Exhibit 34), Project Winton will allow QAN Group to realise a 6.9% EBITDA margin uplift vs FY19.
QAN has crafted a resilient portfolio of diverse revenue streams which provides positive cash-generative earnings to offset underperforming segments,
with a combination of Loyalty attributing 14.6% and Freight 21.6% of FY22 revenue. This is characterised by (1) an underappreciated customer flywheel
expanding its competitive moat; (2) increased capacity to accommodate for a permanent Australian e-commerce shift; and (3) elevated air freight
yields from import/export activity bolstered by QAN’s prime freight routes and terminal infrastructure. This has allowed QAN’s 5Y beta of 1.36 to sit
well below the global aviation industry average beta of 1.58. Pro forma cash flow risk is viewed to be further reduced as its Loyalty and Freight revenue
composition solidifies through FY23-28.
3.1 QAN’s world-class Loyalty program has a distinct competitive moat fuelled by an ‘earn’ and ‘burn’ flywheel, curating customer stickiness via a
600+ partner network. The business’ diversification benefits were exemplified through the pandemic, bringing in three consecutive years of AU$1b+
gross cash revenue. Loyalty remains the only segment with positive Underlying EBIT in FY22. The flywheel operates by increasing switching costs,
providing unmatched brand ecosystem engagement and driving QAN’s marketing revenue from Points Earned and a greater redemption margin from
more Points Redeemed (‘Points Burnt’). Notably, QAN uses its attractive offerings to induce members to Burn as many Points as they Earn, where
strong convergence between Points Earnt/Burnt reflects QAN’s unrivalled customer participation and retention whilst not posing any working capital
headwinds. QAN’s focus on improving non-flight point redemption has resulted in strong FY22 alignment between 118m Points Earned and 121m
Points Burnt. We forecast customers will continue to engage in a self-sustaining earn and burn cycle, fuelled by underappreciated uptake of QAN’s
new TripADeal offering – exemplified via a -2.2% QAN share price fall on the announcement of the earnings-accretive acquisition (24-May-22), despite
it catalysing ~50% YoY run-rate growth of the QAN Holidays brand. QAN’s competitive moat will be continually expanded through its Tier Accelerator
program, allowing premium point tier members from competitor airlines to be fast-tracked into the ‘sweet spot’ Gold Status upon request, hence
increasing Loyalty market share. Whilst our forecasted loyalty CAGR is conservatively below guidance across FY18-24 period (5.4% vs 7%-10%
guidance), we see the flywheel accelerating at a 7.6% CAGR through FY23-30 due to increased customer stickiness. We pre-empt that QAN Loyalty
will expand its member base to 14.7m members by FY24 ahead of QAN’s 14.3m target, to reach 15.9m by FY28.
3.2 QAN has increased freight capacity to accommodate a domestic structural retail e-commerce shift. The market has underappreciated QAN’s
strategic positioning for a second e-commerce wave which we forecast will grow available freight kilometres by a 2.5% CAGR through FY24-30,
increasing market share from its leading 16.4% as of FY22. QAN is positioned at the forefront of Australian e-commerce as the only airline/freighter
service with domestic parcels contract with Australia Post (A$1.4b value)/Toll Group (won from Virgin in 2015) and an exclusive aircraft arrangement
with Amazon. Australia’s e-commerce penetration lags international peers in online spend volumes (19.3% of FY21 retail spend) and online shopping
frequency (25% of Australians online shop weekly vs Korea/US at ~45% average). The COVID-accelerated 39% increase in Australian uptake of online
shopping from FY19-FY22 is a bellwether for future growth as QAN continues market dominance. With Australia Post’s 75% market share in B2C
parcel delivery services and Amazon forecasted to reach 20% of all Australian online sales by CY26, QAN is well-placed to capture the expected
doubling of online spend by FY27. QAN has also prepared its fleet, adding 3 A321PNF aircrafts (FY22) and 6 A321 freighters (+9 tonnes vs current
B747-8Fs) in FY24. Despite QAN’s share price rising 0.9% upon the 6 freighters’ announcement, this was due to broader market movements (+0.46%
ASX-200). Whilst FY22 expiry of $300m government freight assistance will reduce FY23 AFTKs by 16.2%, QAN will
reach 20.1% domestic freight market share by FY28 at 1.3x FY16 AFTK levels (Exhibit 38).
3.3 QAN will sustain post-pandemic freight revenue uplifts through valuable freight routes capturing Australian trade
and its optimal terminal infrastructure which captures time-sensitive freight movements. Alongside 50+ international
cargo destinations serviced by passenger flight belly space, dedicated 747-freighter flights create a high-value chain
between the ANZ/SE Asia/North America (Appendix 24), forming its own hub-and-spoke network. Daily routes
predominantly to Chinese business hubs and USA capitalise on Australia’s strong agricultural export destinations
(~25% of 2021 exports to China, ~28.5% to USA). With Western Sydney Airport forecasted to handle ~220,000
tonnes of freight annually, QAN’s freight capacity will likely accelerate in the medium-term. QAN’s ability to align itself
with international trade flows will be further consolidated by longer-term importer/exporter preference for air freight
over sea freight. Elevated sea freight rates will persist through FY23 (+117% Australian container shipping costs
across FY20-22), but this will likely normalise by FY24. However, air freight will have increased uptake compared with
pre-COVID levels where weaker sea freight reliability (port delays and congestions) and faster air freight times (-5
weeks) meet a consumer next-day delivery mindset and pent-up import/export surges as supply chain constraints
ease. As such, QAN’s optimal terminal infrastructure is primed to adapt to an industry-wide renewed focus on
import/export timeliness and urgency. We forecast 5.1% CAGR in QAN’s freight revenue across FY24-28 (Exhibit 39)
as Australia returns to pre-COVID levels of 82% of exports carried through air freight. FINANCIAL ANALYSIS
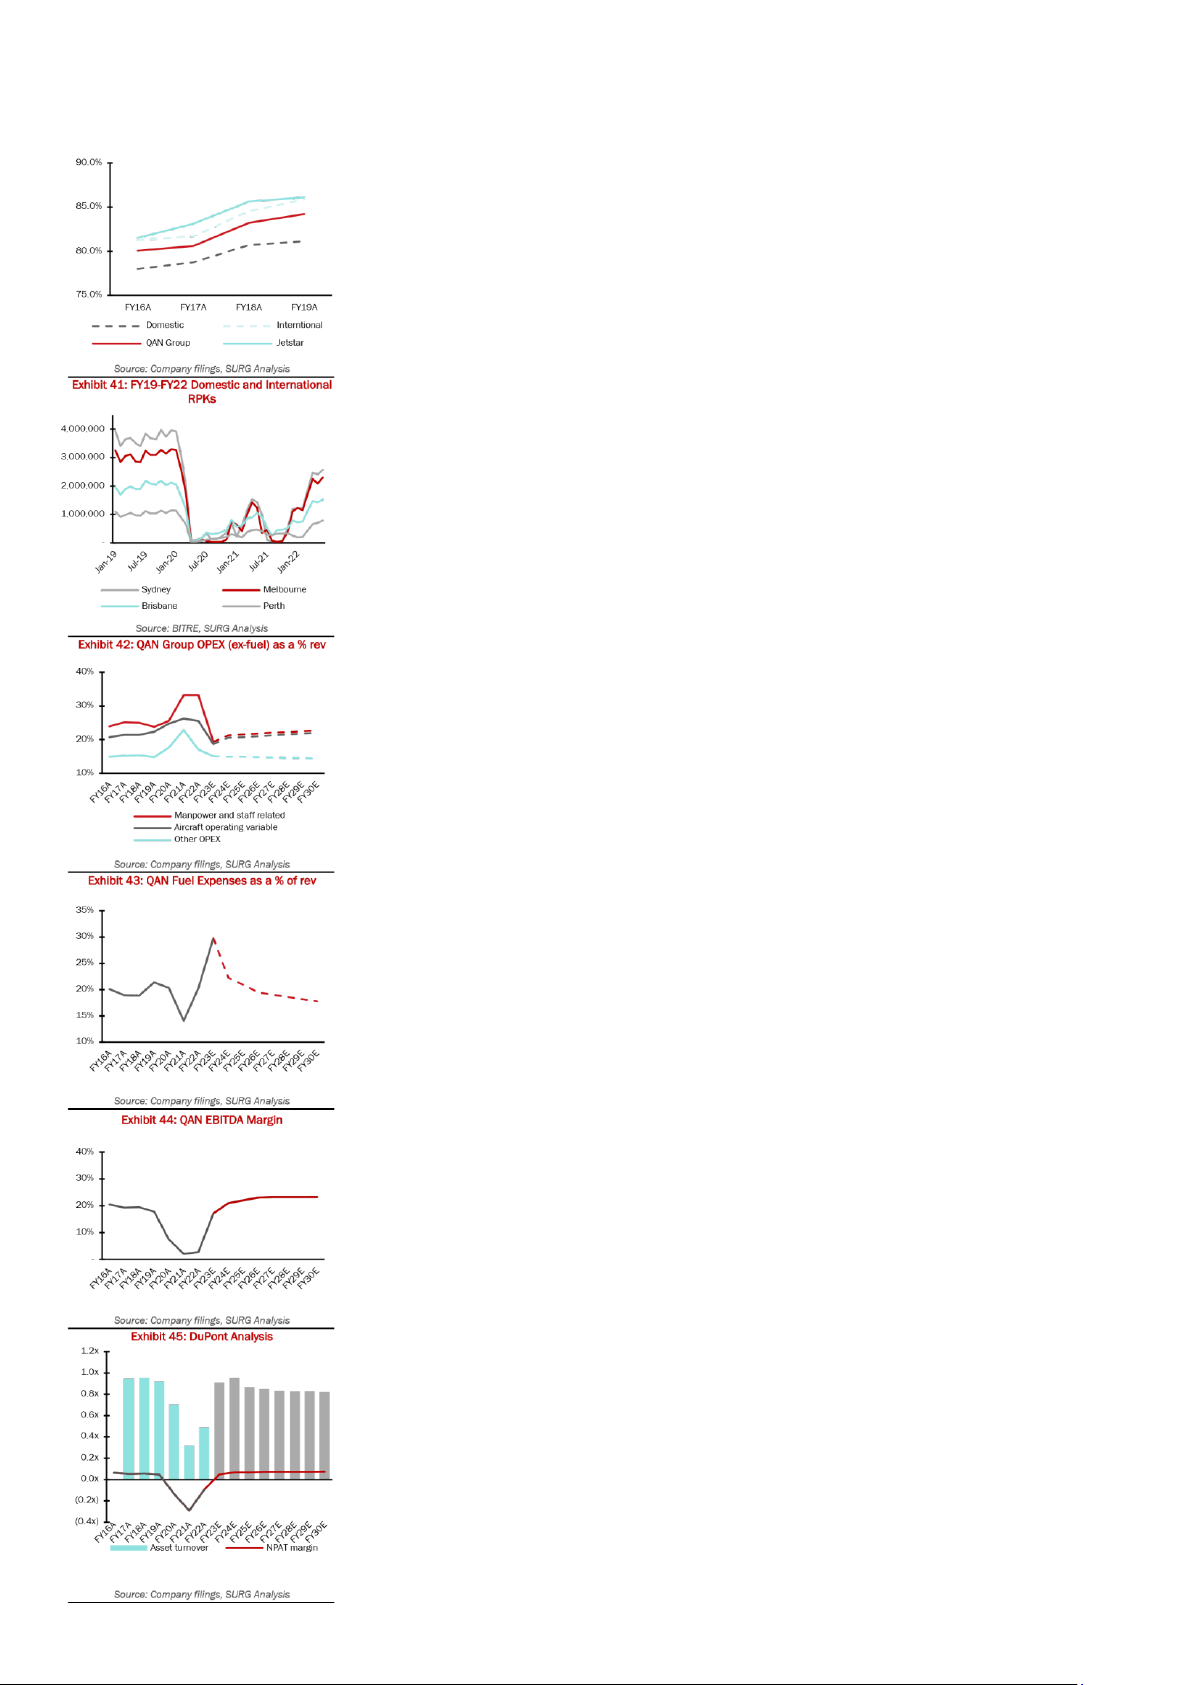
Flying revenue RASKs: QAN’s pre-pandemic passenger revenue 3Y CAGR of 3.6% (FY16-FY19) was underpinned by (1) domestic and international load
factors rising from 78.0% to 81.1% and 81.3% to 85.8% (Exhibit 40), respectively, stimulated by a then record-low 1.5% cash rate and buoyant
household wealth; (2) modest domestic capacity discipline with a compressed Australian market leading to a 3Y ASK CAGR of -0.6%; and (3) robust Exhibit 40: FY16-FY19 Load Factors lOMoAR cPSD| 59085392 lOMoAR cPSD| 59085392
including cost reductions of A$600m and A$900m realised in FY21 and FY22 which demonstrate a significant
rationalisation of their cost base. These cost outs were comprised of manpower (59%), sales and marketing (10%), domestic 3Y CAGR yield
aircraft operating variable OPEX (6%) and other overheads (26%). On a relative basis, QAN’s cumbersome cost base growth of 3.4%. COVID
has seen them historically lag unit profitability of international peers, with QAN’s FY12-FY19 average of 15.5c a 9.6% halted flying operations with
discount to a weighted European peer set (17.4c), 8.5% discount to US peers and 2.6% discount to APAC peers (16.0c). international revenue falling
Unit profitability (spreads between RASK and CASK) preservation into steady state is underpinned by (1) a rationalised by -94.4% and domestic
fixed cost base, down A$828m relative to FY19; (2) underpriced operating leverage recognised in 50bps and 80bps falling -42.9% in FY21
above consensus EBITDA margins in FY25 and FY26 driven by RASK and CASK (ex. fuel) differentials expanding by (Exhibit 41). We project
160bps in FY24 (Exhibit 42); and (3) steady state CASK savings of 23% derived from project Winton fleet renewal (See FY23-FY24 ASKs as a
Thesis 2). Whilst the benefits of the cost reduction program largely hold, we assume some of this is lost to inflation percentage of FY19
(2.5% p.a.). QAN will also incur A$300m in one-off reopening and COVID related costs in FY23 ($150m in employee pay, (normalised flying market
$35m in operational disruption, $65m COVID-related, $60m in fleet start up), which is forecasted to be 5.1% ROE benchmark) in line with IATA
accretive as it tapers off entirely into FY25. FY23 and FY24 working capital headwinds of A$1.2b of COVID credits are data on air passenger
on the balance sheet (15.1% of total revenue received in advance (RRIA)). This is mitigated by FY23 operating cash number predictions. We
flows exceeding RRIA by 67.5% and an A$80m management guided credit burn run rate driving credits to A$240m in forecast FY23 and FY24
FY23 and 0 by FY24. A rationalised cost base positions QAN to reach a steady state NPAT margin of 8.0%, 350bps domestic capacity at above FY16-FY19 averages. 100.7% (QAN:
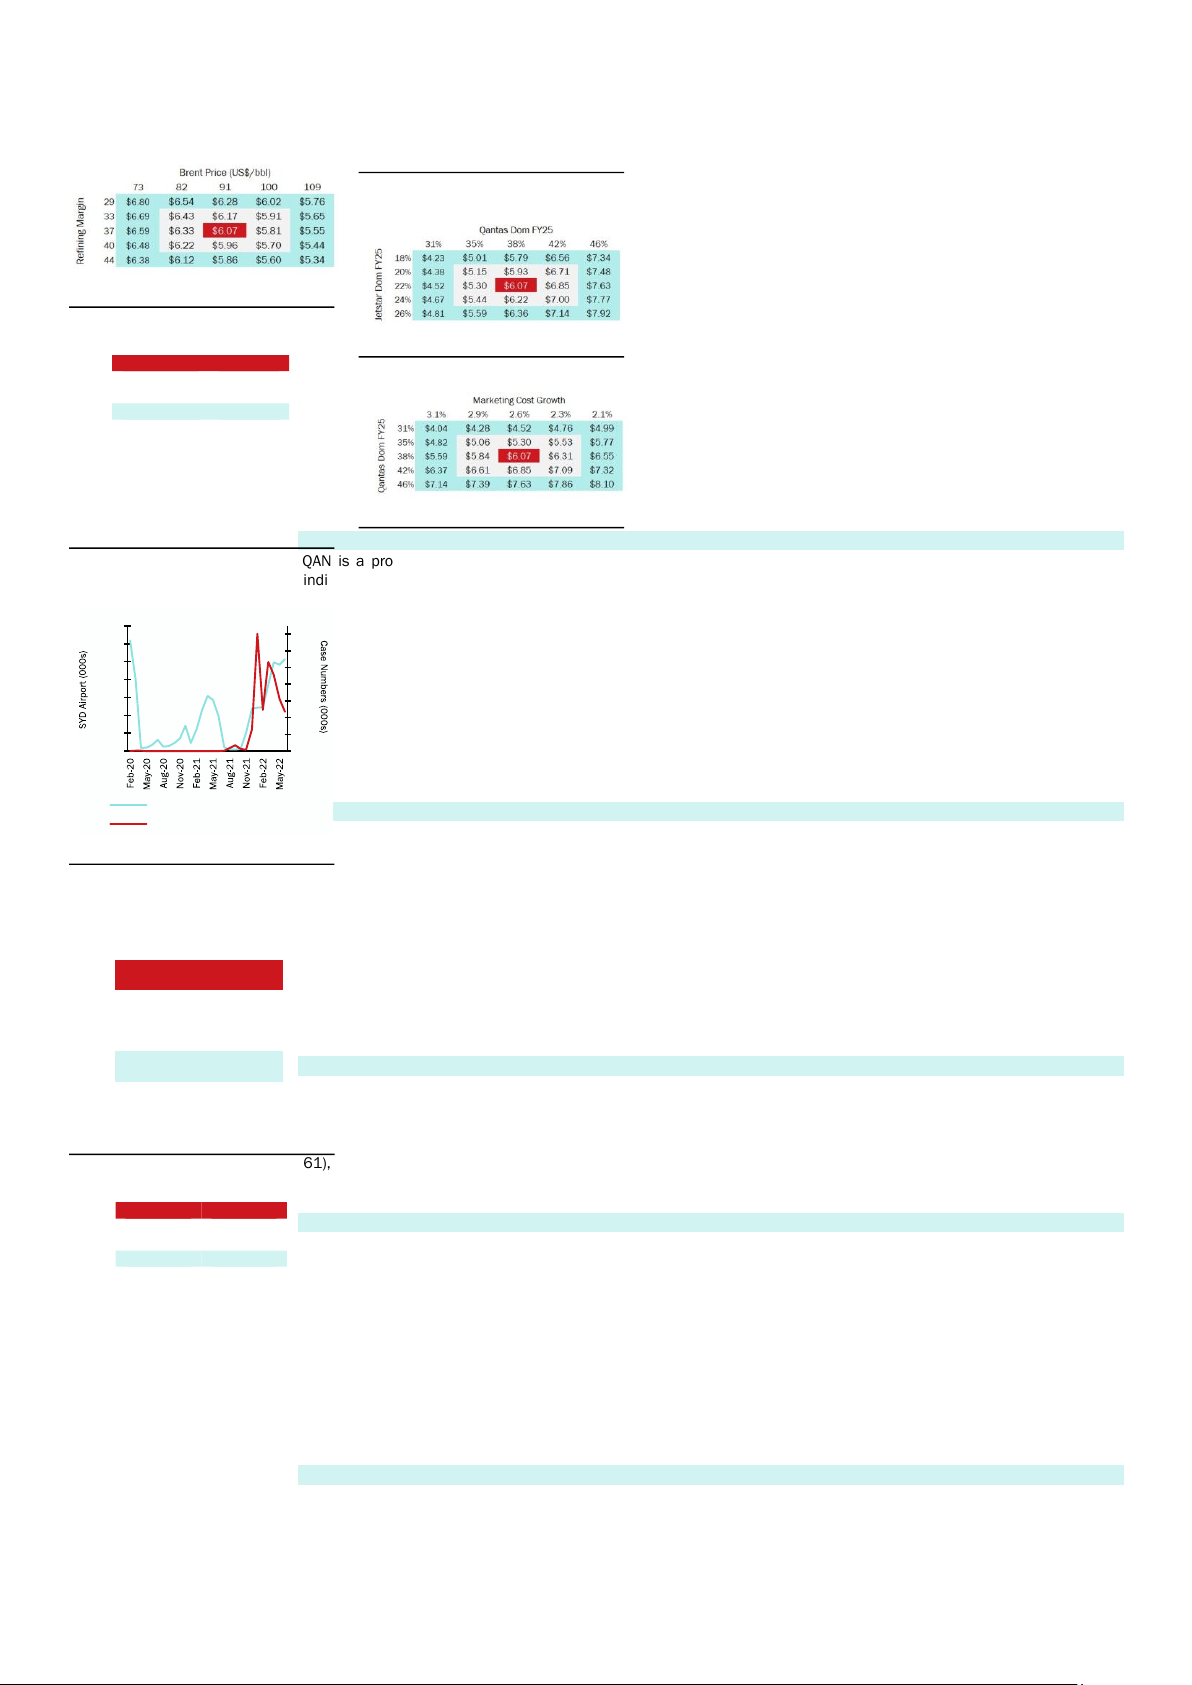
Financial impact of hedging policies: QAN proactively hedges fuel exposure via a declining wedge strategy using two- 100%/Jetstar: 102%),
year forward options and collars to provide significant near-term and tapered protection over a 24-month horizon. As at international at 74.4% in
Mar-22, QAN was hedged for 100% FY22, 40% of 1H23, 30% for 2HY23 and limited hedging for FY24, which grants FY23 and 100.0% in FY24
ample headroom to flex future capacity and pricing ahead of fuel cost increases. Due to limited liquidity in jet fuel as international markets
forward markets, QAN hedges Brent and, alongside airline peers, remains exposed to a refining spread. Refining spreads reopen. Near term load
rose from a 10Y historical average of A$10 to A$80 per barrel in Apr-22, driving fuel cost per ASK increases of 28.4% factor and yield forecasts
in FY22 to A$3.65c/ASK. This is markedly higher than the FY16-FY19 average of A$2.22c/ASK. Despite the uplift, QAN reflect pent-up demand, with
benefitted from its hedging – unit fuel costs only rose 24.8% vs a 71.4% uplift in per barrel fuel costs in FY22. FY23 RASK uplift of 18.4%
Delineating these financial benefits further, US carriers such as American Airlines and Delta Airlines do not hedge any exceeding management’s
fuel exposure, and consequently absorbed 72.7% and 76.2% fuel expense increases into their cost base respectively break-even fuel offset
in FY22. QAN’s hedging has also contributed to less operating margin volatility (120-270bps movements) relative to benchmark to preserve unit
North American airliners (320-610bps movements) across FY15-FY19. Looking forward, hedging benefits are expected profitability against higher
to taper due to the declining profile of the Brent futures curve, jet fuel spreads falling (albeit elevated against historical) expected fuel costs. These
from A$80 in April to A$49 in Aug-22 and QAN’s target 1.5% fuel efficiency targets starting in FY24 with Project Winton factors and yields are
coming live (Exhibit 43). Crucially, each marginal 10bp fuel efficiency gain annually results in a 1.8% share price impact. expected to moderate
Tilt towards accretive Loyalty earnings: Loyalty’s operating model is underpinned by a marketing and redemption margin, across the horizon as pent-
through the sale and redemption of points. With unredeemed Frequent Flyer revenue contributing 42.3% of RRIA up demand normalises. Into
between FY17-FY19, Loyalty has bolstered QAN’s liquidity position by providing a negative net working capital source of steady state, flying revenue
cash flow before it is recognised as revenue. Moreover, QAN’s earnings mix has tilted towards Loyalty by +200bps from tapers down from 3.9%
FY16 to FY19 which presents a continued source of QAN group margin accretion. Loyalty EBIT margins pre-COVID growth in FY26 and
averaged 24.0% (FY16-FY19) (Exhibit 44), markedly above group average of 9.1%. Potential 150bps run-rate margin converges towards 1.4%
uplift in FY24 is reinforced by managerial confidence in a 10% future loyalty EBIT CAGR. Loyalty’s shift to a larger portion domestically and 1.6%
of revenue mix is supported by management targets of a 10-20% uplift on points earnt (marketing rev.) and 25-35% on internationally. Forecasted
points redeemed (redemption rev.) as leisure travel markets reopen. Capital efficiency: QAN’s R0E fell from 25.1% RASK growth balances the
(FY17) to 24.1% (FY19), whilst historical ROIC declined from 20.9% (FY17) to 13.7% (F0Y19). Assessing QAN’s DuPont underlying commoditisation
composition, these declines were underpinned by NPAT margin compression of 80bps (driven by fuel price increases) of the airline industry and
and heightened leverage demonstrated via a 1.9x asset to equity turn expansion across the period (Exhibit 45). Pre- assumption that QAN’s
COVID ROIC (ranging from 13.7%-20.9%) remained above QAN’s WACC of c.10%, implying consistent shareholder value monopolistic position on
creation. However, significant equity destruction was observed during COVID with QAN printing operating losses of FSC/LCC markets notches
A$5.4bn (19.3% statutory asset impairment) between FY20-FY22. Despite this, we view QAN’s A$1bn cost reduction long-term share up from
program (90% completed in FY22) as a source of greater earnings power post-COVID and driver of unit profitability. The 61.0% in FY19 to 63.8% in
A$400m buy back affirms management’s conviction in future capital efficiency, supporting sustained ROIC > WACC
FY28 following Tigerair’s exit
value creation across the forecasts.
(see Industry Analysis).
Capital management |Management have proven to be prudent stewards of capital OPEX driving CASKs and unit
Sources of financing and terms: COVID tested the liquidity and credit position of airline operators; QAN passed with
profitability: QAN’s OPEX is
‘flying colours’ as one of only six airlines to retain an investment grade credit rating. To bolster liquidity and refinance comprised of labour
bonds reaching maturity, QAN conducted two AUD denominated and bank underwritten A$500m bond issuances in (manpower), aircraft
Sep-20 and Sep-21 respectively. Both issuances were oversubscribed, resulting in competitive pricing rates of 5.25% operating variable expenses,
(BBSW+490bps) and 3.15% (BBSW+310bps), notably below the 7.5% (BBSW+490bps) cost of funding they refinanced. fuel and other overheads
Oversubscription within a COVID period, characterised by an anxiety ridden lender zeitgeist, reflects the long-term
(S&M, technology, property
durability of QAN’s cash flows and low refinancing risks. 21.1% of QAN’s A$2,067m term loans are unsecured, with etc.). Whilst QAN
secured loans predominantly held over aircraft and engine assets, with no financial experienced statutory Exhibit 46: Credit Position EBITDA margin expansion from 17.7% (FY16) to 19.3% (FY19) prior to COVID, this was significantly confounded by one-off gains of asset disposals and impairment reversals. A look through underlying EBITDA margin contracted by 270bps in this period due to a 16.4% uplift in fuel costs per barrel (post hedging). QAN has exited COVID with greater earnings power; lOMoAR cPSD| 59085392 Target Price $6.41 Premium* 22.3%
*As of close September 29, 2022 Source: SURG Analysis
covenants on QAN’s debt. QAN also holds A$1,975m in bonds with a staggered maturity profile, weighted average
maturity of ~5.8 years and limited covenants. 63.5% of QAN’s revolving credit facilities mature in CY22, with the
remaining A$575m facility maturing in Dec-24. Recent debt market activity, particularly in the US, has displayed fervent
appetite for airline financing securitised against loyalty subsidiary cash flows. In 2021, American Airlines raised US$7.5b
via bonds and leveraged loans backstopped by its AAdvantage loyalty program cash flows and was priced ~500bps
above LIBOR, while United Airways pledged its own loyalty cash flows within a US$5b loan underwritten in Jun-20. Hence,
despite pricing risks associated with a steepened yield curve, market precedents and recent oversubscriptions
demonstrate QAN’s options in sourcing and pricing future debt capital competitively in existing and US debt capital markets.
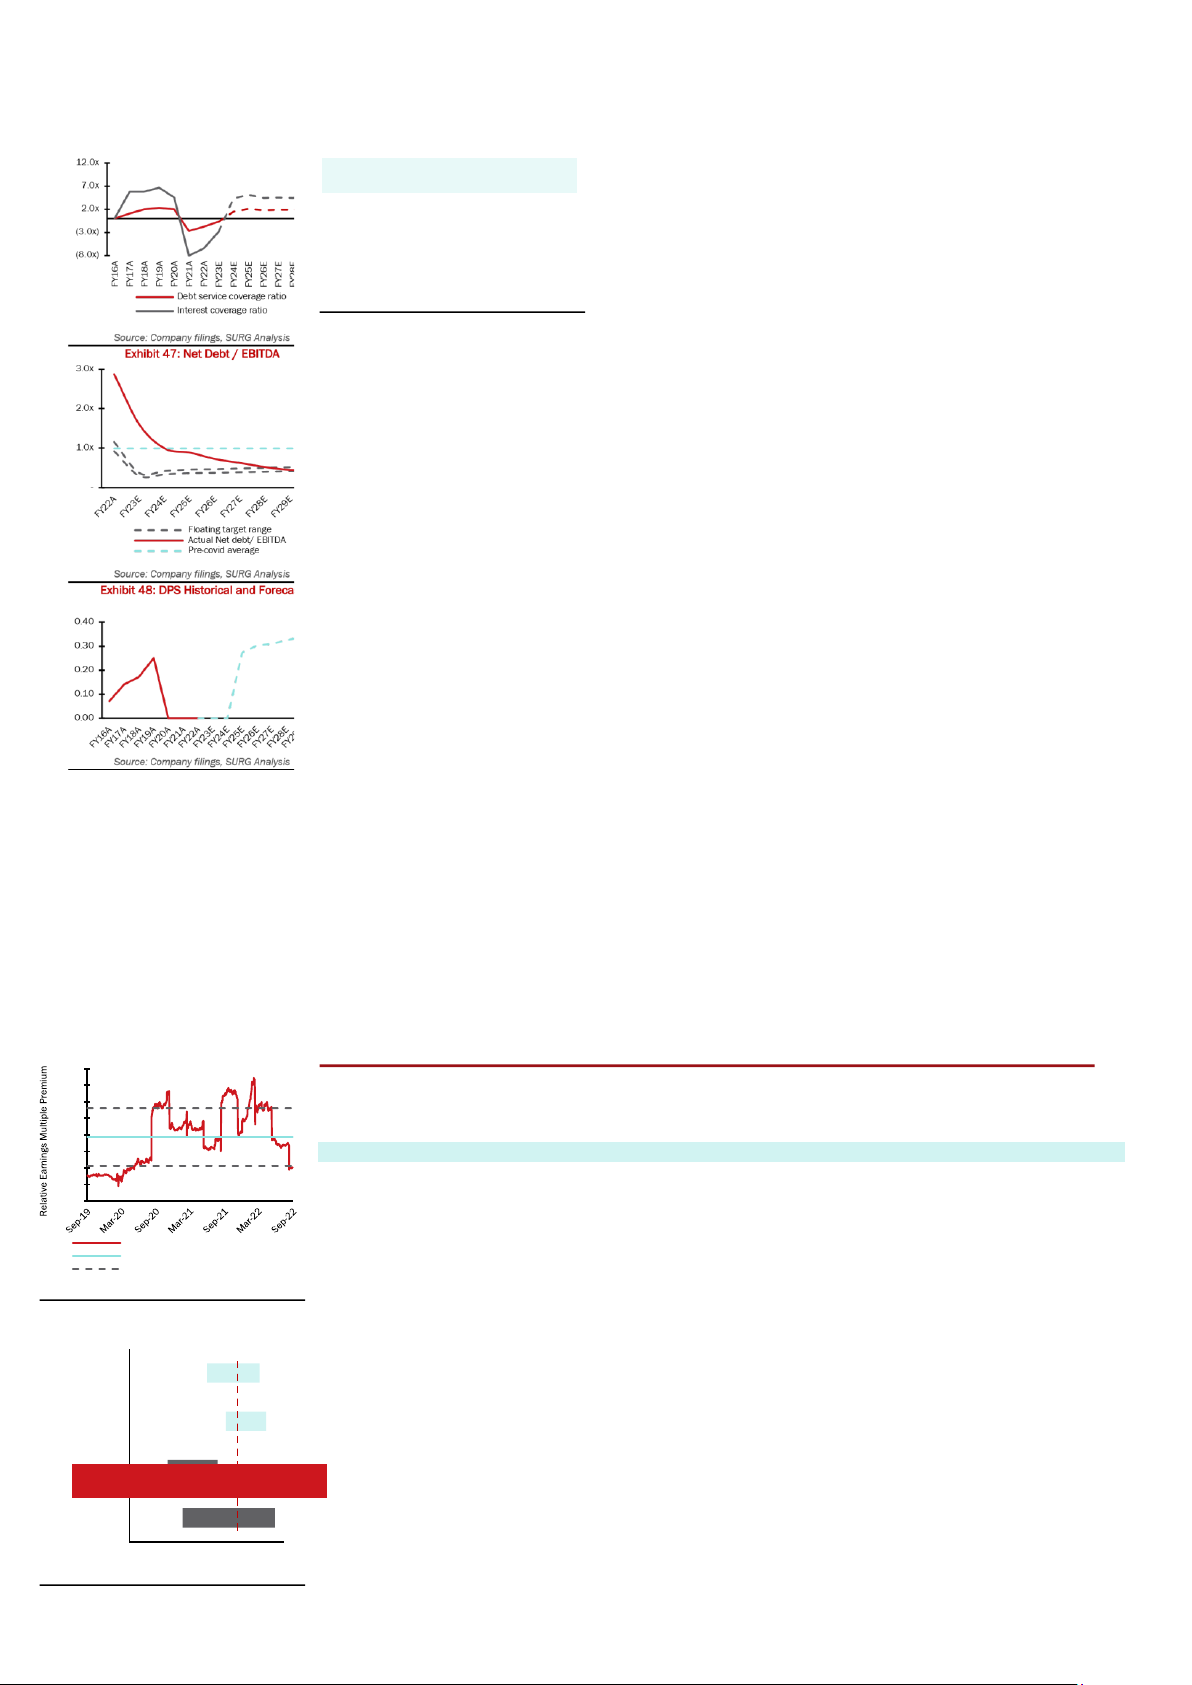
Debt serviceability and credit policy framework: QAN’s credit profile reflects the company’s well-publicised capital
management framework. QAN sets a floating net debt target in a range of 2.0x-2.5x adjusted EBIT (where 10% x ROIC
= adjusted EBIT) with excess returns distributed to shareholders via buybacks and dividends. Investors have
commended the centralisation of QAN’s cost of capital in their framework via their “10% ROIC EBIT” benchmarking, as
it explicitly pegs capital management decision making to shareholder return hurdles. QAN’s net debt/EBITDA multiple
compressed from 1.1x (FY17) to 0.9x (FY19), from a 36% reduction in net debt from FY14 to FY19. However, these
credit levels remained above the upper bound floating leverage targeted for their respective years (0.8x/0.6x), implied
by ROIC EBIT when ROIC is fixed at 10%. Gross debt/EBITDA also compressed from 1.7x (FY16) to 1.5x (FY19), whilst
DSCR increased from 5.8x (FY16) to 4.5x (FY19) and ICR fell from 5.8x to 4.5x across the same period (Exhibit 46).
FFO/net debt, (derived from Standard and Poor’s credit rating ratio), increased from 58% in FY17 to 67% in FY18. This
reaffirmed QAN’s BB+ S&P credit rating at the time. QAN’s serviceability has been restored post COVID and confirmed
with an upgrade to its Baa2 rating from Moody’s Investor Services, moving from a ‘negative’ to ‘stable’ outlook. FY22
de-leveraging and credit restoration has helped QAN’s net debt fall below the bottom end of its optimal debt range (of
A$4.2bn-A$5.2bn). Looking forward, projects Sunrise and Winton will generate a ramped up pro-forma CAPEX profile
requiring increased invested capital. Whilst gearing increases, strong unit revenue and cost benefits support higher
gearing and facilitate a 1.6x FY23 Net debt/EBITDA multiple falling to 1.1x by FY25 and 0.5x in steady state, within the
Exhibit 49: QAN relative to ASX200 Industrials
midpoint of QAN’s 10% ROIC EBIT framework (Exhibit 47). 90.0%
Dividends and payout: Asymmetric balance sheet strength signals can be drawn from QAN’s A$400m on market 80.0%
buyback announcement at FY22 results. It represents a rolling back of the A$1.4b institutional equity placement in Aug- 70.0%
20 that increased shares outstanding by 25%. QAN has distributed excess returns to shareholders historically - 60.0%
averaging a 36.7% payout ratio (FY16-FY19) and buying back 27% of SOI between FY16-FY20. Management have been 50.0%
effective agents of QAN, committed to their capital management framework and the distribution of excess returns when 40.0%
ROIC exceeds WACC. In line with their capital management framework, we forecast a convergence of QAN’s payout ratio 30.0%
towards the FY15-FY19 blended average of Air New Zealand and Singapore Airlines (51.8%), coming online from FY24 20.0%
onwards which is 10% above QAN’s FY19 level. Elevated payout arises from a 200bps unlevered free cash flow margin 10.0%
uplift in FY25 to 4.2%, rising to 6.5% into terminal. Relative EV / EBITDA Multiple Premium VALUATION Mean +- Standard deviation
Our price target of $6.41 (22.3% premium to last close and 23.3% to 1M VWAP of $5.20) was calculated via a weighted
average (70%/30%) of intrinsic valuation (DCF) and relative valuation (EV/EBITDA) methodologies. Our weighting mix
Source: SURG Analysis, S&P Capital
reflects a balanced consideration between consensus expectations priced into the airline sector by public market IQ
investors and the idiosyncratic drivers of QAN’s value.
Exhibit 50: Valuation Football Field
1. Consolidated Discounted Cash Flow Model
1.1 Structure: Our two-stage free cash flow to firm (FCFF) DCF computed an intrinsic valuation of $6.07 per share,
15.8% and 16.7% premium to the last close of $5.24 and 1M VWAP of $5.20 respectively. We calculated a forecast DCF $5.51 $7.21
WACC of 9.5% and terminal WACC of 8.9%, as well as triangulated a terminal growth rate of 2.5% from the median
between Australia’s long term GDP growth rate and 2% lower bound of the RBA’s inflation target. The 6-year time Rel Val (Q1-Q3) $6.12
horizon, through to FY28, balanced forecast accuracy with a runway to reach steady state, given (1) the significant $7.42
impact of COVID on QAN’s financial position; (2) decade long fleet renewal CAPEX ramp-up profile; (3) unlevered free
cash flow growth converging to terminal growth rate; and 4) ROIC and ROE converging to WACC and COE respectively.
Intrinsic terminal value was calculated via a perpetuity growth methodology (Exhibit 54). 52 Week $4.24 $5.85
1.2.1 Revenue: QAN’s revenue is comprised of three segments; passenger revenue, freight revenue and loyalty revenue.
Flying revenue (passenger and freight) is a function of ASKs x RASK (RASK = Load factor x Yield), whilst loyalty revenue Broker $4.72 $7.70
is driven by marketing revenue + redemption revenue derived at different stages of the ~2 year weighted average earn
and burn lifecycle of loyalty points. A portion of QAN’s revenue is comprised of intersegment sales and is netted out as $3 $4 $5 $6
a portion of divisional revenue. $7 $8
1.2.2 Passenger revenue [81% of terminal mix]: Passenger revenue is comprised of QAN and Jetstar branded domestic Source: SURG Analysis
and international divisions. FY23 and FY24 capacity has been scheduled by QAN and explicitly guided by management Exhibit 51: Valuation Matrix
as a % of FY19. Guidance denotes domestic pre-COVID capacity to be restored in FY23, implying 59.1% YoY domestic Methodology Weight Price
ASK growth, whilst international ASKs are to remain at 74.4%. QAN’s International capacity is expected to normalize in
FY24, in line with management guidance, implying ASK growth of 34.5% to restore capacity to pre-COVID levels. DCF 70%
$6.07 Specifically, capacity discipline is expected to be a key lever utilised to drive higher load factors (buoyed by pent-up
demand) and in turn preserve ceteris paribus unit profitability despite heightened fuel costs elevating CASKs. FY23 Rel Val 30%
$7.21 RASK growth is expected to meet the 10% domestic and 20% international break-even growth required to cover rising lOMoAR cPSD| 59085392 fuel costs and widened
back of QAN releasing 50% more Classic Reward seats across its network. Into steady state, refining margin spreads. Into
Exhibit 52: Cost of Debt Assumptions the horizon, ASKs are expected to normalise to the Input Figure FY16-FY19 average (post capacity war levels) and Weight Av. YTM 5.79% nominal revenue of A$19,073m. Index Spreads 4.45% 1.2.3 Freight revenue [7% of P&L interest 3.91% terminal mix]: Freight revenue is derived primarily Cost Debt 4.44% from the belly space of passenger planes, with a Source: SURG Analysis small mix recently generated from freight only planes. QAN has announced an expansion to freight only
Exhibit 53: Cost of Equity Assumptions planes via the acquisition of
six A321 freighters which will Input Figure arrive in 2024 and 2026 to
meet Australia’s uplift in e- Risk free rate 2.80% Commerce and service their A$1.4bn contract with Beta 1.36 Australia Post. We forecast 2.5% CAGR in AFTKs and EMRP 5.98% index RAFTK (revenue per Cost of Equity 10.95% available freight tone kilometre) to CPI across the forecast, reaching Source: SURG Analysis A$1,274m in FY28. 1.2.4 Loyalty revenue [11% Exhibit 54: DCF Output of terminal mix]: Loyalty revenue is recognized as two Base Case (A$m) sources; marketing and redemption. Historical mix analysis implies that Terminal value 23,830 approximately 43% of loyalty PV of Terminal Value 11,629 revenue is booked as marketing (tied to points PV of Forecast Period 2,411 earned) and 57% as redemption (when points are Enterprise Value 14,040 redeemed/burnt). Although Less: Gross Debt (5,960) loyalty earnings have grown at 10% CAGR from FY12- Add: Cash 3,343 FY19, COVID has had an impact on earn and burn Equity Value 11,423 dynamics that are correlated with leisure and aggregate Shares Outstanding 1,886 discretionary demand. As Implied Share Price $6.07 leisure and corporate travel reopens, we utilise the Premium to Last Close 14.5% midpoint of management targets to set our FY24 Source: SURG Analysis expectations, with 15% and 30% uplift in earn and burn
Exhibit 55: EV/EBITDA Premium Relative Valuation growth relative to FY19 respectively. These Asia projections are supported by Europe North America Pacific Current a record breaking 1.2 billion Premium / (6%) (36%) (52%) points being burnt in 48 (Discount) FY15-19 Avg. Premium / (Discount) 23% (19%) (32%) Standard 17% 12% 5% Deviation Comp Set 5.1x 6.6x 7.1x Multiple Implied 6.3x 5.3x 4.8x EV/EBITDA Implied Price $8.65 $7.06 $6.24 Weight 30% 30% 40%
Source: Capital IQ, SURG Analysis Exhibit 56: Risk Matrix
conservatism is demonstrated through forecasted yield on earned and burned points to increase with inflation and
the number of members to increase with population, resulting in A$2,099m FY28 revenue.
1.3 OPEX: OPEX is comprised of Manpower, Aircraft Operating Variables, Fuel and Other SG&M. QAN’s historic OPEX hours in August 2022 on the
fluctuations have centered around oil price fluctuations. QAN’s A$1bn cost reduction program (90% realized in lOMoAR cPSD| 59085392 FY22) has increased the mix
another 94 aircraft through to mid-2030s. Project IRRs of ~15% are expected via unit revenue and unit cost benefits, of variabilisation in QAN’s
where these newer aircraft and engines could reduce emission by 15% and in turn, fuel cost efficiency. Management cost base, pegging CASK
have guided to a net capital expenditure of A$2.2bn-$2.3bn in FY23 upon the delivery of 4-5x aircraft in the initial
with RASK. Whilst QAN’s cost
Winton order. We elevate this quantum in FY24-FY28 to account for a rampedup CAPEX profile relative to FY23. This is reduction program has been
driven by (1) QAN being permitted low upfront payments of 15% and equally staggered CAPEX across the forecast period coined “structural” by
due to its strong reputation and financial position; (2) Sunrise CAPEX beginning in FY24, adding marginal CAPEX management, we recognise
commitments due to the high price of the A350-1000s; and (3) QAN’s initial US$200m commitment to SAF likely to that these costs (e.g.
ramp up as 2030 ESG target deadlines come closer. manpower) will partially re-
1.5 Free Cash Flow to Firm (FCFF): FCFFs have been discounted at a WACC of 9.5% in the forecast horizon and 8.9% in enter the business as
the terminal period. In the forecast horizon, cost of debt was calculated to be 5.0%, using a weighted mix of intrinsic capacity is being restored.
existing instrument terms (e.g., weighted YTM) and comparable (credit rating risk spreads) methodologies. Cost of equity Accordingly, our forecast
was found to be 11.1%, assuming a 3.0% risk free rate, 6.0% market risk premium and 1.4 beta. The terminal values indexes the variable
of cost of debt and equity were 4.0% and 10.0% respectively, due to returns to a higher cash rate, average historical component of each OPEX
risk-free rate, and average historical market risk premiums. Terminal and forecast value were discounted and an implied item (ex-fuel) through unit
share price was calculated (Exhibit 54). CASKs, which vary with 2. Relative Valuation QAN’s capacity levels. We
Our relative valuation resulted in an implied share price of $7.21, a 38.7% premium on the 1-month VWAP of $5.20. forecast fuel costs as
Our method utilised three geography-based trading multiple peer sets (Europe, North America and Asia Pacific), A$5.1bn in FY23, in line with
ascribing a historic premium or discount relative to QAN when comparing the median EV/EBITDA of each peer set. Peer guidance, and tapering into
sets were bucketed into geographies to reflect reasonably homogenous industry drivers across the aforementioned the forecast horizon due to
regions, including common aviation regulations, end-market demographics and upstream suppliers (airports). We felt
the declining profile of the oil
these geographies therefore had similar underlying drivers of growth, margin and risk, where geographic dissonances forwards curve and the
were captured in persistent historic premiums and discounts relative to QAN. effect of QAN’s proactive
Comparable selection: In the absence of an ASX-listed direct competitor, we sought to capture the risk, growth and hedging policies.
margin profiles of QAN with global peers. With limited international peers at QAN’s scale, the set consisted of
1.4 CAPEX: QAN’s significant
predominantly full-service airline groups with significant LCC holdings, matching the Group’s 70/30 split between FSC future capital investment
QAN and LCC Jetstar. As QAN’s market position domestically is unparalleled, peers with strong local share were preferred profile due to the Sunrise
to reflect this market power. Peer selection was quantitatively filtered for peers with low double digit FY23 EBITDA and Winton projects sees
margins, expanding to ~20% FY23-25e EBITDA margins and mid-teens FY23-25e revenue CAGRs. Historical premium CAPEX increasing to ~A$3bn
/ discount: Owing to a combination of local equity market and airline industry forces, QAN has traded with a consistent p.a. Sunrise: Order of 12x
multiple difference to global peers. To ensure the validity of comparison, multiples were adjusted to reflect systematic Airbus A350s with
differences in trading conditions between the ASX and global peer sets, by the application of an CY15-19 historic unprecedented long-haul
multiple (Exhibit 55). Geographical segmentation best captured similar regulations, flight patterns, market factors and
capability (flying direct from
end-market profiles of each region. CY15-19 was deemed to best reflect the forward outlook of the industry by excluding Australia to LON/NYC),
(1) the COVID pandemic, (2) QAN-Virgin price war (20102014), (3) Euro-debt crisis (2011-2012) and (4) American starting in from Sydney in
Airlines Bankruptcy (2011) impacts on multiples. In valuation, we conservatively assume that QAN’s growth, profitability 2025. Winton: domestic
or risk profiles have not advanced relative to global peers. As discussed in Thesis 1.1, this conservative assumption fleet renewal beginning
leaves QAN with further upside. FY24, with an order of 20x
Multiple selection: EV/EBITDA (1-yr forward) was ascribed a 100% in the relative valuation. Applying adjusted multiples A321XLRs and 20x A220-
to a forward group EBITDA figure of $2,943m yields an implied share price of $7.21, with 30%/30%/40% weighting 300s to replace retiring
towards Europe/North America/Asia Pacific buckets respectively. A forward EV/EBITDA multiple was used for 4 main Boeing 737s and 717s.
reasons. (1) Upon introduction of AASB-16, operating leases (aircraft leasing expense) and depreciation (aircraft Project Winton includes
ownership expense) are both reflected below EBITDA. EBITDA therefore is not affected by differing aircraft purchase right options for Source: SURG
Forward figures are better aligned with valuation focus on future cash flows. (4) COVID responses saw a drastic deviation Analysis
in capital structure as airlines initially levered up, before engaging in balance sheet repair strategies. We anticipate Exhibit 58: RPK Sensitivity
continued capital structure noise in the medium-term and as such, have utilised EV/EBITDA, as opposed to more sensitive RPK Share price
equity multiples. EV values were adjusted to account for operating leases, as per AASB-16. 2-yr and 3-yr forwards were not -10% $4.62
utilised due to inconsistent data availability.
Relative positioning of QAN: As depicted in Appendix 9, QAN is trading at a discount to peers, between 1 and 2 standard -5% $5.34
deviations below historical levels. We anticipate QAN’s improved domestic positioning, ability to capture international
routes, unit profitability advantages and strengthened freight business should have narrowed the discount on APAC and 0% $6.07
North American peers and strengthened the premium over European peers. This suggests a market underappreciation of +5% $6.82
QAN’s improved business quality and operating conditions relative to its international peers. We expect QAN’s +10% $7.57
comparatively improved earnings power to deliver above-expectation earnings results, catalysing a relative trading
readjustment at least to historical levels, and very likely beyond. Source: SURG Analysis RIS KS
[V1] Valuation | Sensitivity & Scenario Analysis ownership and
A scenario analysis was conducted to assess key drivers of QAN’s share price, such as load factors/yield/market share in leasing patterns, an
different macroeconomic climates (Appendix 14). Our bull ($7.32) and bear ($4.84) prices reinforce our BUY important
recommendation. Further valuation assumptions were flexed in sensitivity and Monte Carlo analyses to test our characteristic to
recommendation’s robustness (Appendix 13, Appendix 15), including Brent prices as a key driver of CASK. assess the underlying business quality. (2) EBITDA is well- regarded as a cash
Exhibit 59: FY23 Crude Futures/Refining Margin flow proxy, Sensitivity unaffected by deviations in D&A accounting practices between airlines from 11 countries. (3) lOMoAR cPSD| 59085392
S ource: SURG Analysis
Exhibit 64: FY25 Qantas/Jetstar Domestic Market Share Sensitivity
S ource: SURG Analysis
Exhibit 60: FY23/24 Group Capacity Sensitivity (% of 2019) S ource:
SURG Analysis Group Capacity Share Price
Exhibit 65: Marketing Cost Growth vs Qantas 90 % Market Share Sensitivity $5.08 93 % 95 % 98% $6.57 100 % $7.07 $5.58 $6.07
S ource: SURG Analysis
S ource: SURG Analysis
[M1] Market Risk | Turbulence of macroeconomic downturn subduing demand
Ex hibit 61: NSW Monthly Case Numbers a Q nd S AN
YD is a procyclical high beta stock (β = 1.36) that would underperform in a recession scenario. If macroeconomic
Airport Passenger Movements indicators continue to soften, this could lead to (1) a weaker demand backdrop, particularly for long-haul international
flights given the higher cost of overseas leisure trips (1.8x domestic trips) and (2) increased price sensitivity as interest
rates cut into household budgets, resulting in preference for mid-market or LCCs. Valuation Impact: a 10% reduction in 3500 7FY
00 23-24 RPK to 79% of FY19 levels (driven by 5% decrease in load factor/capacity) reduces DCF share price by 31.4% to 3000 6 2500 $ 0 4
0 .62 (Exhibit 58). Mitigant: (1) QAN’s passenger volume in previous downturns (i.e., GFC) was relatively resilient with no 5 2000 m
00 ore than 10% of traffic disrupted for <6 months. Current macroeconomic conditions are differentiated by the low 400 1500 3u 0 n
0 employment levels and pent-up demand (see Industry Overview). (2) With a lower fixed-cost base post-restructuring, 1000 2st 00 ron
g market positioning and a disciplined Virgin, QAN has greater flexibility to adjust capacity for margin preservation in 500 1respo 00
nse to a demand shock. (3) QAN’s mix of business travel which is 60% skewed to government, fly-in/fly-out and 0 0c
onstruction workers will be less disrupted by a macroeconomic slowdown. (4) In weaker economic climates with
unfavourable FX rates, Australians have typically downgraded travel plans as opposed to cancelling altogether. LCCs are
hence less cyclical than FSCs, with Jetstar well-placed to capture demand for cheaper flights, especially upon Tiger’s exit.
SYD Airport Passenger Movements [M2] Market Risk | Persistently elevated fuel prices NSW COVID Case Numbers Althou
gh FY23 Brent Crude price risk is 75% hedged, QAN does not hedge jet fuel exposure and is exposed to higher crack
spreads. Global jet fuel prices rose more than 70% during the first 6 months of 2022, with refining margins reaching a
Source: NSW Government. SURG
record-high of US$80/bbl in Apr-22 (vs historical average of US$10/bbl). This was due to tight supply conditions amidst Analysis
sanctions on Russian distillates and global underinvestment in refining capacity. Given fuel costs represent 26% of OPEX, Exhibit 62: FY23-25e
high fuel prices that cannot be recouped through fares will hinder profitability. Valuation Impact: a 10% increase in FY23 Manpower Expense Sensitivity
refining margin/crude price reduces share price by 13.3% to $5.34 (Exhibit 59).
Mitigant: (1) The jet fuel supply crunch is easing as refining supply has rebounded globally: the IEA expects Q3 CY22 to be
the first quarter in two years where the supply of refinery products surpasses demand. Refining margins have already Manpower Share Price
retreated to $49 in Aug-22, down 39% from Apr-22, whilst jet fuel price also retreated by 28% in early August from its -10% $6.77
recent peak. (2) We assume QAN can offset elevated fuel costs through reducing capacity and increasing airfares (+18.4%
Group RASK vs FY19). (3) QAN has superior hedging compared to competitors (see Financial Analysis), and hence are in a -5% $6.42
relatively better position compared to other global airline operators.
[F1] Firm Risk | New COVID-19 variant outbreak 0% $6.07 +5% $5.73
A ‘Black Swan’ event such as a new variant outbreak may lead to deteriorating travel confidence and hinder QAN’s ASK
recovery to pre-COVID levels, where safety concerns and containment policies would dampen mobility. Valuation Impact: +10% $5.38
5% reduction in FY23/24 capacity to 90% of FY19 reduces price by 16.3% to $5.08 (Exhibit 60). Mitigant: one notable
S ource: SURG Analysis
shift in the global landscape is that the link between COVID-19 infection rates and air traffic has become less linear (Exhibit
Exhibit 63: Forecast Horizon Yield Growt 61)
h , particularly given the high level of vaccination in key QAN markets such as Australia (84.8%) and New Zealand (81.3%). Sensitivity
With the notable exception of China, countries have largely abandoned a ‘Zero-COVID’ approach, suggesting that disruptive
border closures are unlikely in the future. Yield Growth Share Price
[F2] Firm Risk | Disruptive employee disputes 1.80 % $5.76 1.90 %
Amidst an industry-wide staff shortage from Mar-22 as capacity ramped up faster than anticipated, QAN is facing backlash $5.92 2.00 % $6.07
from existing employees. Its currently negotiated Enterprise Bargaining Agreement has been protested by labour unions 2.10 % $6.23
(see ESG). QAN’s resetting of its cost base reduced FTEs by a third, leading to extensive negative press coverage on a 2.20 % $6.39
supposedly understaffed, high-pressure work environment. An escalation of employee tensions could (1) lead to further
industrial action that disrupts the Group’s day-to-day operations (2) increase labour attrition (3) further damage QAN’s
reputation as an employer, hence making it more difficult to recruit in an already tight labour market and (4) force QAN to
offer higher incentives to attract and retain employees. Valuation Impact: A 10% increase in FY23-25e manpower expenses
growth reduces our target price by 11.44% to $5.38 (Exhibit 62). Mitigant: (1) Unions have given assurance that they will
not harm the public; whenever a stoppage occurs, ‘alternative labour provisions will be provided.’ (2) 30 EBAs have already
been signed, with 5000 employees agreeing to the terms. A one-off $5000 staff bonus is a further incentive to signing,
with terms stipulating that agreement must be made within 9 months. (3) Despite negative publicity, QAN received 25,000
job applications for 2,500 recently advertised roles: desire to work for QAN is greater than what the media is portraying.
[F3] Firm Risk | Increased competitive intensity
Australia’s aviation policies favour liberal rights of entry. QAN’s competitors include government-controlled offshore airlines
which increased capacity pre-COVID. Competition may also increase with new entrants Bonza/Rex and the creation of
alliances between airlines (e.g., Virgin’s codesharing agreement with United Airlines). Rex has expanded its 737 fleet from
6 to 30 in a bid to service the Golden Triangle, whilst Virgin intends to grow its B737 fleet by 50% to 88 in 2023. Aggressive
pricing and/or capacity uplift by competitors seeking to gain market share can adversely affect the QAN’s yield
Tài liệu liên quan:
-
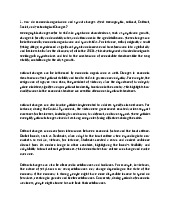
Economic & Demographic Changes: Impact of Globalization & Policy | Môn Business Analysis and Valuation - Trường Đại học Quốc tế, Đại học Quốc gia Thành phố Hồ Chí Minh
99 50 -
Lecture 2: Strategic Analysis on Market Structure & Competition (2024) | Môn Business Analysis and Valuation - Trường Đại học Quốc tế, Đại học Quốc gia Thành phố Hồ Chí Minh
103 52 -
Lecture 1: Introduction to Business Valuation (2024-2025) | Môn Business Analysis and Valuation - Trường Đại học Quốc tế, Đại học Quốc gia Thành phố Hồ Chí Minh
98 49 -

Lecture 4: Module 2 Financial Ratios & Market Tests Analysis (2023-2024) | Môn Business Analysis and Valuation - Trường Đại học Quốc tế, Đại học Quốc gia Thành phố Hồ Chí Minh
100 50