Lecture 4: Module 2 Financial Ratios & Market Tests Analysis (2023-2024) | Môn Business Analysis and Valuation - Trường Đại học Quốc tế, Đại học Quốc gia Thành phố Hồ Chí Minh
Lecture 4: Module 2 Financial Ratios & Market Tests Analysis (2023-2024) Môn Business Analysis and Valuation. Tài liệu được sưu tầm gồm 33 trang, giúp bạn ôn tập tốt hơn. Mời các bạn đón xem.
Môn: Business Analysis and Valuation (BAV 2023) 6 tài liệu
Trường: Trường Đại học Quốc tế, Đại học Quốc gia Thành phố Hồ Chí Minh 2 K tài liệu
Tác giả:

Preview text:
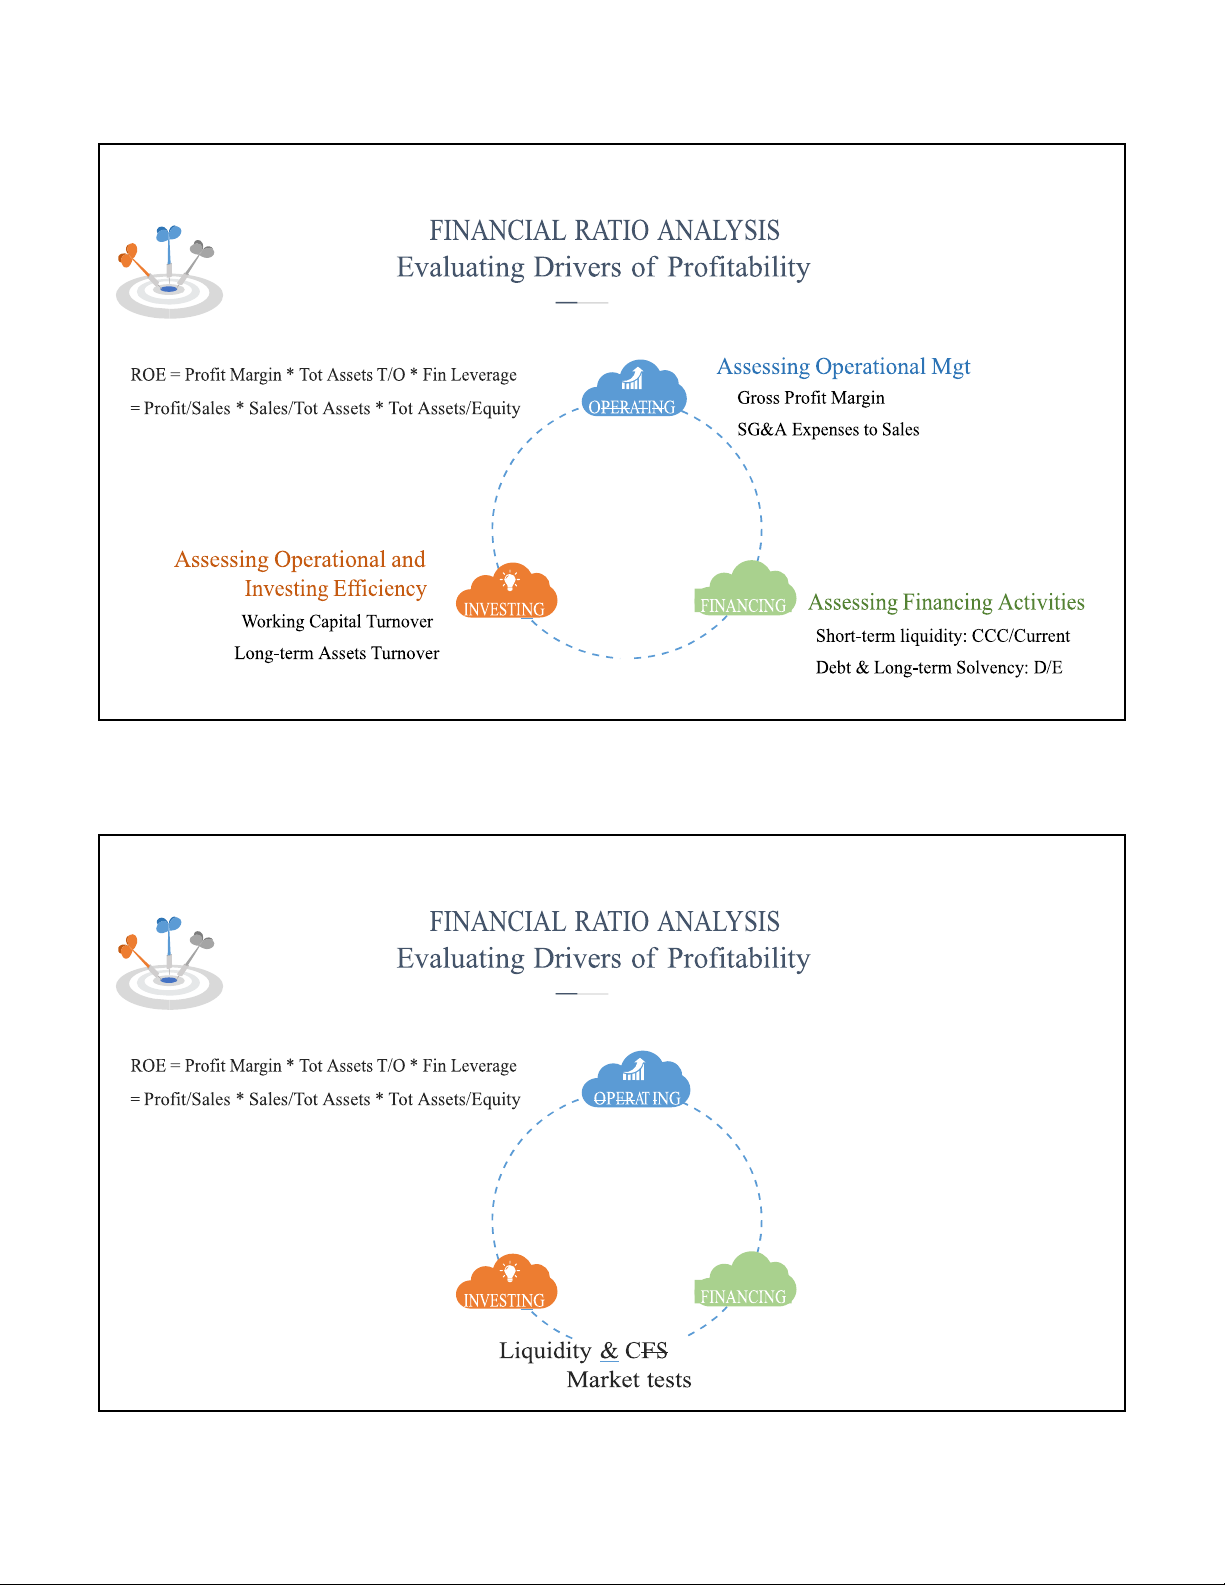
lOMoAR cPSD| 59085392 9/27/2022 lOMoAR cPSD| 59085392 9/27/2022 Overall Profitability Overall Profitability Analysis lOMoAR cPSD| 59085392 9/27/2022 lOMoAR cPSD| 59085392 9/27/2022
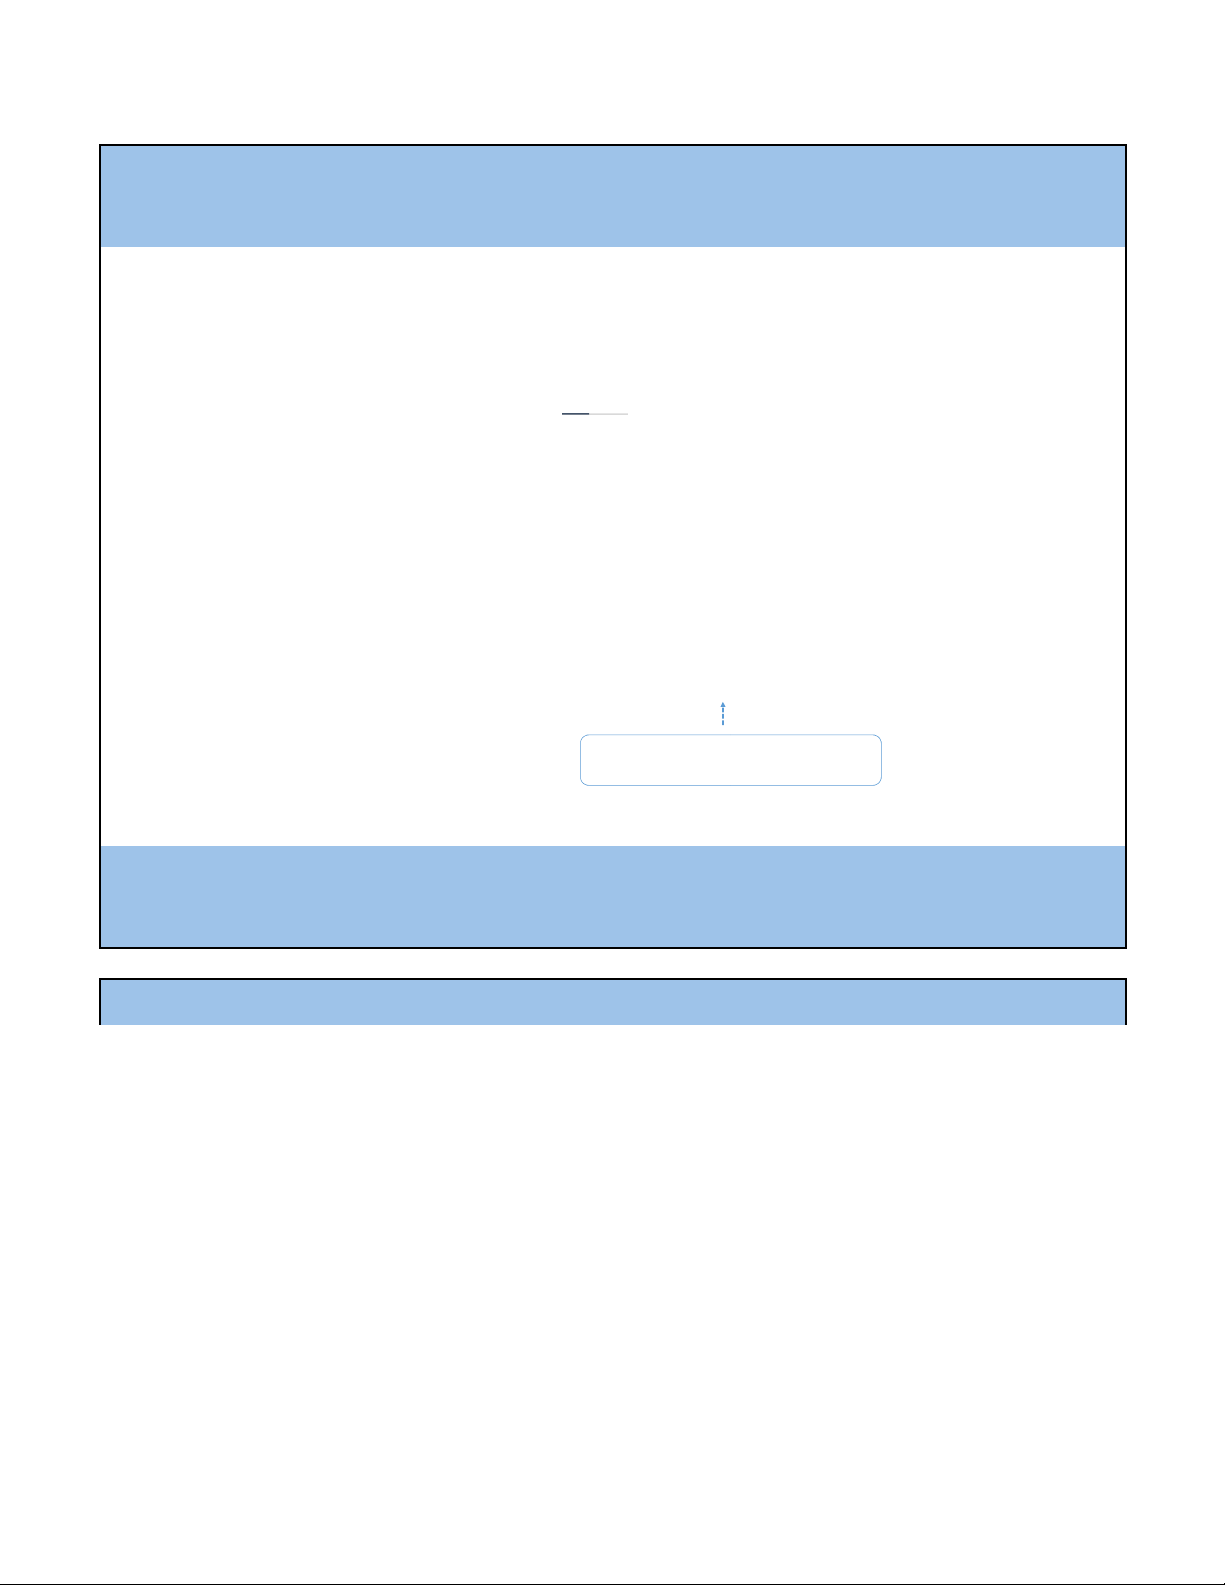
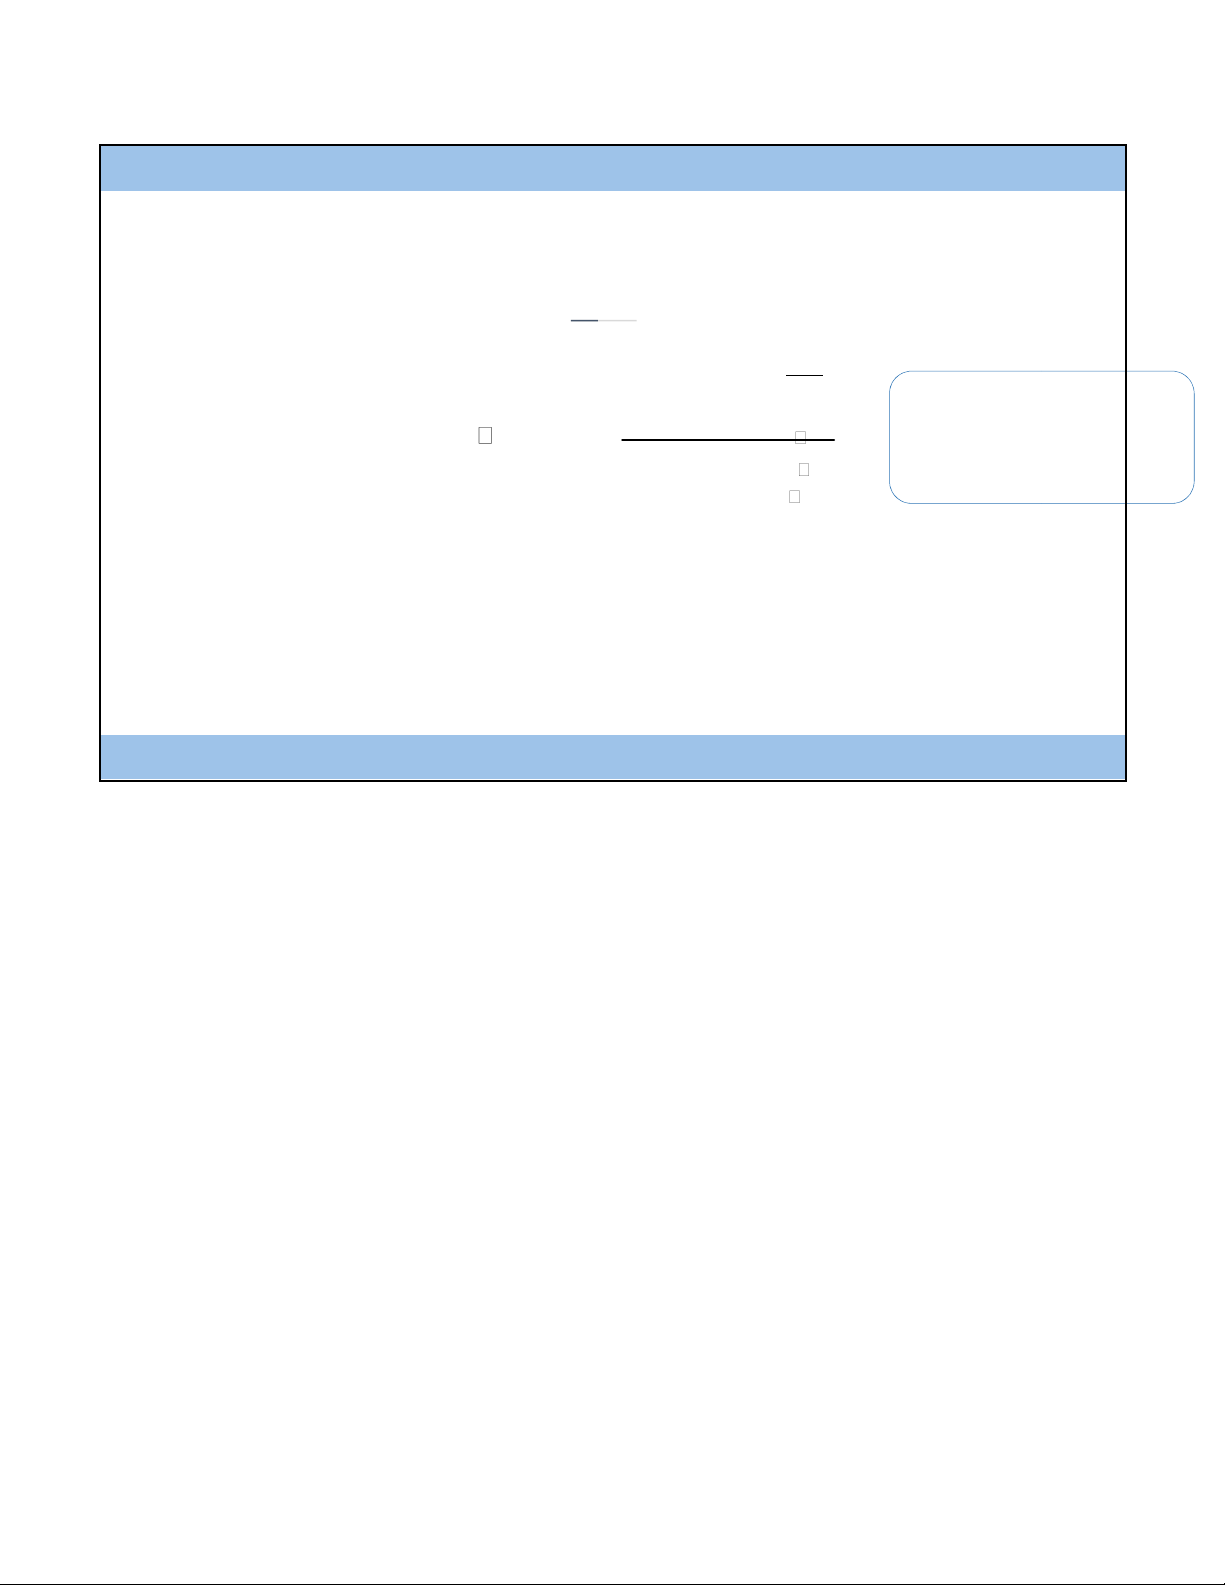
ASSESSING OPERATIONAL MANAGEMENT Note: depends on GROSS PROFIT MARGIN Degree of competitors Customer powers (low) Substitution (low) pricing strategy (uniqueness of the product) vs. cost structure Note: depends on
• This ratio allows a focus on average unit mark-ups Supplier power (ability to access low-cost materials) Gross_Profit = sales - COGS Degree of new/updated GPM prod. process Sales
• A high GPM implies that firm has relatively more flexible in product pricing and
less vulnerable to change in cost
• Other margins include: net profit margin (NI/Sales), EBIT margin (EBIT/Sales) lOMoAR cPSD| 59085392 9/27/2022
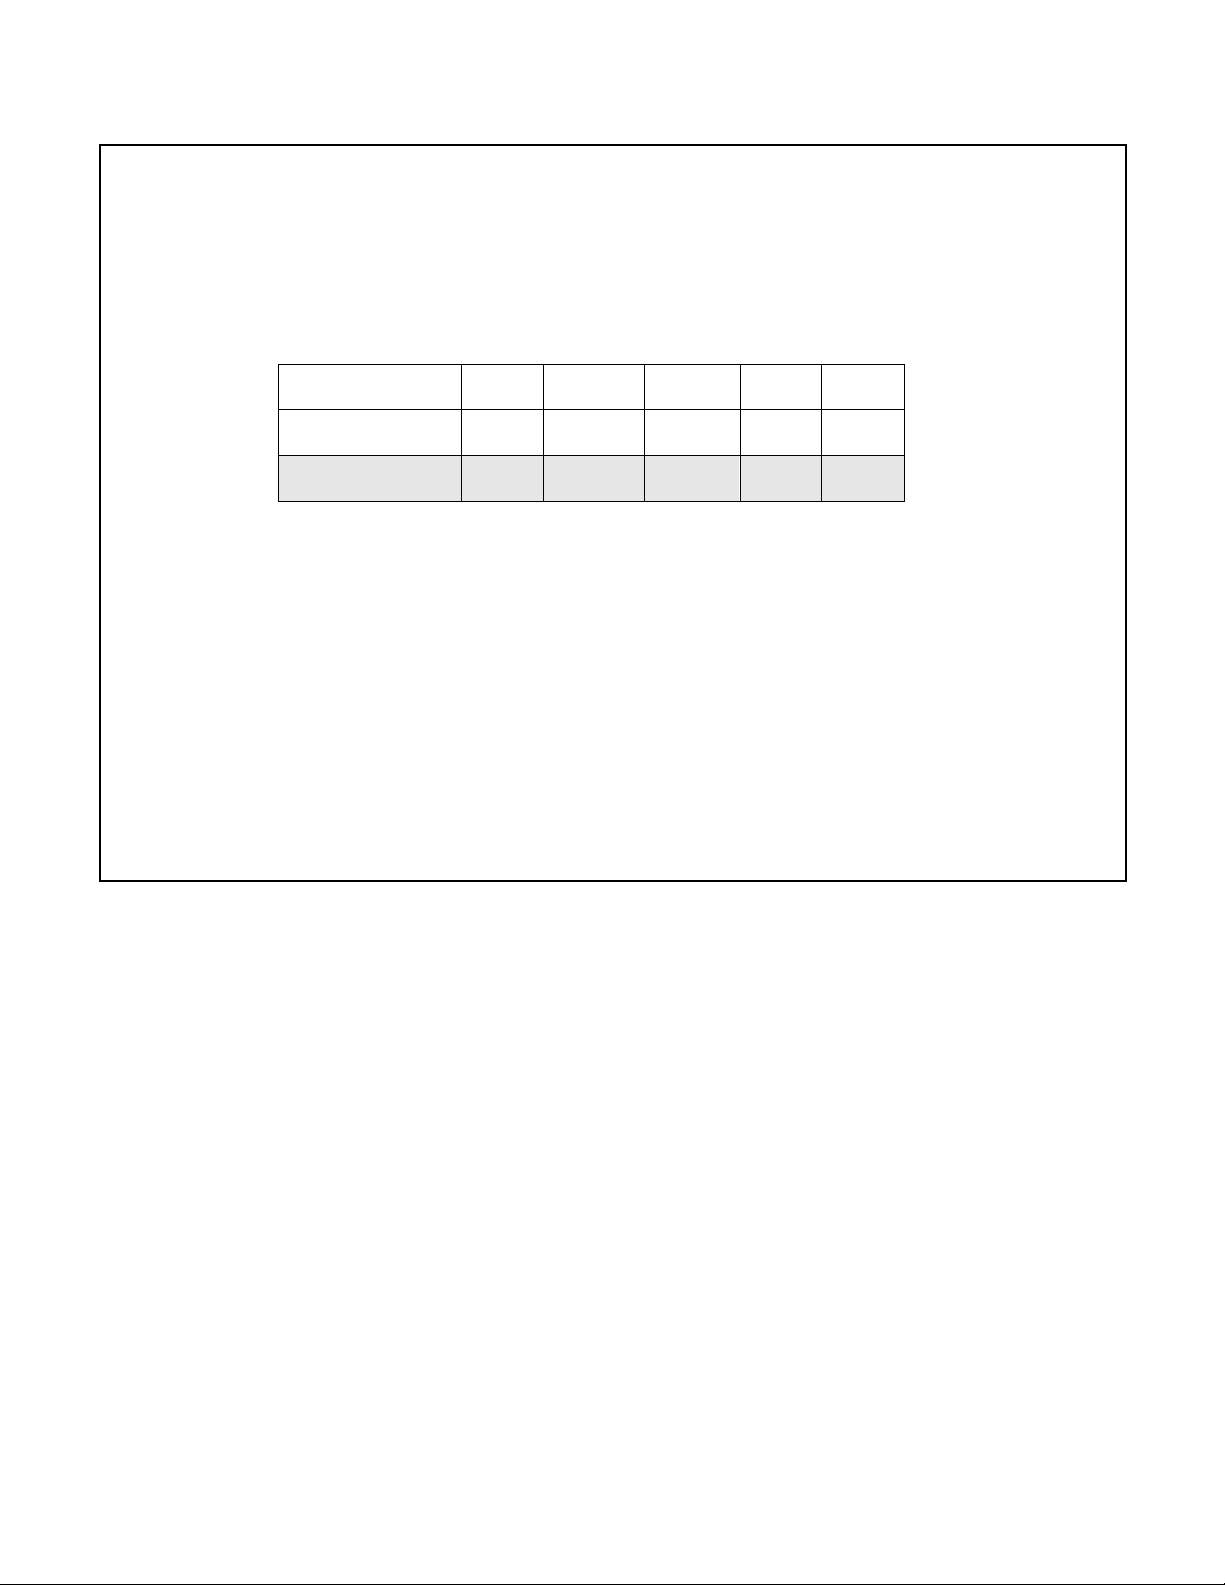
• E.g. Huu Lien Asia JSC. (HOSE: HLA) is a Vietnamese steel manufacturer.
Its historical margin ratios are as follow: 2009 2010 2011 2012 2013 * Gross Profit Margin (GM) 10% 11% 8% 6% 0.3% * NI Margin (NM) 2.6% 0.5% 0.06% 0.3% Loss * Sales growth rate 39% 14% 13% 52% -18% * COGS growth rate 34% 12% 16% 56% -14% * COGS / sale 90% 89% 92% 94% 99.7%
HLC reported net loss of –VND235b. in 2013 lOMoAR cPSD| 59085392 9/27/2022 lOMoAR cPSD| 59085392 9/27/2022
ASSESSING OPERATIONAL EFFICIENCY ACCOUNT RECEIVABLE TURNOVER
• This ratio measures how soon sales will become cash credit sale Net_Sales
Ex: AR T/O = 2,400/400 = 6 times AR_turnover Avg_AR
• Perhaps a more intuitive measure of the rate at which AR are being collected is the days receivable outstanding
Days_Receivables_Outstanding 365/AR_turnover
Rule of thumb: Days_Receivables_outstanding < 1.5 x credit term Ex: Days_= 365/6 = 60 days
ASSESSING OPERATIONAL EFFICIENCY INVENTORY TURNOVER
• This ratio measures how quickly inventory being sold COGS INV_turnov er Avg_INV
• Perhaps a more intuitive measure of the rate at which inventory are being sold is the days inventory held:
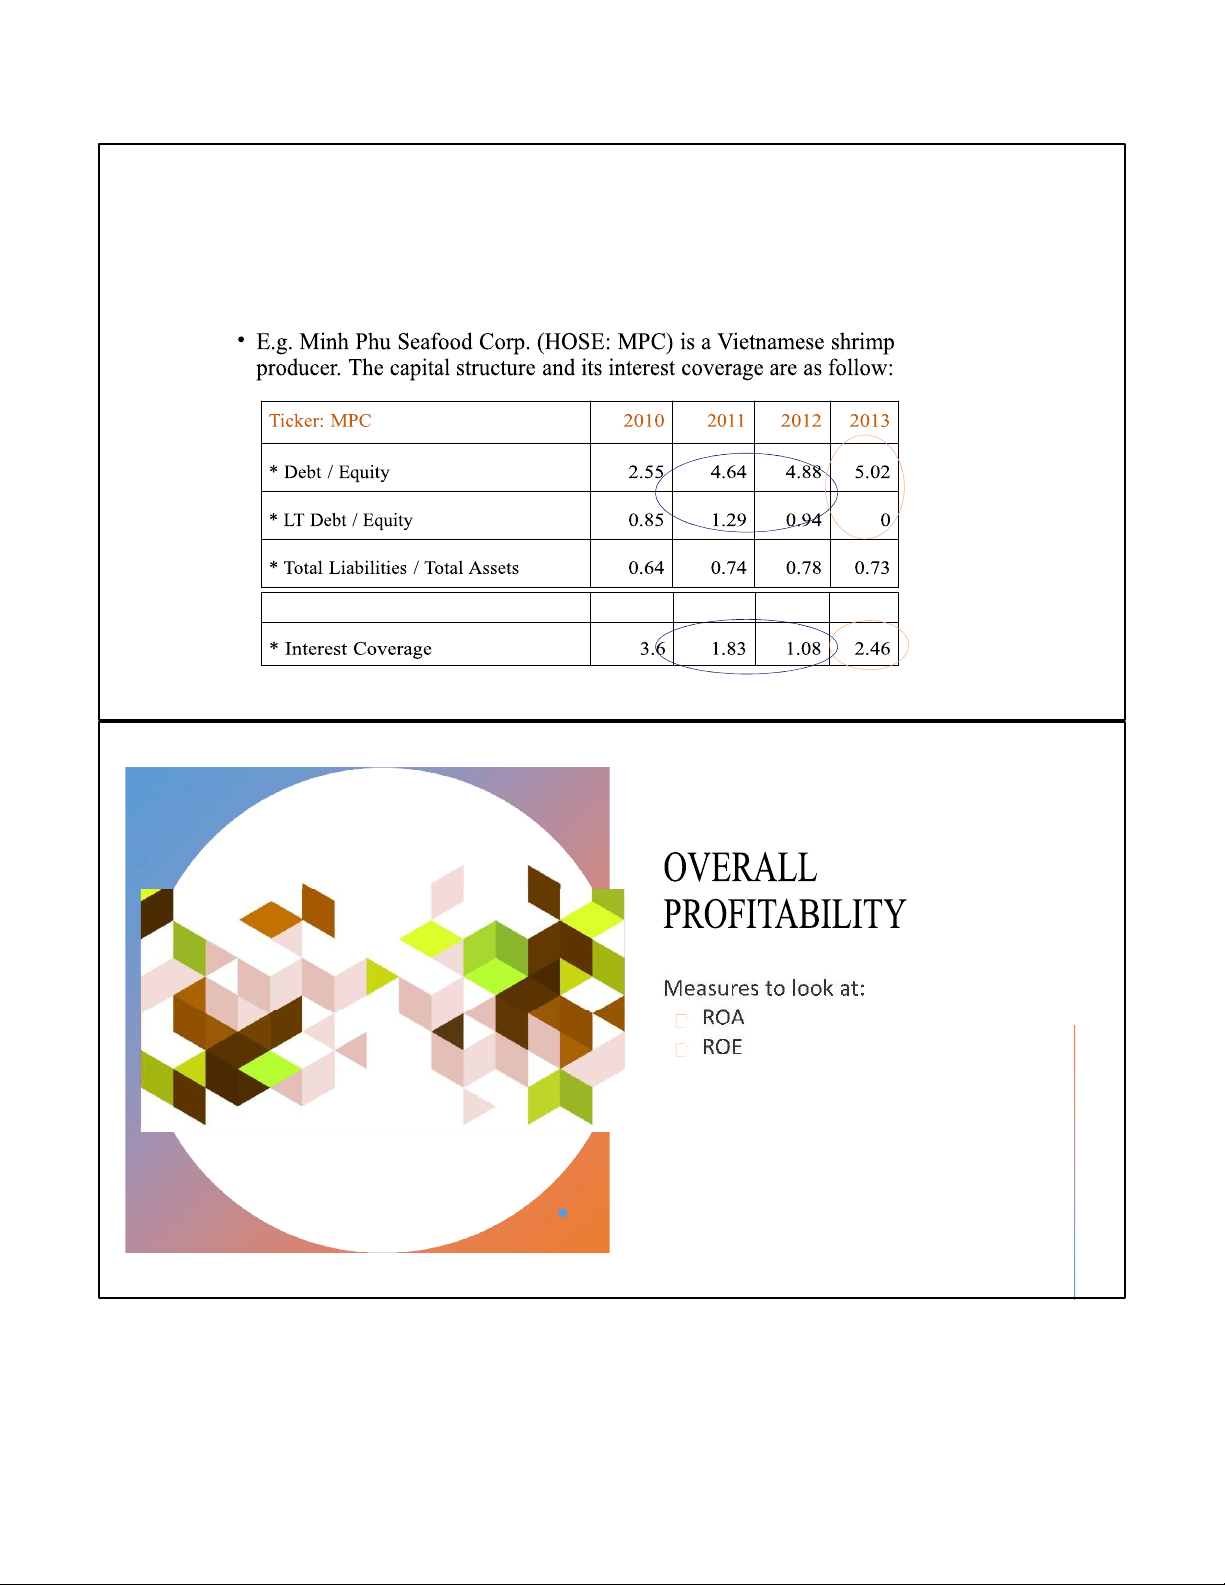
Days_Inventory_held 365/Inv_turnover lOMoAR cPSD| 59085392 9/27/2022 • E.g. The Vietn Minh amese Phu Seaf aoq odua C -oprodu rp. ( ct i MPC) ndustry has an indus 2009 try inve 2010 ntory 2011 2012
T/O of 4.08 (2011) and 3.46 (2012) * Inventory T/O 3.6 4.4 3.3 3
MPC, 2012: *Inventory Days Outstanding 102 83 111 120
- Growth inventory 98% - Growth COGS 18% Marine Product No. 3 Company 2009 2010 2011 * Inventory T/O 24.6 30.6 22.28
Marine No. 3, *Inventory Days Outstanding 15 12 16 2012: - Stop operating in seafood product lOMoAR cPSD| 59085392 9/27/2022
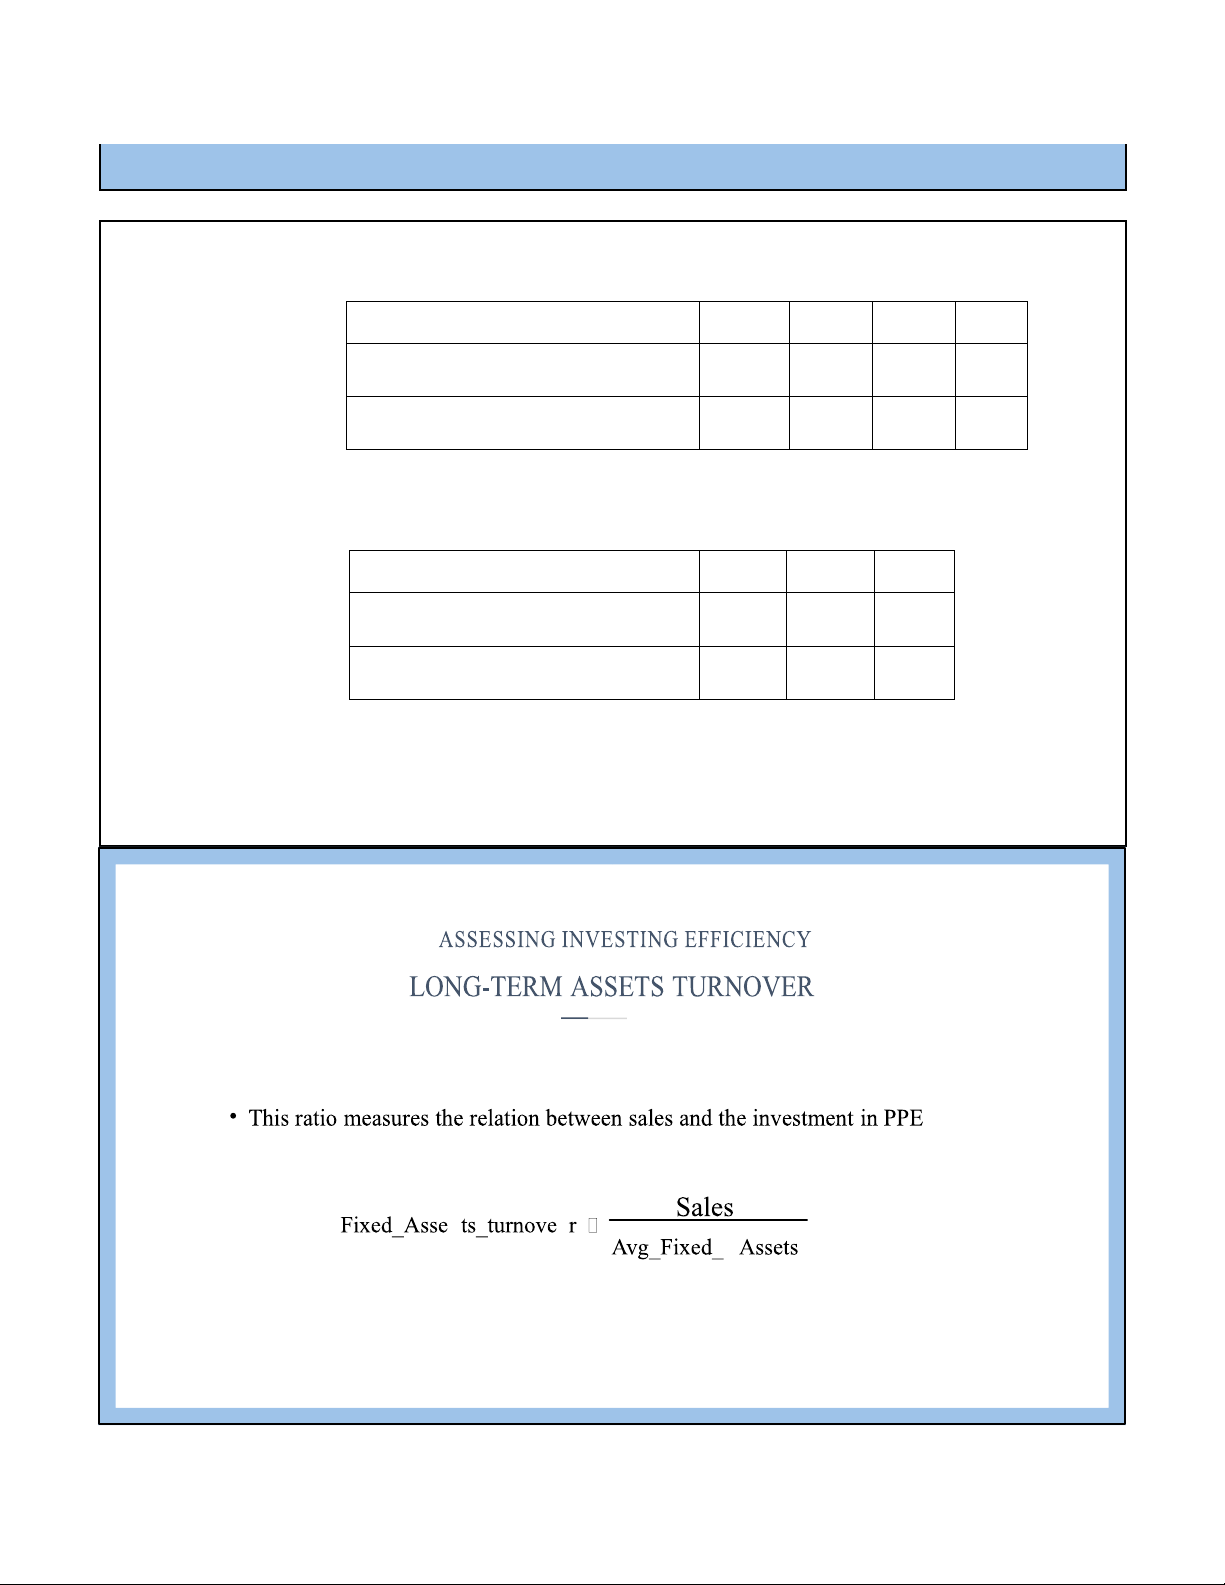
• E.g. Lamson Sugar Cane (HOSE Ticker: LSS) is a Vietnamese sugar
producer. Historically the company has reported the following turnover ratio.
What do we know about the efficiency? 2010 2011 2012 2013 * Tangible Fixed Assets T/O 6.63 9.02 2.81 1.54 * Sale growth rate 22% 51% -7% -2%
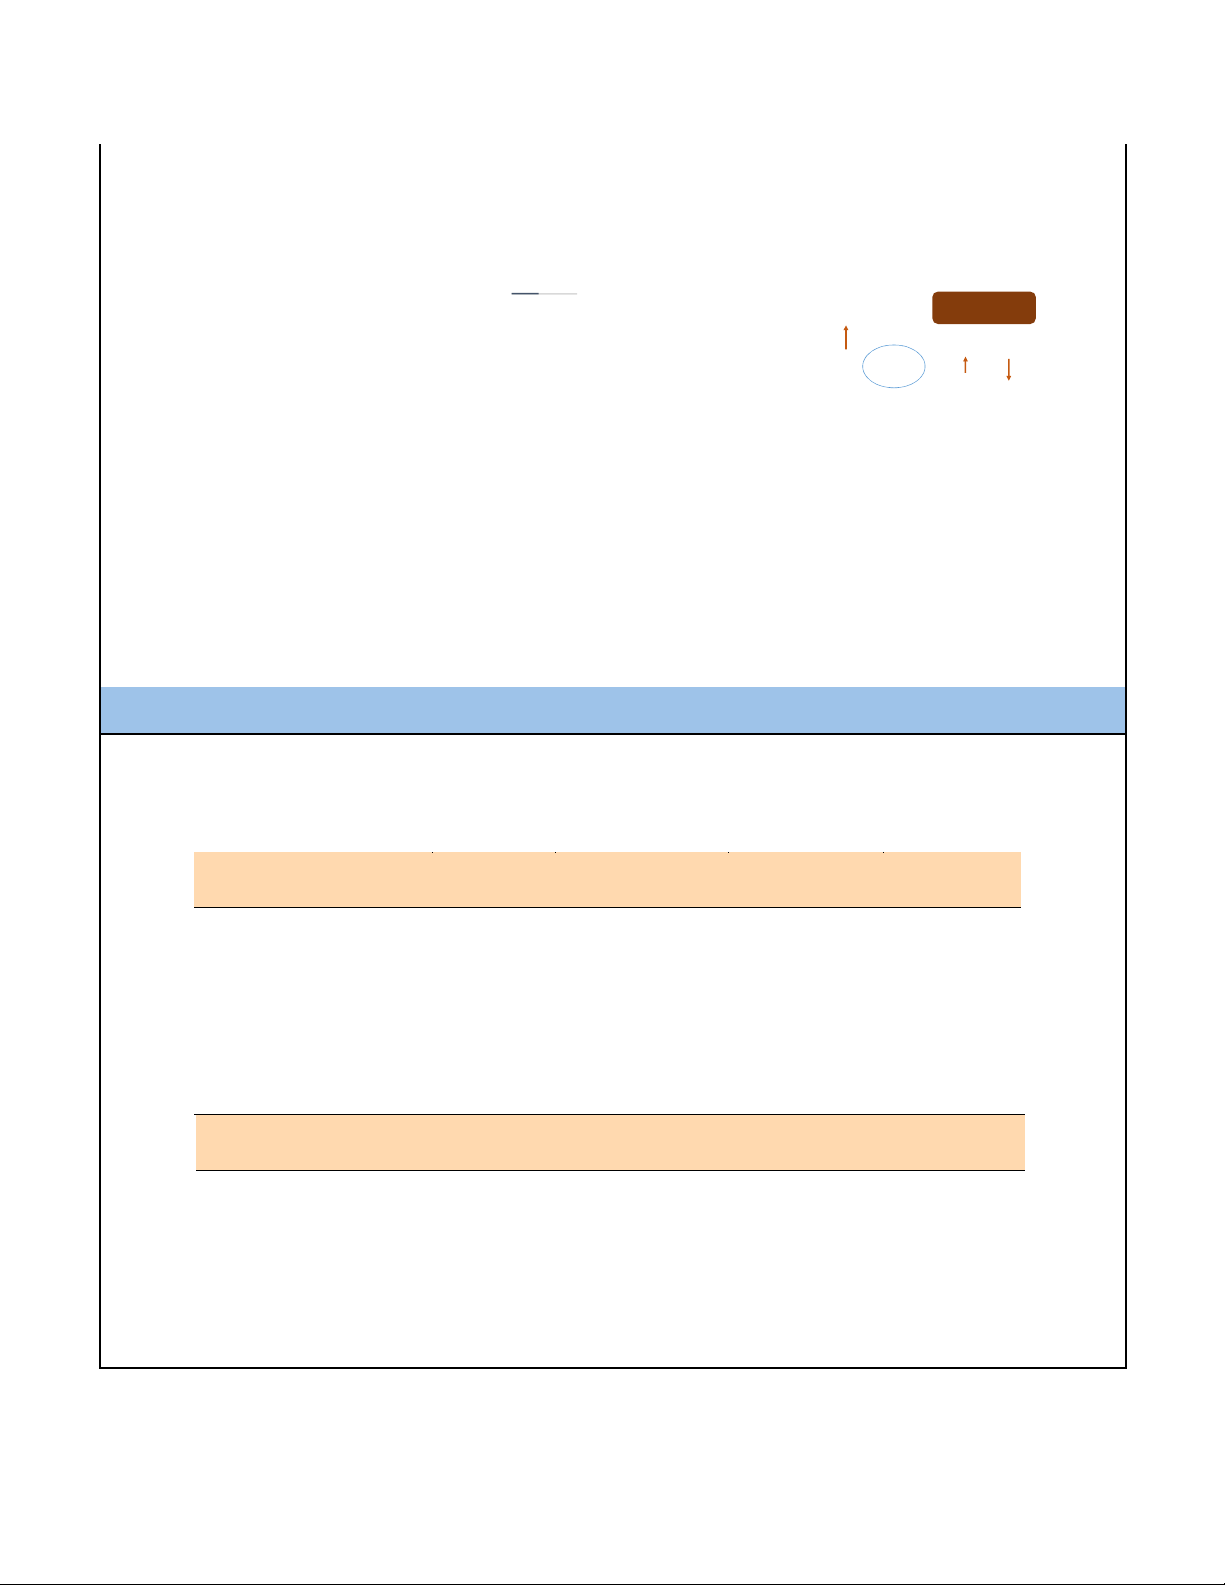
*Tangible fixed assets growth rate 9% 2.93% 363% 17% lOMoAR cPSD| 59085392 9/27/2022 Leverage (capital structure) lOMoAR cPSD| 59085392 9/27/2022 lOMoAR cPSD| 59085392 9/27/2022 lOMoAR cPSD| 59085392 9/27/2022 EQUITY EQUITY EQUITY EQUITY PROFITABILITY lOMoAR cPSD| 59085392 9/27/2022 Analysis of LEVERAGE Profitable if:
Cost of capital < rate of return Kd + Ke < Re
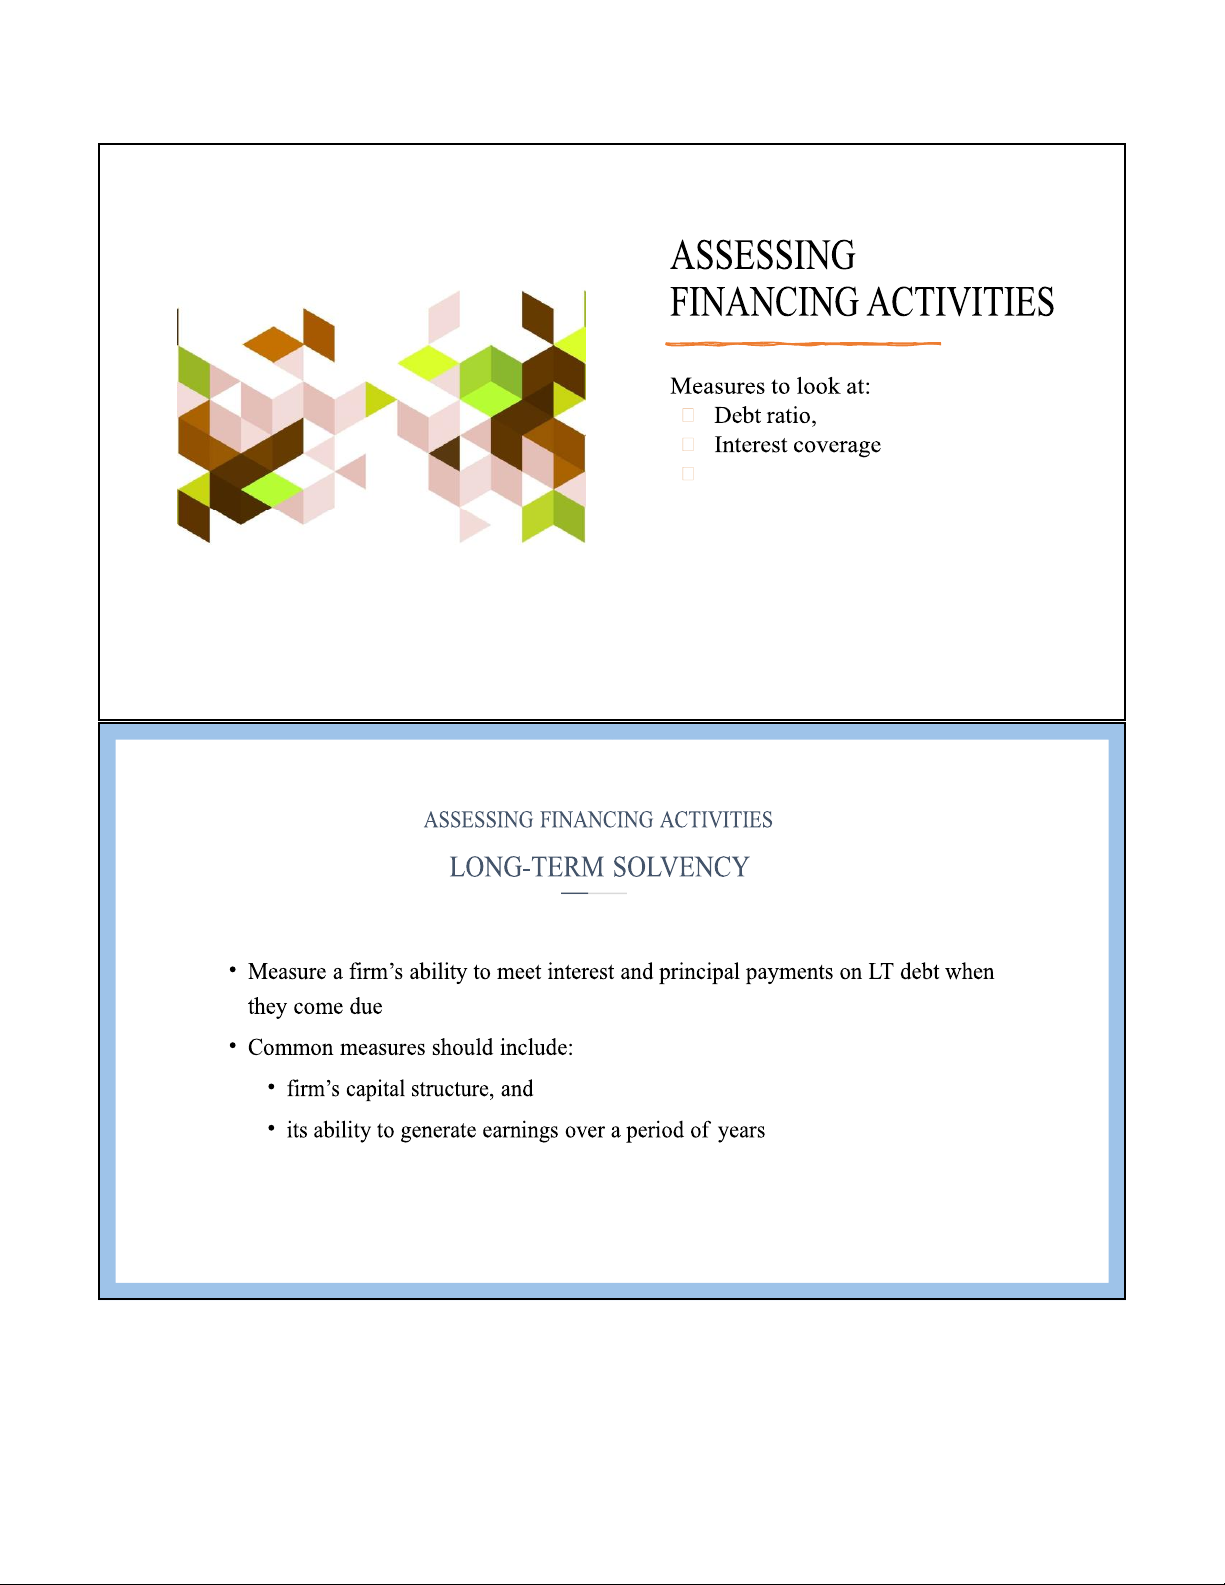
• Leverage shows the extent to which firm relies on debt financing in its capital structure
• Since cost of debt is typically less than cost of equity, it is optimal for firm to
use some debt in their capital structure to take advantage of leverage tax shield + less risk
+ without losing control over BOD lOMoAR cPSD| 59085392 9/27/2022 Analysis of LEVERAGE Profitable if: default
Cost of capital < rate of return Kd + Ke < Re
• Given that increases in financial leverage increase ROE, why are all companies not 100% debt financed?
• The answer is that: debt is risky
• Increased risk increases the expected return investors require to provide capital to the firm
• Higher financial leverage also results in a higher interest rate on the company’s debt
• S&P’s and Moody’s ratings partly determine the debt’s interest rate: lower quality ratings yield higher interest rates.
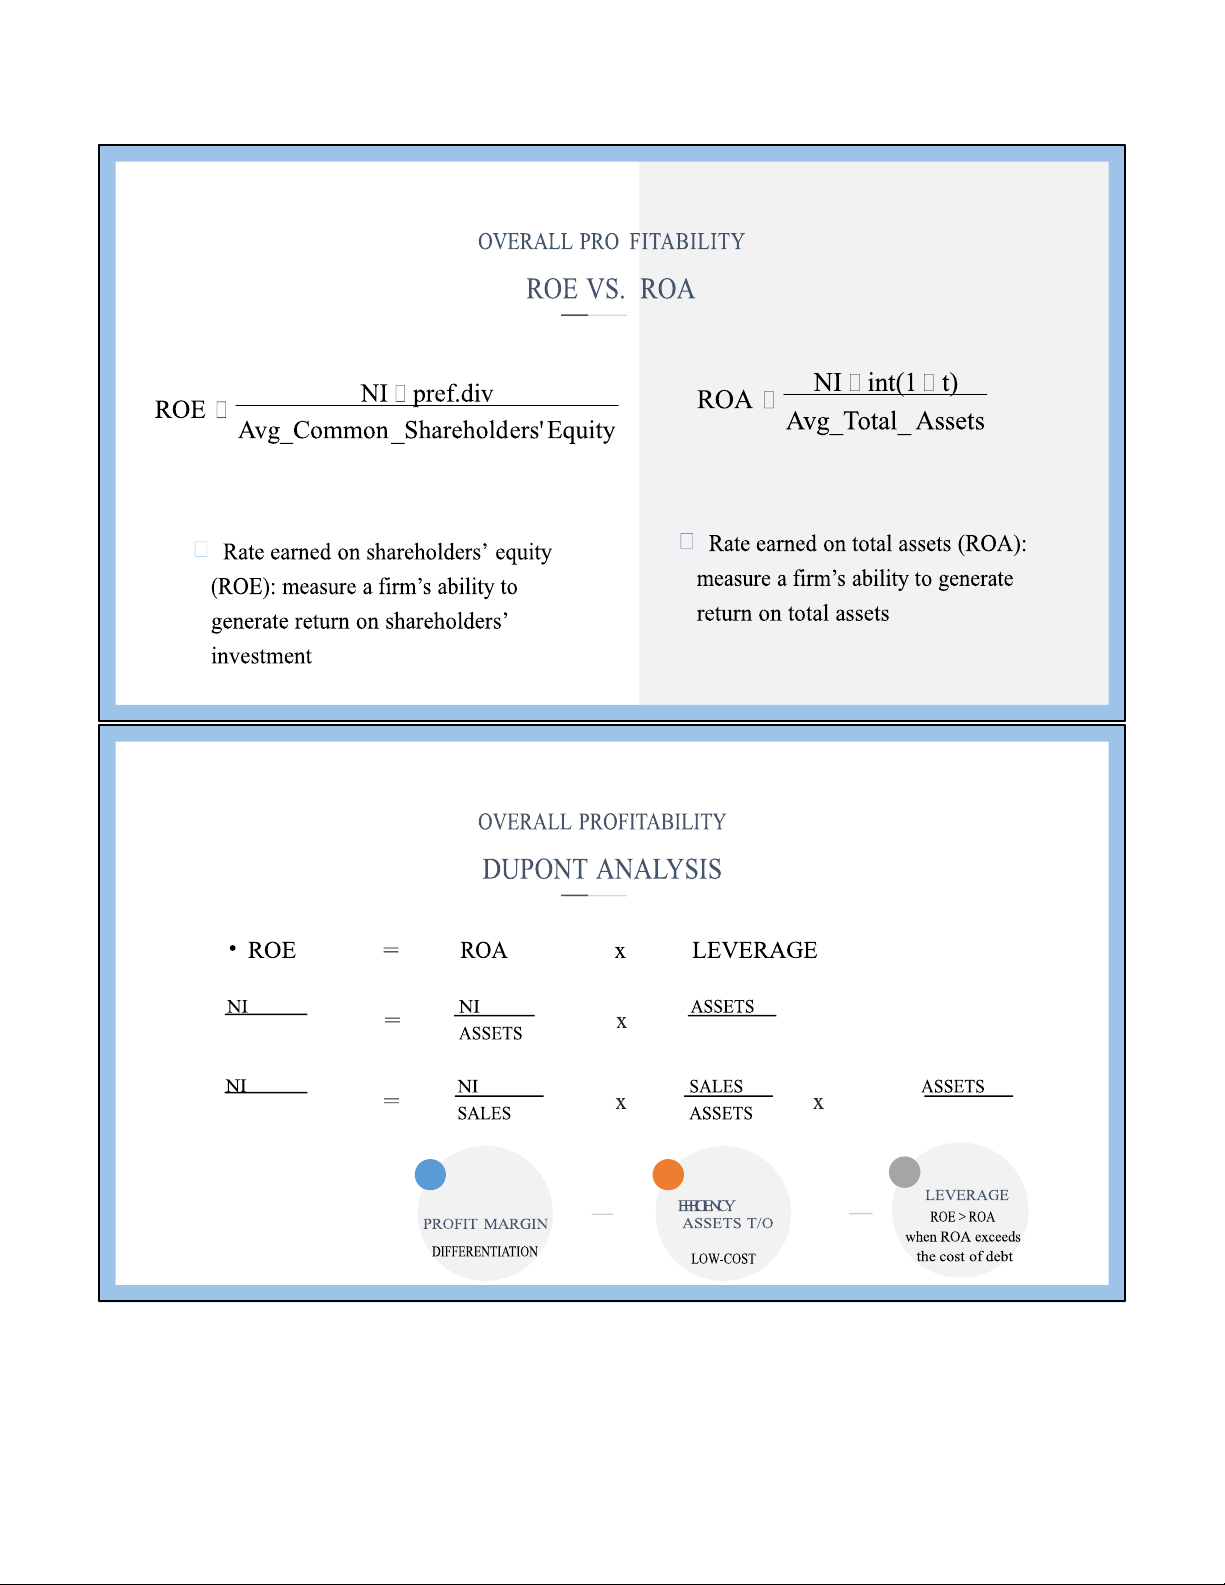
• If all else equal, higher financial leverage lowers a company’s debt rating and increases the interest rate it must pay Using of DUPONT IDENTITY
Table. The DUPONT breakdown for Vietnam Airline (HVN) and Vietjet Air (VJC) ROE = Profit margin Asset turnover Equity Multiplier HVN 2016 0.1296 0.0300 0.7265 5.9392 2017 0.1525 0.0321 0.9368 5.0795 2018 0.1392 0.0268 1.1750 4.4124 2019 0.1364 0.0258 1.2848 4.1088 ROE = Profit margin Asset turnover Equity Multiplier VJC 2016 0.5272 0.0908 1.3707 4.2380 2017 0.4789 0.1199 1.3362 2.9883 2018 0.3800 0.0996 1.3707 2.7842 2019 0.2555 0.0752 1.0357 3.2785 lOMoAR cPSD| 59085392 9/27/2022
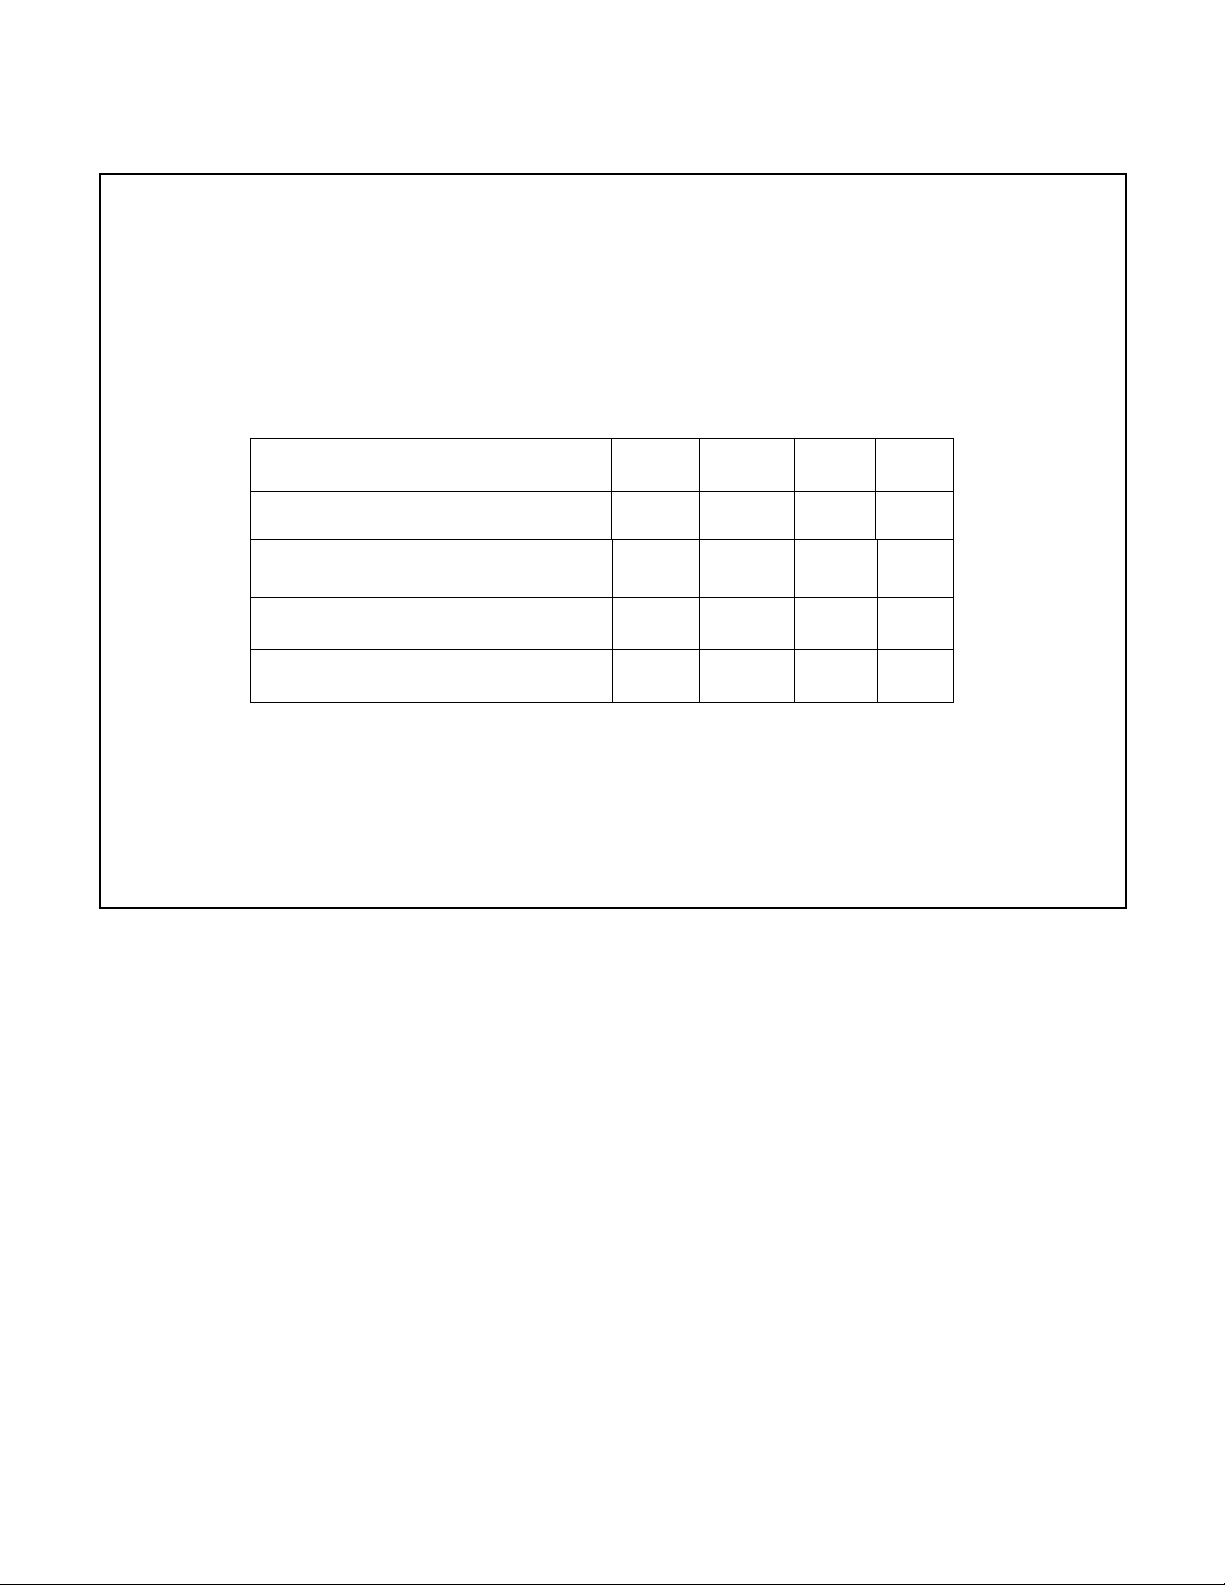
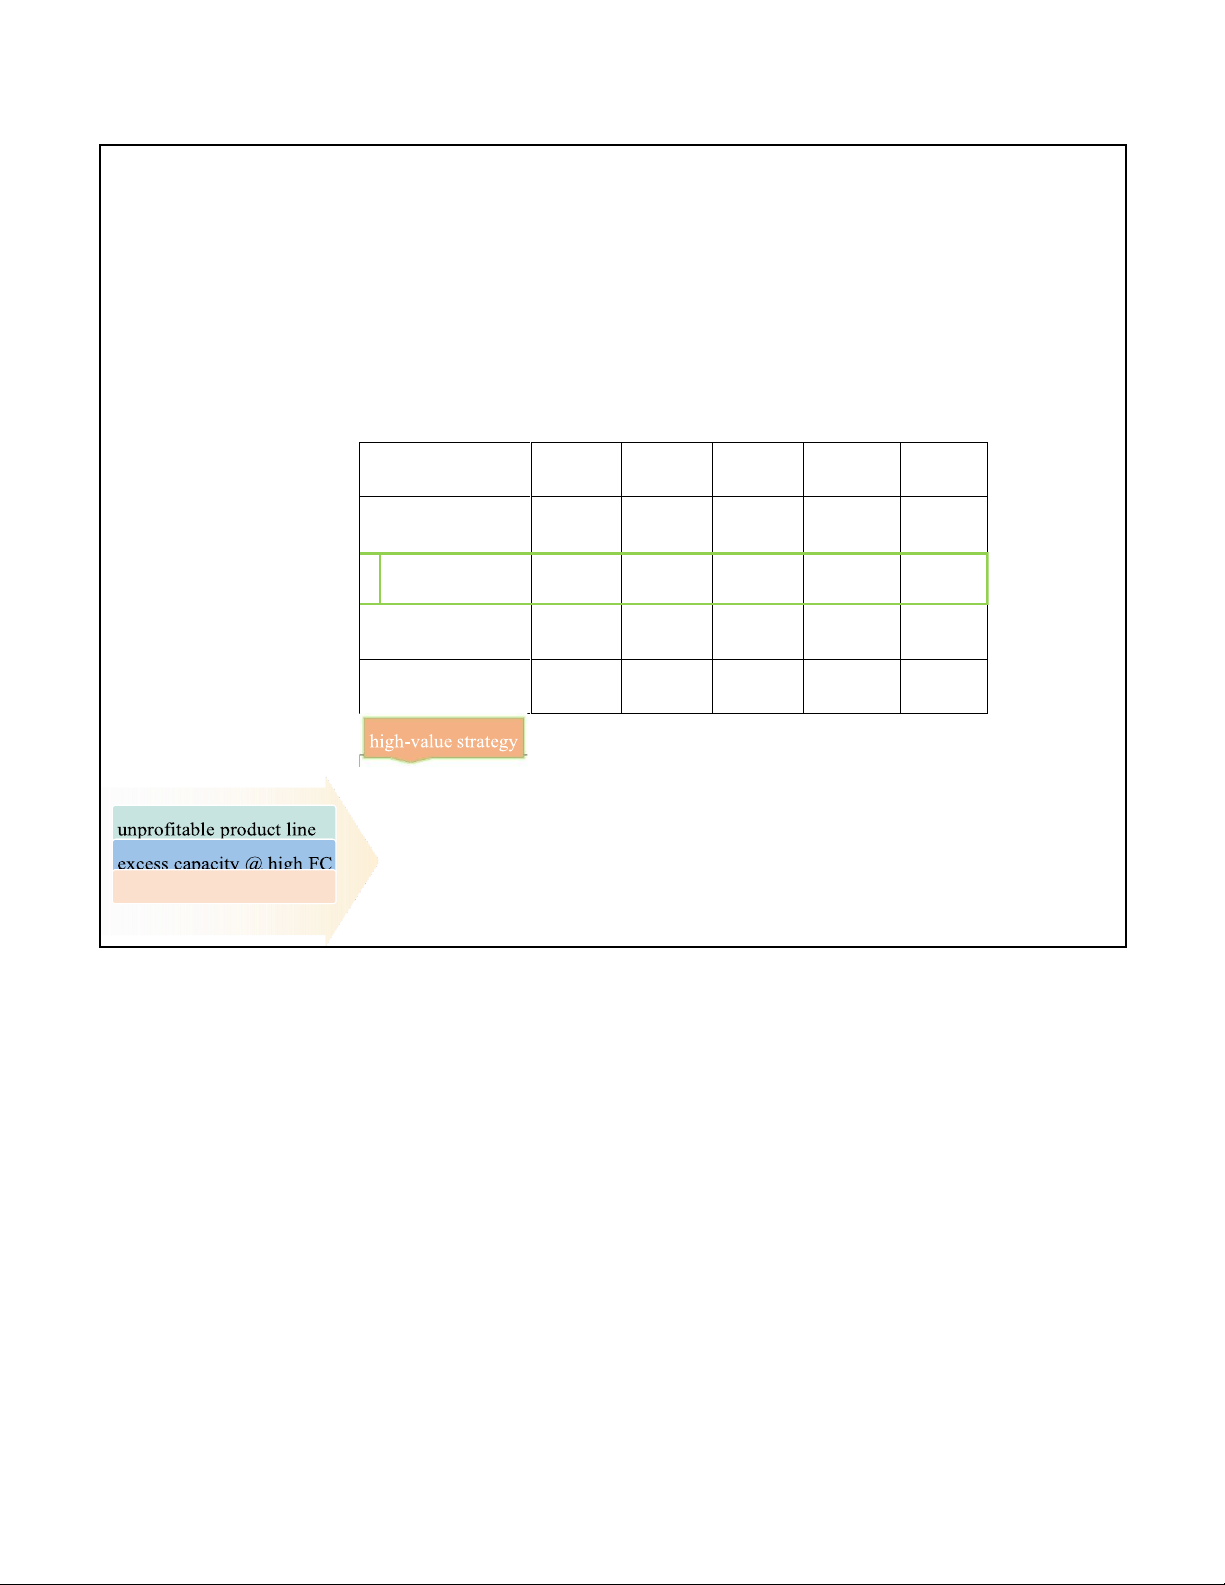
• E.g. Saigon General Service Corp. (HOSE: SVC) is a retail trading company in
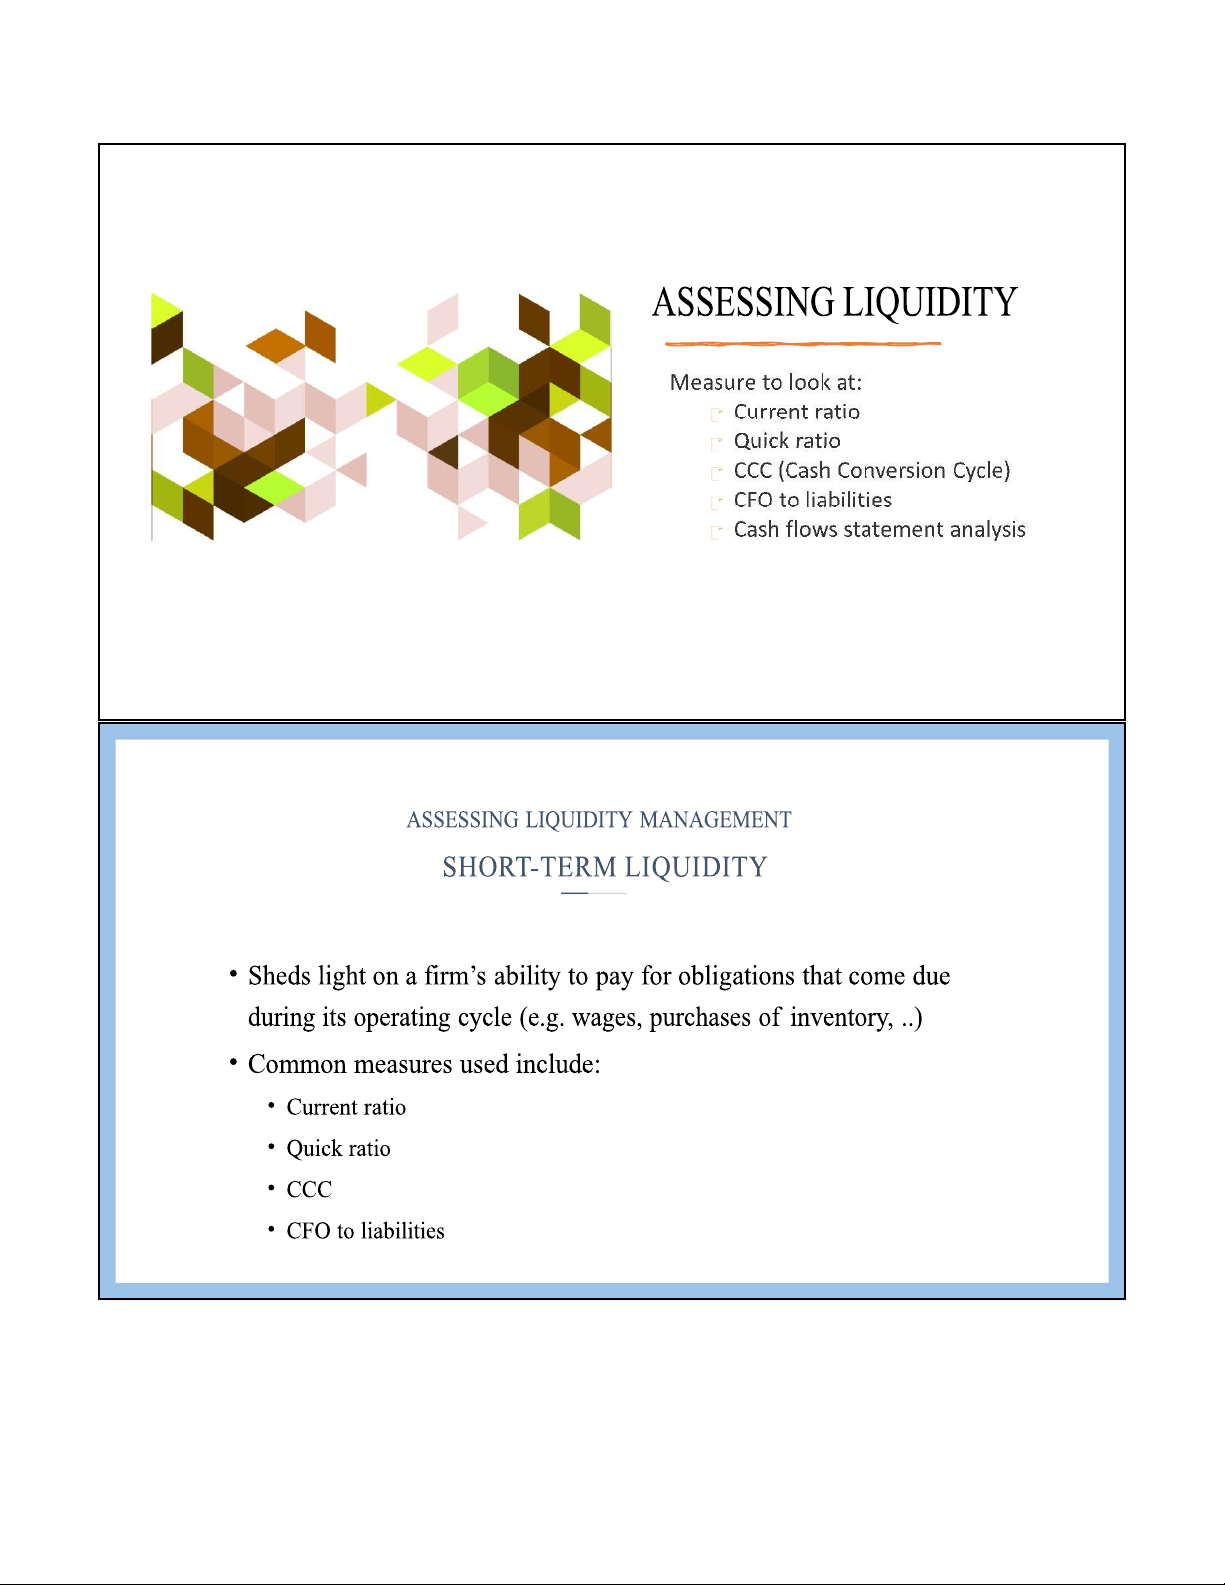
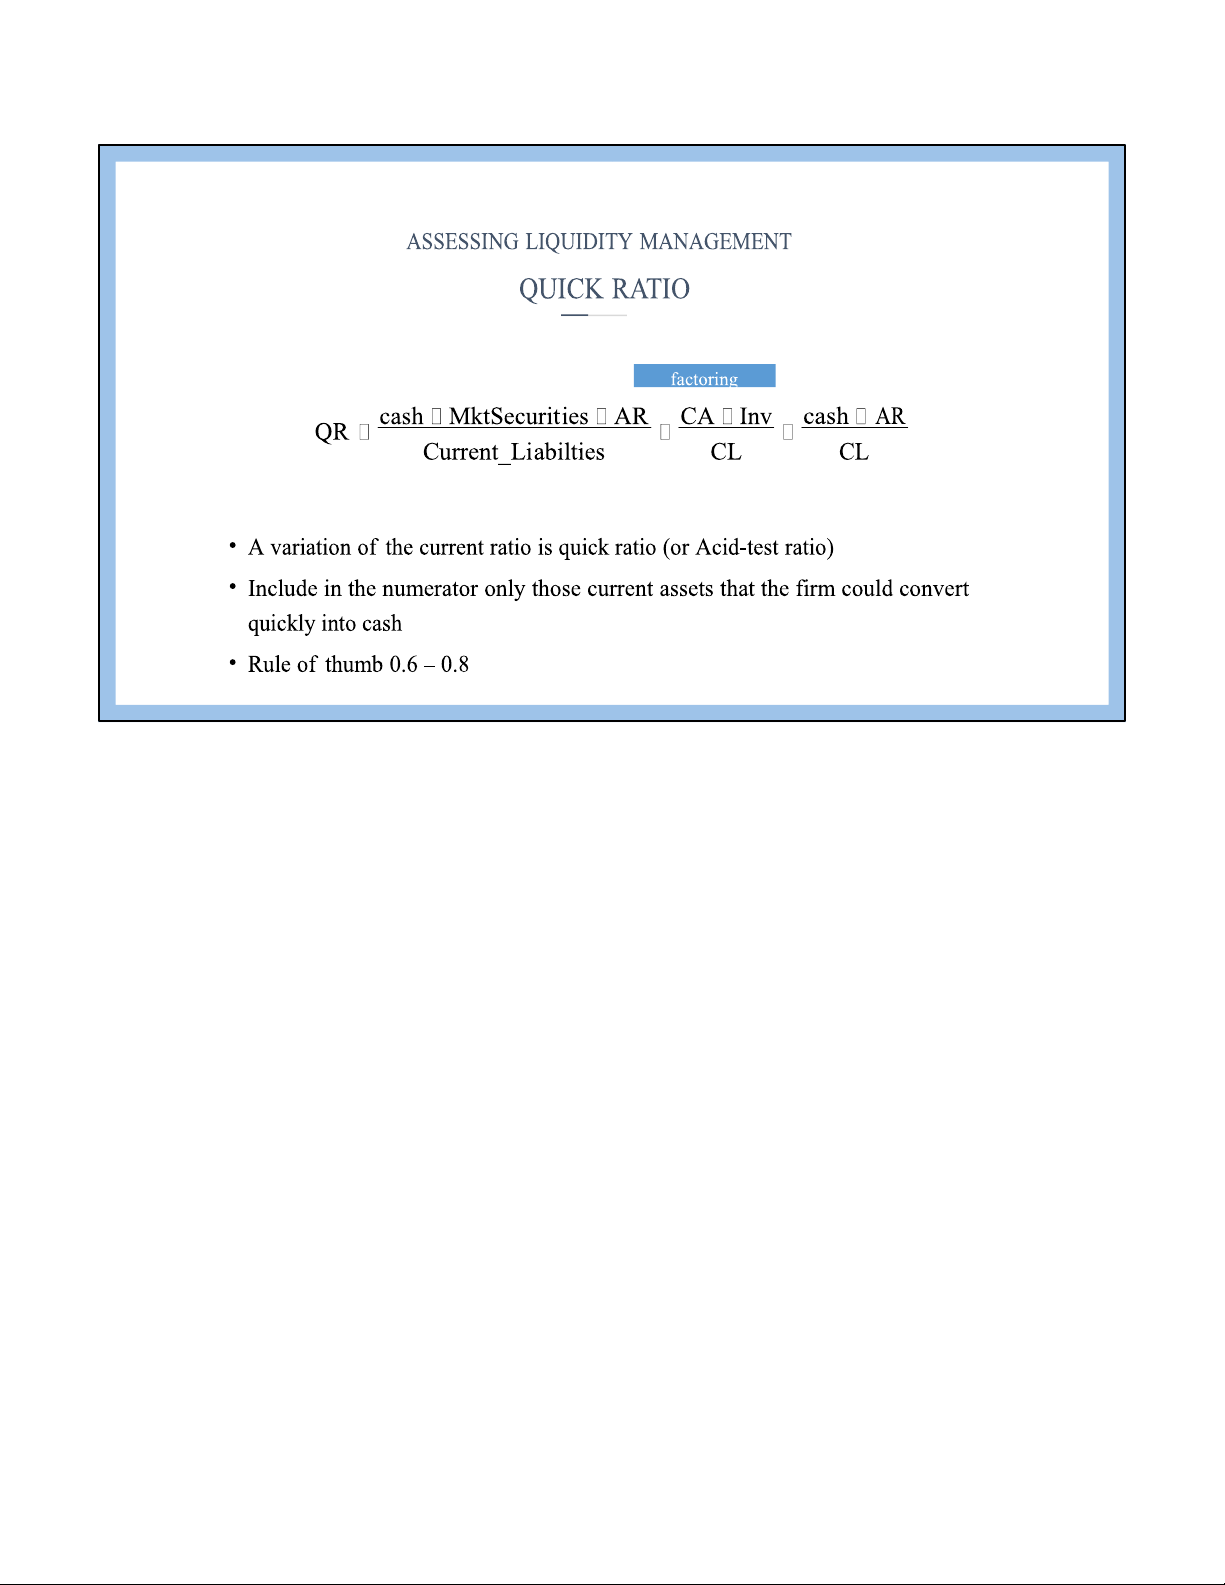
automobile and real estate. What strategy do you expect SVC to follow? 2009 2010 2011 2012 2013 * ROE 14% 12% 11% 6% 8% * Net margin 3.2% 2.1% 1.3% 0.8% 0.9% * Asset T/O 1.72 1.77 2.26 1.99 2.35 * Leverage 2.54 3.22 3.68 3.7 3.78 excess SG&A lOMoAR cPSD| 59085392 9/27/2022 lOMoAR cPSD| 59085392 9/27/2022 ASSESSING LIQUIDITY MANAGEMENT CURRENT RATIO
Note: the analysis of CR should be Current_Assets based on: CR Type of business Current_Liabilities Components of CA and T/Os
The level of CFO (predictable?)
• This ratio matches the amount of cash and other current assets that will become cash
within one year against the obligations that come due in the next year.
• Generally, firms prefer a higher current ratio
• However, an excessively high current ratio indicates inefficient asset use. lOMoAR cPSD| 59085392 9/27/2022
• E.g. Pomina Steel (HOSE: POM), a Vietnamese steel-maker. The current ratio of the
company are as follow. What can you say about the liquidity of the company? 2018 2019 2020 2021 * Current ratio 1.05 1.01 0.94 0.93 * Quick ratio 0.49 0.39 0.39 0.27 lOMoAR cPSD| 59085392 9/27/2022
Tài liệu liên quan:
-
Emerging from Turbulence - Analysis & Recommendations (2023) | Môn Business Analysis and Valuation - Trường Đại học Quốc tế, Đại học Quốc gia Thành phố Hồ Chí Minh
107 54 -
Economic & Demographic Changes: Impact of Globalization & Policy | Môn Business Analysis and Valuation - Trường Đại học Quốc tế, Đại học Quốc gia Thành phố Hồ Chí Minh
99 50 -
Lecture 2: Strategic Analysis on Market Structure & Competition (2024) | Môn Business Analysis and Valuation - Trường Đại học Quốc tế, Đại học Quốc gia Thành phố Hồ Chí Minh
103 52 -
Lecture 1: Introduction to Business Valuation (2024-2025) | Môn Business Analysis and Valuation - Trường Đại học Quốc tế, Đại học Quốc gia Thành phố Hồ Chí Minh
98 49