Financial Accounting, 8th Edition: Solutions Manual Overview
Financial Accounting, 8th Edition: Solutions Manual Overview
Môn: Maketting căn bản (mktcb) 132 tài liệu
Trường: Trường Đại học Thương Mại 3 K tài liệu
Tác giả:


Preview text:
Financial Accounting Tools for Business Decision Making 8th Edition
Solutions Manual Kimmel Weygandt Kieso
https://testbankarea.com/download/financial-accounting-tools-business-decision-
making-8th-edition-solutions-manual-kimmel-weygandt-kieso/
TEST BANK for Financial Accounting Tools for Business Decision Making
8th Edition by Paul D. Kimmel
https://testbankarea.com/download/financial-accounting-tools-business-decision-
making-8th-edition-test-bank-kimmel-weygandt-kieso/ CHAPTER 2
A Further Look at Financial Statements Learning Objectives 1.
Identify the sections of a classified balance sheet. 2.
Use ratios to evaluate a company’s profitability, liquidity, and solvency. 3.
Discuss financial reporting concepts.
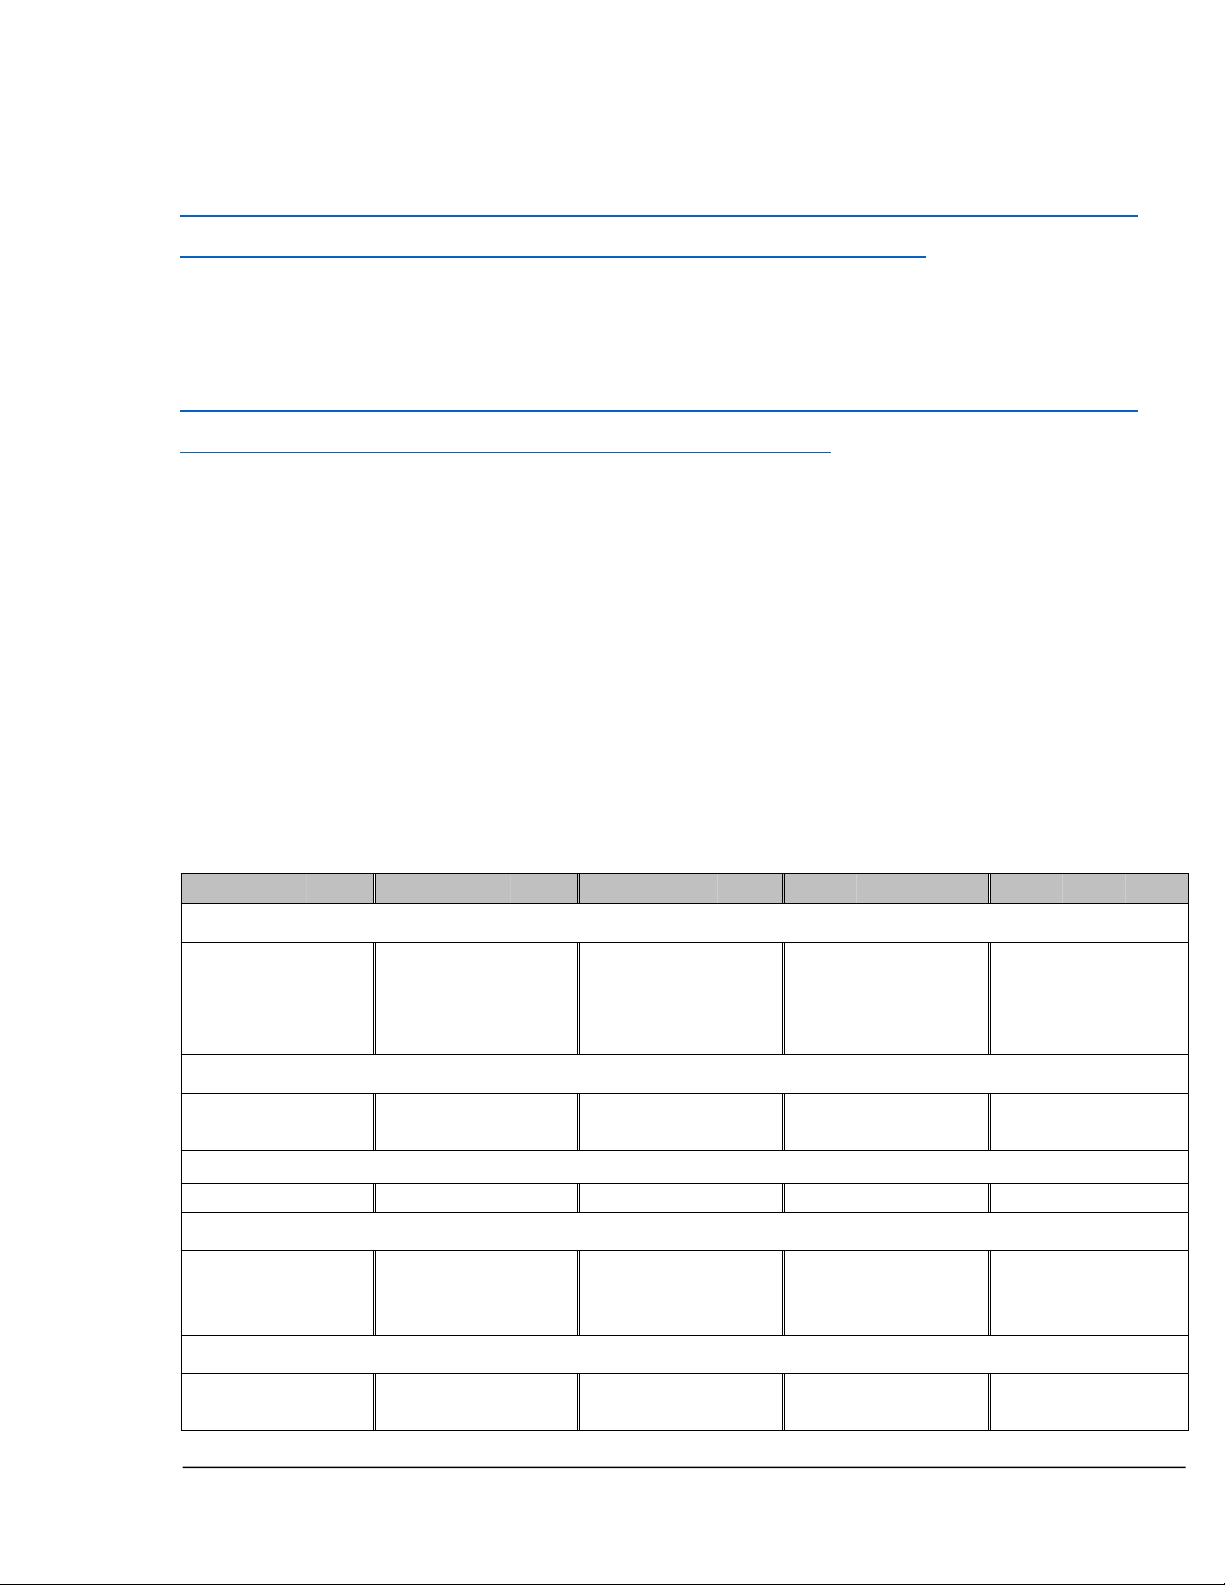
Summary of Questions by Learning Objectives and Bloom’s Taxonomy Item LO BT Item LO BT Item LO BT Item LO BT Item LO BT Questions 1. 1 K 5. 1 K 9. 2 C 13. 3 K 17. 3 C 2. 1 K 6. 2 C 10. 2 K 14. 3 C 18. 3 C 3. 1 C 7. 2 K 11. 2 C 15. 3 C 19. 3 C 4. 1 C 8. 2 C 12. 3 K 16. 3 C 20. 1 C Brief Exercises 1. 1 K 3. 2 AP 5. 2 AP 7. 3 K 9. 3 K 2. 1 AP 4. 2 AP 6. 3 K 8. 3 K 10. 3 K Do It! Exercises 1a. 1 AP 1b. 1 AP 2. 2 AP 3. 3 K Exercises 1. 1 AP 4. 1 AP 7. 2 AP 10. 2 AP 12. 3 K 2. 1 AP 5. 1 AP 8. 1, 2 AP 11. 2 AP 13. 3 C 3. 1 AP 6. 1 AP 9. 2 AP Problems: Set A 1. 1 AP 3. 1 AP 5. 2 AP 7. 2 AP 2. 1 AP 4. 2 AN 6. 2 AP 8. 3 E
Kimmel, Financial Accounting, 8/e, Solutions Manual (For Instructor Use Only) 2-1
ASSIGNMENT CHARACTERISTICS TABLE Problem Difficulty Time Number Description Level Al otted (min.) 1A
Prepare a classified balance sheet. Simple 10–20 2A Prepare financial statements. Moderate 20–30 3A Prepare financial statements. Moderate 20–30 4A
Compute ratios; comment on relative profitability, Moderate 20–30 liquidity, and solvency. 5A
Compute and interpret liquidity, solvency, and profitability Simple 10–20 ratios. 6A
Compute and interpret liquidity, solvency, and profit- Moderate 15–25 ability ratios. 7A
Compute ratios and compare liquidity, solvency, and Moderate 15–25
profitability for two companies. 8A
Comment on the objectives and qualitative characteristics Simple 10–20 of financial reporting. 2-2
Kimmel, Financial Accounting, 8/e, Solutions Manual (For Instructor Use Only) ANSWERS TO QUESTIONS
1. A company’s operating cycle is the average time that is required to go from cash to cash in prod- ucing revenue.
LO 1 BT: K Diff: E TOT: 1 min. AACSB: None AICPA FC: Measurement
2. Current assets are assets that a company expects to convert to cash or use up within one year of
the balance sheet date or the company’s operating cycle, whichever is longer. Current assets are
listed in the order in which they are expected to be converted into cash.
LO 1 BT: K Diff: E TOT: 1 min. AACSB: None AICPA FC: Reporting
3. Long-term investments are investments in stocks and bonds of other companies where the
conversion into cash is not expected within one year or the operating cycle, whichever is longer
and plant assets not currently in operational use. Property, plant, and equipment are tangible
resources of a relatively permanent nature that are being used in the business and not intended for sale.
LO 1 BT: C Diff: M TOT: 2 min. AACSB: None AICPA FC: Reporting
4. Current liabilities are obligations that wil be paid within the coming year or operating cycle,
whichever is longer. Long-term liabilities are obligations that wil be paid after one year.
LO 1 BT: C Diff: M TOT: 1 min. AACSB: None AICPA FC: Reporting
5. The two parts of stockholders’ equity and the purpose of each are: (1) Common stock is used to
record investments of assets in the business by the owners (stockholders). (2) Retained earnings
is used to record net income retained in the business.
LO 1 BT: K Diff: M TOT: 2 min. AACSB: None AICPA FC: Reporting
6. (a) Geena is not correct. There are three characteristics: liquidity, profitability, and solvency.
(b) The three parties are not primarily interested in the same characteristics of a company.
Short-term creditors are primarily interested in the liquidity of the company. In contrast,
long-term creditors and stockholders are primarily interested in the profitability and solvency of the company.
LO 2 BT: C Diff: M TOT: 3 min. AACSB: None AICPA FC: Reporting
7. (a) Liquidity ratios: Working capital and current ratio.
(b) Solvency ratios: Debt to assets and free cash flow.
(c) Profitability ratio: Earnings per share.
LO 2 BT: K Diff: E TOT: 2 min. AACSB: None AICPA FC: Reporting
Kimmel, Financial Accounting, 8/e, Solutions Manual (For Instructor Use Only) 2-3
8. Debt financing is riskier than equity financing because debt must be repaid at specific points in
time, whether the company is performing wel or not. Thus, the higher the percentage of assets
financed by debt, the riskier the company.
LO 2 BT: C Diff: E TOT: 2 min. AACSB: None AICPA FC: Reporting
9. (a) Liquidity ratios measure the short-term ability of the company to pay its maturing obligations
and to meet unexpected needs for cash.
(b) Profitability ratios measure the income or operating success of a company for a given period of time.
(c) Solvency ratios measure the company’s ability to survive over a long period of time.
LO 2 BT: K Diff: E TOT: 2 min. AACSB: None AICPA FC: Reporting
10. (a) The increase in earnings per share is good news because it means that profitability has improved.
(b) An increase in the current ratio signals good news because the company improved its ability
to meet maturing short-term obligations.
(c) The increase in the debt to assets ratio is bad news because it means that the company has
increased its obligations to creditors and has lowered its equity “buffer.”
(d) A decrease in free cash flow is bad news because it means that the company has become
less solvent. The higher the free cash flow, the more solvent the company.
LO 2 BT: AN Diff: M TOT: 3 min. AACSB: Analytic AICPA FC: Reporting
11. (a) The debt to assets ratio and free cash flow indicate the company’s ability to repay the face
value of the debt at maturity and make periodic interest payments.
(b) The current ratio and working capital indicate a company’s liquidity and short-term debt- paying ability.
(c) Earnings per share indicates the earning power (profitability) of an investment.
LO 2 BT: C Diff: M TOT: 3 min. AACSB: Analytic AICPA FC: Reporting
12. (a) General y accepted accounting principles (GAAP) are a set of rules and practices, having
substantial support, that are recognized as a general guide for financial reporting purposes.
(b) The body that provides authoritative support for GAAP is the Financial Accounting Standards Board (FASB).
LO 3 BT: K Diff: E TOT: 2 min. AACSB: None AICPA FC: Measurement
13. (a) The primary objective of financial reporting is to provide information useful for decision making.
(b) The fundamental qualitative characteristics are relevance and faithful representation. The
enhancing qualities are comparability, consistency, verifiability, timeliness, and understandability. 2-4
Kimmel, Financial Accounting, 8/e, Solutions Manual (For Instructor Use Only)
LO 3 BT: K Diff: M TOT: 2 min. AACSB: None AICPA FC: Measurement
14. Dietz is correct. Consistency means using the same accounting principles and accounting
methods from period to period within a company. Without consistency in the application of
accounting principles, it is difficult to determine whether a company is better off, worse off, or the same from period to period.
LO 3 BT: AN Diff: M TOT: 2 min. AACSB: Analytic AICPA FC: Measurement and Reporting
15. Comparability results when different companies use the same accounting principles. Consistency
means using the same accounting principles and methods from year to year within the same company.
LO 3 BT: C Diff: E TOT: 1 min. AACSB: None AICPA FC: Measurement
16. The cost constraint al ows accounting standard-setters to weigh the cost that companies wil incur
to provide information against the benefit that financial statement users wil gain from having the information available.
LO 3 BT: K Diff: E TOT: 1 min. AACSB: None AICPA FC: Measurement
17. Accounting standards are not uniform because individual countries have separate standard-
setting bodies. Currently many non-U.S. countries are choosing to adopt International Financial
Reporting Standards (IFRS). It appears that accounting standards in the United States wil move toward compliance with IFRS.
LO 3 BT: C Diff: M TOT: 2 min. AACSB: None AICPA FC: Measurement
18. Accounting relies primarily on two measurement principles. Fair value is sometimes used when
market price information is readily available. However, in many situations reliable market price
information is not available. In these instances, accounting relies on historical cost as its basis.
19. The economic entity assumption states that every economic entity can be separately identified and
accounted for. This assumption requires that the activities of the entity be kept separate and distinct
from (1) the activities of its owners (the shareholders) and (2) al other economic entities. A
shareholder of a company charging personal living costs as expenses of the company is an
example of a violation of the economic entity assumption.
20. At September 27, 2014 Apple’s largest current asset was Cash and cash equivalents of $14,557
mil ion, its largest current liability is Accounts payable of $16,459 mil ion and its largest item
under “Assets” was Property and equipment, net of $16,967 mil ion.
Kimmel, Financial Accounting, 8/e, Solutions Manual (For Instructor Use Only) 2-5
SOLUTIONS TO BRIEF EXERCISES BRIEF EXERCISE 2-1 CL Accounts payable CL Income taxes payable CA Accounts receivable
LTI Investment in long-term bonds
PPE Accumulated depreciation PPE Land PPE Buildings CA Inventory CA Cash IA Patent IA Goodwil CA Supplies
LO 1 BT: K Difficulty: Easy TOT: 2 min. AACSB: None AICPA FC: Reporting BRIEF EXERCISE 2-2 CHIN COMPANY Partial Balance Sheet Current assets
Cash. . . . . . . . . . . . . . . . . . . . . . . . . . . . . . . . . . . . . . . . . . . . . $10,400
Debt investments. . . . . . . . . . . . . . . . . . . . . . . . . . . . . . . . . . 8,200
Accounts receivable. . . . . . . . . . . . . . . . . . . . . . . . . . . . . . . . 14,000
Supplies. . . . . . . . . . . . . . . . . . . . . . . . . . . . . . . . . . . . . . . . . . 3,800
Prepaid insurance. . . . . . . . . . . . . . . . . . . . . . . . . . . . . . . . . . 2,600
Total current assets . . . . . . . . . . . . . . . . . . . . . . . . . . . . $39,000
LO 1 BT: AP Difficulty: Medium TOT: 3 min. AACSB: Analytic AICPA FC: Reporting BRIEF EXERCISE 2-3
Earnings per share = Net income —Preferred dividends
Average common shares outstanding = $220 mil ion – $0
333mil ionshares = $.66 per share
LO 2 BT: AP Difficulty: Easy TOT: 2 min. AACSB: Analytic AICPA FC: Reporting 2-6
Kimmel, Financial Accounting, 8/e, Solutions Manual (For Instructor Use Only) BRIEF EXERCISE 2-4
Working capital = Current assets – Current liabilities Current assets $102,500,000 Current liabilities 201,200,000 Working capital ($ 98,700,000) Current ratio:
Current assets = $102,500,000 Current liabilities $201,200,000 = .51:1
LO 2 BT: AP Difficulty: Easy TOT: 3 min. AACSB: Analytic AICPA FC: Reporting BRIEF EXERCISE 2-5 (a) Current ratio $262,787 = 0.89:1 Current assets $293,625 Current liabilities (b) Debt to assets $376,002 = 85.5% Total liabilities $439,832 Total assets (c) Free cash flow
$62,300 – $24,787 – $12,000 = $25,513 (Net cash provided
operating activities –
capital expenditures – dividends paid)
LO 2 BT: AP Difficulty: Easy TOT: 3 min. AACSB: Analytic AICPA FC: Reporting BRIEF EXERCISE 2-6 (a) True. (b) False.
LO 3 BT: K Difficulty: Easy TOT: 2 min. AACSB: None AICPA FC: Measurement
Kimmel, Financial Accounting, 8/e, Solutions Manual (For Instructor Use Only) 2-7 BRIEF EXERCISE 2-7 (a) Predictive value. (b) Confirmatory value. (c) Materiality (d) Complete. (e) Free from error. (f) Comparability. (g) Verifiability. (h) Timeliness.
LO 3 BT: K Difficulty: Easy TOT: 3 min. AACSB: None AICPA FC: Measurement BRIEF EXERCISE 2-8 (a) Relevant.
(b) Faithful representation. (c) Consistency.
LO 3 BT: K Difficulty: Easy TOT: 2 min. AACSB: None AICPA FC: Measurement BRIEF EXERCISE 2-9
(a) 1. Predictive value. (b) 2. Neutral. (c) 3. Verifiable. (d) 4. Timely.
LO 3 BT: K Difficulty: Easy TOT: 2 min. AACSB: None AICPA FC: Measurement BRIEF EXERCISE 2-10 (c)
LO 3 BT: K Difficulty: Easy TOT: 1 min. AACSB: None AICPA FC: Measurement 2-8
Kimmel, Financial Accounting, 8/e, Solutions Manual (For Instructor Use Only)
SOLUTIONS TO DO IT! EXERCISES DO IT! 2-1a MYLAR CORPORATION Balance Sheet (partial) December 31, 2017 Assets Current assets
Cash . . . . . . . . . . . . . . . . . . . . . . . . . . . . . . . . . $ 13,000
Accounts receivable . . . . . . . . . . . . . . . . . . . . 22,000
Inventory. . . . . . . . . . . . . . . . . . . . . . . . . . . . . . 58,000
Supplies . . . . . . . . . . . . . . . . . . . . . . . . . . . . . . 7,000
Total current assets. . . . . . . . . . . . . . . . $100,000
Property, plant, and equipment
Equipment. . . . . . . . . . . . . . . . . . . . . . . . . . . . . 180,000
Less: Accumulated depreciation—
equipment. . . . . . . . . . . . . . . . . . . . . . . 50,000 130,000
Total assets . . . . . . . . . . . . . . . . . . . . . . . . . . . . . . . $230,000
LO 1 BT: AP Difficulty: Medium TOT: 5 min. AACSB: Analytic AICPA FC: Reporting DO IT! 2-1b IA Trademarks CA Inventory
CL Notes payable (current)
PPE Accumulated depreciation NA Interest revenue PPE Land CL Income taxes payable SE Common stock
LTI Debt investments (long-term) NA Advertising expense
CL Unearned sales revenue
LTL Mortgage payable (due in 3 years)
LO 1 BT: AP Difficulty: Easy TOT: 3 min. AACSB: Analytic AICPA FC: Reporting
Kimmel, Financial Accounting, 8/e, Solutions Manual (For InstructorUse Only) 2-9 DO IT! 2-2 (a) 2017 2016
($80,000 – $6,000) = $1.29
($40,000 – $6,000) = $0.97 (40,000 + 75,000)/2 (30,000 + 40,000)/2
Nguoi’s profitability, as measured by the amount of income available for
each share of common stock, increased by 33 percent (($1.29 –
$0.97)/$0.97) during 2017. Earnings per share should not be compared
across companies because the number of shares issued by companies
varies widely. Thus, we cannot conclude that Nguoi Corporation is
more profitable than Matisse Corporation based on its higher EPS in 2017.
Net Income Preferred Dividends
Average Common Shares Outstanding (b) 2017 2016 Current ratio $54,000 = 2.45:1 $36,000 = 1.20:1 $22,000 $30,000 Current assets Current liabilities Debt to $72,000 assets ratio = 30% $100,000 = 49% $240,000 $205,000 Totalliabilities Total assets
The company’s liquidity, as measured by the current ratio improved
from 1.20:1 to 2.45:1. Its solvency also improved, because the debt to
assets ratio declined from 49% to 30%.
(c) Free cash flow 2017: $90,000 –$6,000 – $3,000 –$27,000= $54,000
2016: $56,000 – $6,000 – $1,500 – $12,000 = $36,500
The amount of cash generated by the company above its needs for
dividends and capital expenditures increased from $36,500 to $54,000.
LO 1 BT: AP Difficulty: Easy TOT: 3 min. AACSB: Analytic AICPA FC: Reporting 2-10
Kimmel, Financial Accounting, 8/e, Solutions Manual (For Instructor Use Only) DO IT! 2-3
1. Monetary unit assumption
2. Faithful representation
3. Economic entity assumption 4. Cost constraint 5. Consistency
6. Historical cost principle 7. Relevance
8. Periodicity assumption
9. Ful disclosure principle 10. Materiality
11. Going concern assumption 12. Comparability
LO 2 BT: K Difficulty: Hard TOT: 10 min. AACSB: Analytic AICPA FC: Reporting
Kimmel, Financial Accounting, 8/e, Solutions Manual (For Instructor Use Only) 2-11 SOLUTIONS TO EXERCISES EXERCISE 2-1 CL Accounts payable CA Inventory CA Accounts receivable CA Stock investments
PPE Accumulated depreciation—equip. PPE Land (in use) PPE Buildings LTL Mortgage payable CA Cash CA Supplies CL Interest payable PPE Equipment IA Goodwil CA Prepaid rent CL Income taxes payable
LO 1 BT: AP Difficulty: Easy TOT: 3 min. AACSB: Analytic AICPA FC: Reporting EXERCISE 2-2 CA Prepaid advertising IA Patents PPE Equipment LTL Bonds payable IA Trademarks SE Common stock
CL Salaries and wages payable PPE Accumulated CL Income taxes payable
depreciation—equipment SE Retained earnings
CL Unearned sales revenue CA Accounts receivable CA Inventory
LTI Land (held for future use)
LO 1 BT: AP Difficulty: Easy TOT: 3 min. AACSB: Analytic AICPA FC: Reporting 2-12
Kimmel, Financial Accounting, 8/e, Solutions Manual (For Instructor Use Only) EXERCISE 2-3 THE BOEING COMPANY Partial Balance Sheet December 31, 2017 (in mil ions) Assets Current assets
Cash. . . . . . . . . . . . . . . . . . . . . . . . . . . . . . . . . . . . $ 9,215
Debt investments. . . . . . . . . . . . . . . . . . . . . . . . . 2,008
Accounts receivable. . . . . . . . . . . . . . . . . . . . . . . 5,785
Notes receivable . . . . . . . . . . . . . . . . . . . . . . . . . . 368
Inventory . . . . . . . . . . . . . . . . . . . . . . . . . . . . . . . . 16,933
Total current assets . . . . . . . . . . . . . . . . . . . $34,309 Long-term investments
Notes receivable . . . . . . . . . . . . . . . . . . . . . . . . . . 5,466
Property, plant, and equipment
Buildings . . . . . . . . . . . . . . . . . . . . . . . . . . . . . . . . 21,579
Less: Accumulated depreciation—buildings. . . 12,795 8,784 Intangible assets
Patents . . . . . . . . . . . . . . . . . . . . . . . . . . . . . . . . . 12,528
Total assets . . . . . . . . . . . . . . . . . . . . . . . . . . . . . . . . . $61,087
LO 1 BT: AP Difficulty: Medium TOT: 5 min. AACSB: Analytic AICPA FC: Reporting
Kimmel, Financial Accounting, 8/e, Solutions Manual (For Instructor Use Only) 2-13 EXERCISE 2-4 H. J. HEINZ COMPANY Partial Balance Sheet April 30, 2017 (in thousands) Assets Current assets
Cash. . . . . . . . . . . . . . . . . . . . . . . . . $ 373,145
Accounts receivable . . . . . . . . . . . . 1,171,797
Inventory. . . . . . . . . . . . . . . . . . . . . . 1,237,613
Prepaid insurance. . . . . . . . . . . . . . 125,765
Total current assets. . . . . . . . . $ 2,908,320
Property, plant, and equipment
Land . . . . . . . . . . . . . . . . . . . . . . . . . 76,193
Buildings. . . . . . . . . . . . . . . . . . . . . . $4,033,369
Less: Accumulated depreciation—
Buildings . . . . . . . . . . . . . . . . . 2,131,260 1,902,109 1,978,302 Intangible assets
Goodwil . . . . . . . . . . . . . . . . . . . . . . 3,982,954
Trademarks. . . . . . . . . . . . . . . . . . . . 757,907 4,740,861
Total assets. . . . . . . . . . . . . . . . . . . . . . . $ 9,627,483
LO 1 BT: AP Difficulty: Medium TOT: 5 min. AACSB: Analytic AICPA FC: Reporting 2-14
Kimmel, Financial Accounting, 8/e, Solutions Manual (For Instructor Use Only) EXERCISE 2-5 LONGHORN COMPANY Balance Sheet December 31, 2017 Assets Current assets
Cash. . . . . . . . . . . . . . . . . . . . . . . . . . . $11,840
Accounts receivable. . . . . . . . . . . . . . 12,600
Prepaid insurance. . . . . . . . . . . . . . . . 3,200
Total current assets . . . . . . . . . . . . . . . . . . $ 27,640
Property, plant, and equipment
Land. . . . . . . . . . . . . . . . . . . . . . . . . . . 61,200
Buildings . . . . . . . . . . . . . . . . . . . . . . . $105,800
Less: Accumulated depreciation—
buildings . . . . . . . . . . . . . . . . . 45,600 60,200
Equipment . . . . . . . . . . . . . . . . . . . . . . 82,400
Less: Accumulated depreciation—
equipment . . . . . . . . . . . . . . . . 18,720 63,680 185,080
Total assets . . . . . . . . . . . . . . . . . $212,720
Liabilities and Stockholders’ Equity Current liabilities
Accounts payable. . . . . . . . . . . . . . . . $ 9,500
Current maturity of note payable . . . . 13,600
Interest payable . . . . . . . . . . . . . . . . . 3,600
Total current liabilities . . . . . . . . $ 26,700 Long-term liabilities
Note payable ($93,600 – $13,600) . . . 80,000
Total liabilities . . . . . . . . . . . . . . . 106,700 Stockholders’ equity
Common stock. . . . . . . . . . . . . . . . . . 60,000 Retained earnings
($40,000 + $6,020*). . . . . . . . . . . . . . 46,020
Total stockholders’ equity. . . . . 106,020
Total liabilities and stockholders’
equity . . . . . . . . . . . . . . . . . . . . . . $212,720
*Net income = $14,700 – $780 – $5,300 – $2,600 = $6,020
(Assets = Liabilities + Stockholders’ Equity)
LO 1 BT: AP Difficulty: Medium TOT: 10 min. AACSB: Analytic AICPA FC: Reporting
Kimmel, Financial Accounting, 8/e, Solutions Manual (For Instructor Use Only) 2-15 EXERCISE 2-6 TEXAS INSTRUMENTS, INC. Balance Sheet December 31, 2017 (in mil ions) Assets Current assets
Cash . . . . . . . . . . . . . . . . . . . . . . . . . . . . . . . . . . . . . $ 1,182
Debt investments. . . . . . . . . . . . . . . . . . . . . . . . . . . 1,743
Accounts receivable . . . . . . . . . . . . . . . . . . . . . . . . 1,823
Inventory . . . . . . . . . . . . . . . . . . . . . . . . . . . . . . . . . 1,202
Prepaid rent. . . . . . . . . . . . . . . . . . . . . . . . . . . . . . . 164
Total current assets . . . . . . . . . . . . . . . . . . . . . $ 6,114 Long-term investments
Stock investments . . . . . . . . . . . . . . . . . . . . . . . . . . 637
Property, plant, and equipment
Equipment . . . . . . . . . . . . . . . . . . . . . . . . . . . . . . . . 6,705
Less: Accumulated depreciation—equipment. . . 3,547 3,158 Intangible assets
Patents. . . . . . . . . . . . . . . . . . . . . . . . . . . . . . . . . . . 2,210
Total assets. . . . . . . . . . . . . . . . . . . . . . . . . . . . . . . . . . . $12,119
Liabilities and Stockholders’ Equity Current liabilities
Accounts payable . . . . . . . . . . . . . . . . . . . . . . . . . . $1,459
Income taxes payable. . . . . . . . . . . . . . . . . . . . . . . 128
Total current liabilities . . . . . . . . . . . . . . . . . . . $ 1,587 Long-term liabilities
Notes payable . . . . . . . . . . . . . . . . . . . . . . . . . . . . . 810
Total liabilities. . . . . . . . . . . . . . . . . . . . . . . . . . . . . 2,397 Stockholders’ equity
Common stock. . . . . . . . . . . . . . . . . . . . . . . . . . . . . 2,826
Retained earnings. . . . . . . . . . . . . . . . . . . . . . . . . . 6,896
Total stockholders’ equity. . . . . . . . . . . . . . . . 9,722
Total liabilities and stockholders’ equity. . . . . . . . . . . . $12,119
(Assets = Liabilities + Stockholders’ Equity)
LO 1 BT: AP Difficulty: Medium TOT: 10 min. AACSB: Analytic AICPA FC: Reporting 2-16
Kimmel, Financial Accounting, 8/e, Solutions Manual (For Instructor Use Only) EXERCISE 2-7
(a) Earnings per share =
Net income Preferred dividends
Average common shares outstanding 2017 : $66,176,000 – 0 = $ 1.01
(66,282,000 + 64,507,000) / 2 2016 : $54,587,000 – 0
(73,139,000 + 66,282,000) / 2 = $ .78
(b) Using net income (loss) as a basis to evaluate profitability, Cal away
Golf’s income improved by 21% [($66,176 – $54,587) ÷ 54,587] between
2016 and 2017. Its earnings per share increased by 29% [($1.01 – $0.78) ÷ $0.78].
(c) To determine earnings per share, dividends on preferred stock are
subtracted from net income, but dividends on common stock are not subtracted.
LO 2 BT: AP Difficulty: Medium TOT: 7 min. AACSB: Analytic AICPA FC: Reporting
Kimmel, Financial Accounting, 8/e, Solutions Manual (For Instructor Use Only) 2-17 EXERCISE 2-8 (a) FAIRVIEW CORPORATION Income Statement
For the Year Ended July 31, 2017 Revenues
Service revenue. . . . . . . . . . . . . . . . . . . . . . . $66,100
Rent revenue . . . . . . . . . . . . . . . . . . . . . . . . . 8,500
Total revenues . . . . . . . . . . . . . . . . . . . . $74,600 Expenses
Salaries and wages expense . . . . . . . . . . . . 57,500
Supplies expense. . . . . . . . . . . . . . . . . . . . . 15,600
Depreciation expense . . . . . . . . . . . . . . . . . . 4,000
Total expenses. . . . . . . . . . . . . . . . . . . . 77,100
Net loss. . . . . . . . . . . . . . . . . . . . . . . . . . . . . . . . . $ (2,500) FAIRVIEW CORPORATION
Retained Earnings Statement
For the Year Ended July 31, 2017
Retained earnings, August 1, 2013. . . . . . . . . . . $34,000
Less: Net loss . . . . . . . . . . . . . . . . . . . . . . . . . . . $2,500
Dividends . . . . . . . . . . . . . . . . . . . . . . . . . 4,000 6,500
Retained earnings, July 31, 2014. . . . . . . . . . . . . $27,500
[Revenues – Expenses = Net income or (loss)]
(Beginning retained earnings ± Changes in retained earnings = Ending retained earnings) (b) FAIRVIEW CORPORATION Balance Sheet July 31, 2017 Assets Current assets
Cash . . . . . . . . . . . . . . . . . . . . . . . . . . . . . . . . $29,200
Accounts receivable . . . . . . . . . . . . . . . . . . . 9,780
Total current assets. . . . . . . . . . . . . . . . $38,980
Property, plant, and equipment
Equipment. . . . . . . . . . . . . . . . . . . . . . . . . . . 18,500
Less: Accumulated depreciation—
equipment. . . . . . . . . . . . . . . . . . . . 6,000 12,500
Total assets. . . . . . . . . . . . . . . . . . . . . . . . . . . . . . $51,480 2-18
Kimmel, Financial Accounting, 8/e, Solutions Manual (For Instructor Use Only) EXERCISE 2-8 (Continued) (b) FAIRVIEW CORPORATION
Balance Sheet (Continued) July 31, 2017
Liabilities and Stockholders’ Equity Current liabilities
Accounts payable. . . . . . . . . . . . . . . . . . . . . . $ 4,100
Salaries and wages payable . . . . . . . . . . . . . . 2,080
Total current liabilities. . . . . . . . . . . . . . . . . $ 6,180 Long-term liabilities
Notes payable . . . . . . . . . . . . . . . . . . . . . . . . . 1,800
Total liabilities. . . . . . . . . . . . . . . . . . . . . . . 7,980 Stockholders’ equity
Common stock. . . . . . . . . . . . . . . . . . . . . . . . . 16,000
Retained earnings . . . . . . . . . . . . . . . . . . . . . . 27,500
Total stockholders’ equity . . . . . . . . . . . . . 43,500
Total liabilities and stockholders’ equity. . . . . . . . $51,480
(Assets = Liabilities + Stockholders’ equity)
(c) Current ratio = $38,980 = 6.3 :1 $6,180
Debt to assets ratio = $7,980 = 15.5% $51,480
(Current assets ÷ Current liabilities) and (Total liabilities ÷ Total assets)
(d) The current ratio would not change because equipment is not a current
asset and a 5-year note payable is a long-term liability rather than a current liability.
The debt to assets ratio would increase from 15.5% to 39.1%*.
Looking solely at the debt to assets ratio, I would favor making the sale
because Fairview’s debt to assets ratio of 15.5% is very low. Looking at
additional financial data, I would note that Fairview reported a significant
loss for the current year which would lead me to question its ability to
make interest and loan payments (and even remain in business) in the
future. I would not make the proposed sale unless Fairview convinced
me that it would be capable of earnings in the future rather than losses.
Kimmel, Financial Accounting, 8/e, Solutions Manual (For Instructor Use Only) 2-19
EXERCISE 2-8 (Continued)
I would also consider making the sale but requiring a substantial down-
payment and smal er note.
*($7,980 + $20,000) ÷ ($51,480 + $20,000)
LO 1, 2 BT: AP Difficulty: Hard TOT: 20 min. AACSB: Analytic AICPA FC: Reporting EXERCISE 2-9 (a) Beginning of Year End of Year Working capital
$3,361 – $1,635 = $1,726 $3,217 – $1,601 = $1,616 $3,361 $3,217 Current ratio = 2.06:1 = 2.01:1 $1,635 $1,601
(Current assets – Current liabilities) and (Current assets ÷ Current liabilities)
(b) Nordstrom’s liquidity decreased slightly during the year. Its current
ratio decreased from 2.06:1 to 2.01:1. Also, Nordstrom’s working capital
decreased by $110 mil ion.
(c) Nordstrom’s current ratio at both the beginning and the end of the
recent year exceeds Best Buy’s current ratio for 2014 (and 2013).
Nordstrom’s end-of-year current ratio (2.01) exceeds Best Buy’s 2014
current ratio (1.41*). Nordstrom would be considered much more liquid
than Best Buy for the recent year. *(see text, pg. 55)
LO 2 BT: AP Difficulty: Medium TOT: 10 min. Difficulty: Analytic AICPA FC: Reporting EXERCISE 2-10 $60,000 (a) Current ratio = = 2.0: 1 $30,000
Working capital = $60,000 – $30,000 = $30,000
(Current assets ÷ Current liabilities) and (Current assets – Current liabilities) 2-20
Kimmel, Financial Accounting, 8/e, Solutions Manual (For Instructor Use Only)
Tài liệu liên quan:
-

Báo cáo Thảo luận Môn Marketing B2B - Nhóm 2 (Mã 2319MAGM)
12 6 -

Phân tích ảnh hưởng của nhân tố môi trường văn hóa – xã hội và công nghệ tới hoạt động marketing và đề xuất giải pháp xúc tiến thương mại | Bài thảo luận marketing căn bản
23 12 -
Phân tích thực trạng kế hoạch marketing đối với sản phẩm Kính mắt Anna | Bài thảo luận marketing căn bản
25 13 -
Thực trạng chính sách điều chỉnh giá tại chuỗi siêu thị điện máy media mart | Bài thảo luận marketing căn bản
27 14 -

Slide Quản trị Marketing 1 | Trường Đại học Thương Mại
42 21