Group Assignment 1: Analyzing Opportunity Costs in Production | Microeconomics | Trường Đại học Quốc tế, Đại học Quốc gia Thành phố Hồ Chí Minh
Tài liệu được sưu tầm và soạn thảo dưới dạng file PDF với mục đích hỗ trợ học tập và tham khảo. Nội dung tài liệu được trình bày rõ ràng, dễ tiếp cận, phù hợp cho việc ôn tập và củng cố kiến thức trong quá trình học đại học. Đây sẽ là nguồn tư liệu hữu ích giúp các bạn sinh viên chuẩn bị tốt hơn cho các buổi học, đồng thời mở rộng thêm hiểu biết về môn học. Hy vọng tài liệu này sẽ mang lại nhiều giá trị và hỗ trợ các bạn trong hành trình học tập. Mời bạn đọc cùng tham khảo!
Môn: Microeconomics 613 tài liệu
Trường: Trường Đại học Quốc tế, Đại học Quốc gia Thành phố Hồ Chí Minh 1.9 K tài liệu
Tác giả:
Preview text:
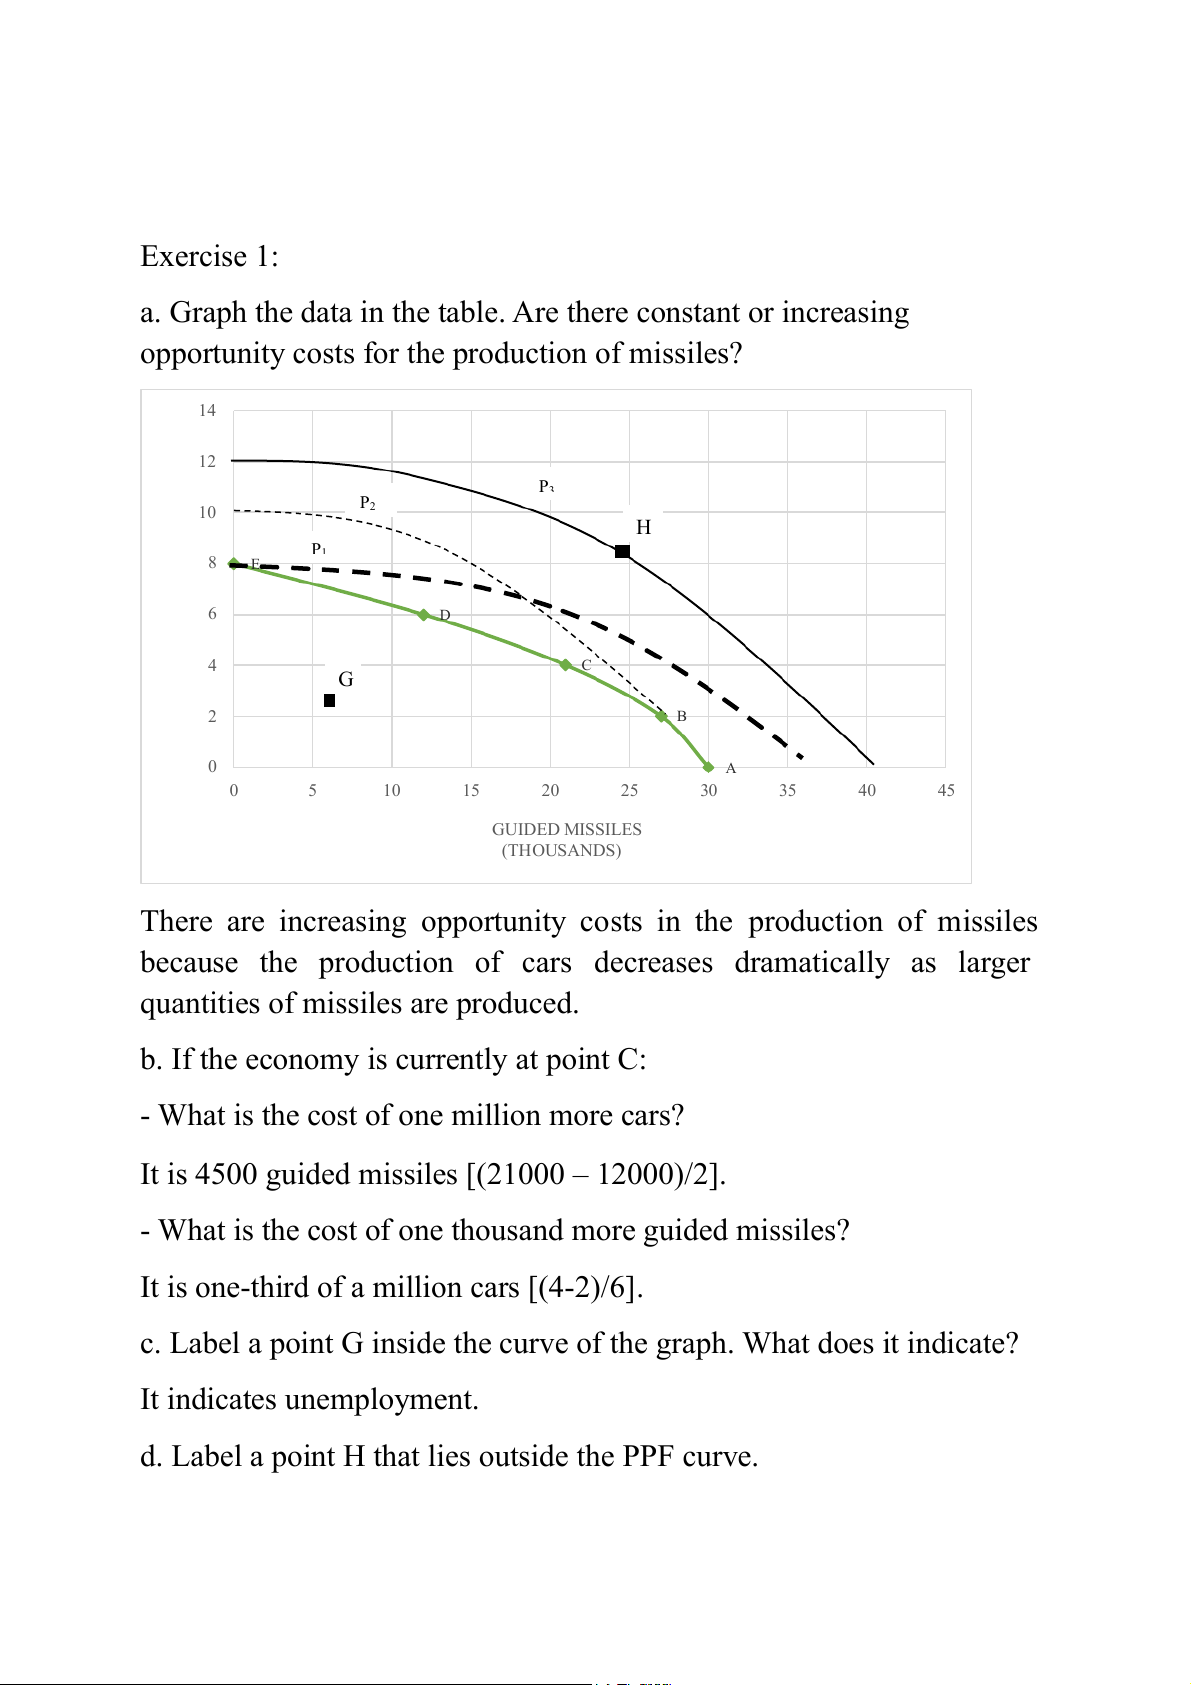
Exercise 1:
a. Graph the data in the table. Are there constant or increasing
opportunity costs for the production of missiles? 14 12 P3 ) S 10 P2 N H IO L P 8 1 E IL (M S 6 D R A C 4 C G 2 B 0 A 0 5 10 15 20 25 30 35 40 45 GUIDED MISSILES (THOUSANDS)
There are increasing opportunity costs in the production of missiles
because the production of cars decreases dramatically as larger
quantities of missiles are produced.
b. If the economy is currently at point C:
- What is the cost of one million more cars?
It is 4500 guided missiles [(21000 – 12000)/2].
- What is the cost of one thousand more guided missiles?
It is one-third of a million cars [(4-2)/6].
c. Label a point G inside the curve of the graph. What does it indicate? It indicates unemployment.
d. Label a point H that lies outside the PPF curve.
- What does this point indicate?
It is at present unattainable.
- What must occur before the economy can attain the level of production indicated by point H? Economic development must.
e. Suppose improvement occurs in the technology of producing guided
missiles but not in the production of cars.
- Draw the new PPF curve on the graph you created. (P1)
- Now draw a curve that reflects improvement in the production of both products. (P3) Exercise 2:
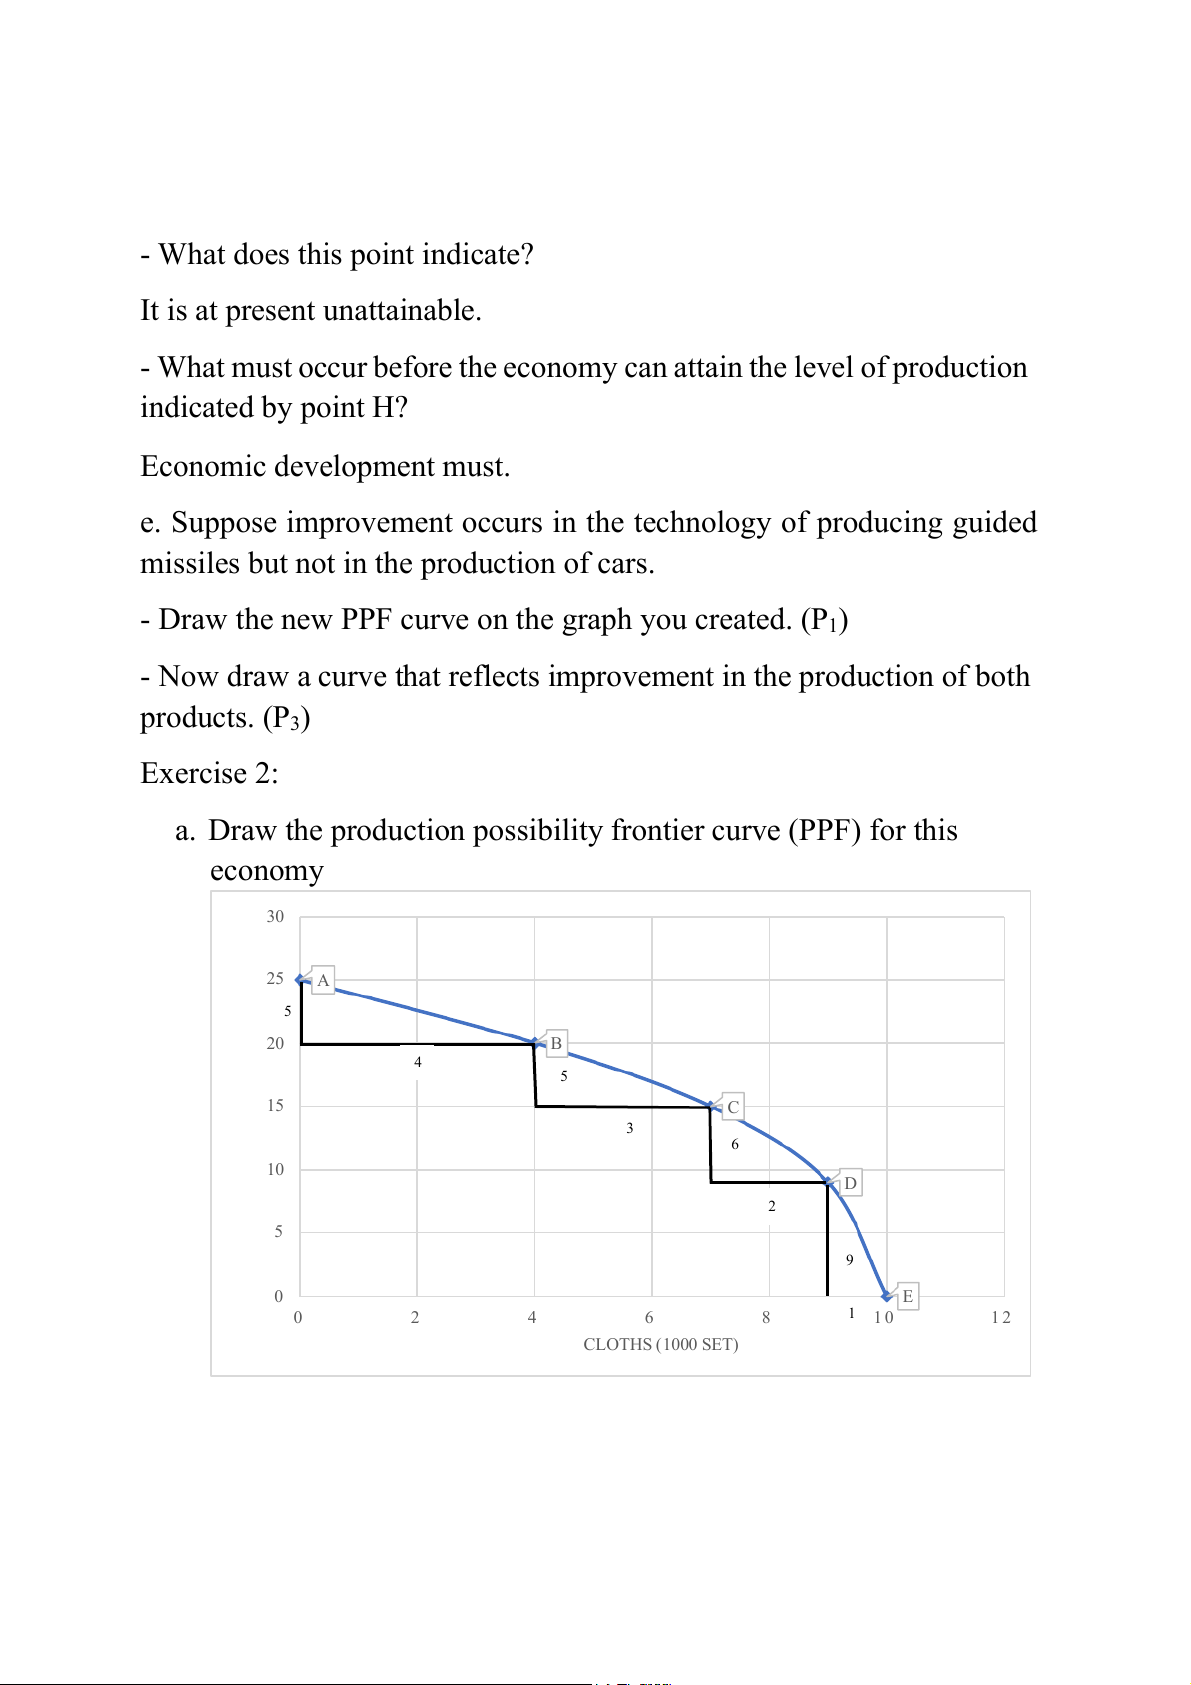
a. Draw the production possibility frontier curve (PPF) for this economy 30 25 A 5 S) 20 B N 4 O 5 (T T 15 C A E 3 H 6 W 10 D 2 5 9 0 E 0 2 4 6 8 1 1 0 1 2 CLOTHS (1000 SET)
b. If output of wheat and cloths are 9 tons of wheat and 4000 set of
cloths, what do you think about productive efficiency of this economy?
If output of wheat and cloths are 9 tons of wheat and 4000 set of
cloths, it means that this economy uses resource inefficiently.
c. Can this economy produce 20 tons of wheat and 10,000 set of cloths?
No, it can’t because the PPF shows that only 4000 set of cloths are
produced when this economy produces 20 tons of wheat.
d. Calculate opportunity costs of producing wheat and cloths? (PPF)
Tài liệu liên quan:
-

Tự Luận Vimo: Phân Tích Cung, Cầu và Thị Trường Cạnh Tranh| Microeconomics | Trường Đại học Quốc tế, Đại học Quốc gia Thành phố Hồ Chí Minh
5 3 -
Review Questions: Thinking Like an Economist | Microeconomics | Trường Đại học Quốc tế, Đại học Quốc gia Thành phố Hồ Chí Minh
5 3 -
Final Exam Quizlet Questions & Answers | Microeconomics | Trường Đại học Quốc tế, Đại học Quốc gia Thành phố Hồ Chí Minh
5 3 -
Đề thi giữa kỳ II | Microeconomics | Trường Đại học Quốc tế, Đại học Quốc gia Thành phố Hồ Chí Minh
5 3 -
Final Group Project_ The Beer Industry | Microeconomics | Trường Đại học Quốc tế, Đại học Quốc gia Thành phố Hồ Chí Minh
4 2