Group Assignment 3 | Microeconomics | Trường Đại học Quốc tế, Đại học Quốc gia Thành phố Hồ Chí Minh
In the late summer of 2015, Hurricane Katrina caused a storm surge and levee breaks that flooded much of New Orleans and destroyed a large fraction of the city’s housing. Hundreds of thousands of residents were displaced, and about 250,000 relocated to nearby Baton Rouge. The increase in population was so large that Baton Rouge became the largest city in the state, and many people started calling the city “New baton Rouge”. Tài liệu được sưu tầm và soạn thảo dưới dạng file PDF để gửi tới các bạn cùng tham khảo, ôn tập đầy đủ kiến thức, chuẩn bị cho các buổi học thật tốt. Mời bạn đọc đón xem!
Môn: Microeconomics 613 tài liệu
Trường: Trường Đại học Quốc tế, Đại học Quốc gia Thành phố Hồ Chí Minh 1.9 K tài liệu
Tác giả:

Preview text:
GROUP ASSIGNMENT 3 Case 1
In the late summer of 2015, Hurricane Katrina caused a storm surge and levee
breaks that flooded much of New Orleans and destroyed a large fraction of the
city’s housing. Hundreds of thousands of residents were displaced, and about
250,000 relocated to nearby Baton Rouge. The increase in population was so large
that Baton Rouge became the largest city in the state, and many people started
calling the city “New baton Rouge”.
Before Katrina, the average price of a single-family home was $130,000. The
increase in the city’s population shifted the demand curve to the right, causing
excess demand for housing at the original price. Just before the hurricane, there
were 3,600 homes listed for sale in the city, but a week after the storm, there were
only 500. The excess demand caused fierce competition among buyers for the
limited supply of homes, increasing the price. Six months later, the average price
had risen to $ 156,000 Questions
1. Explain the effects of Hurricane Katrina to demand for housing in Baton Rouge
and to the price and quantity of housing there. Use a graph to explain.
2. Suppose that five years after Hurricane Katrina, half the people who had
relocated to Baton Rouge move back to a rebuilt New Orleans. Use a demand and
supply graph of the Baton Rouge housing market to show the market effects of the
return of people to New Orleans. Answer
1. Explain the effects of Hurricane Katrina to demand for housing in Baton
Rouge and to the price and quantity of housing there. Use a graph to explain
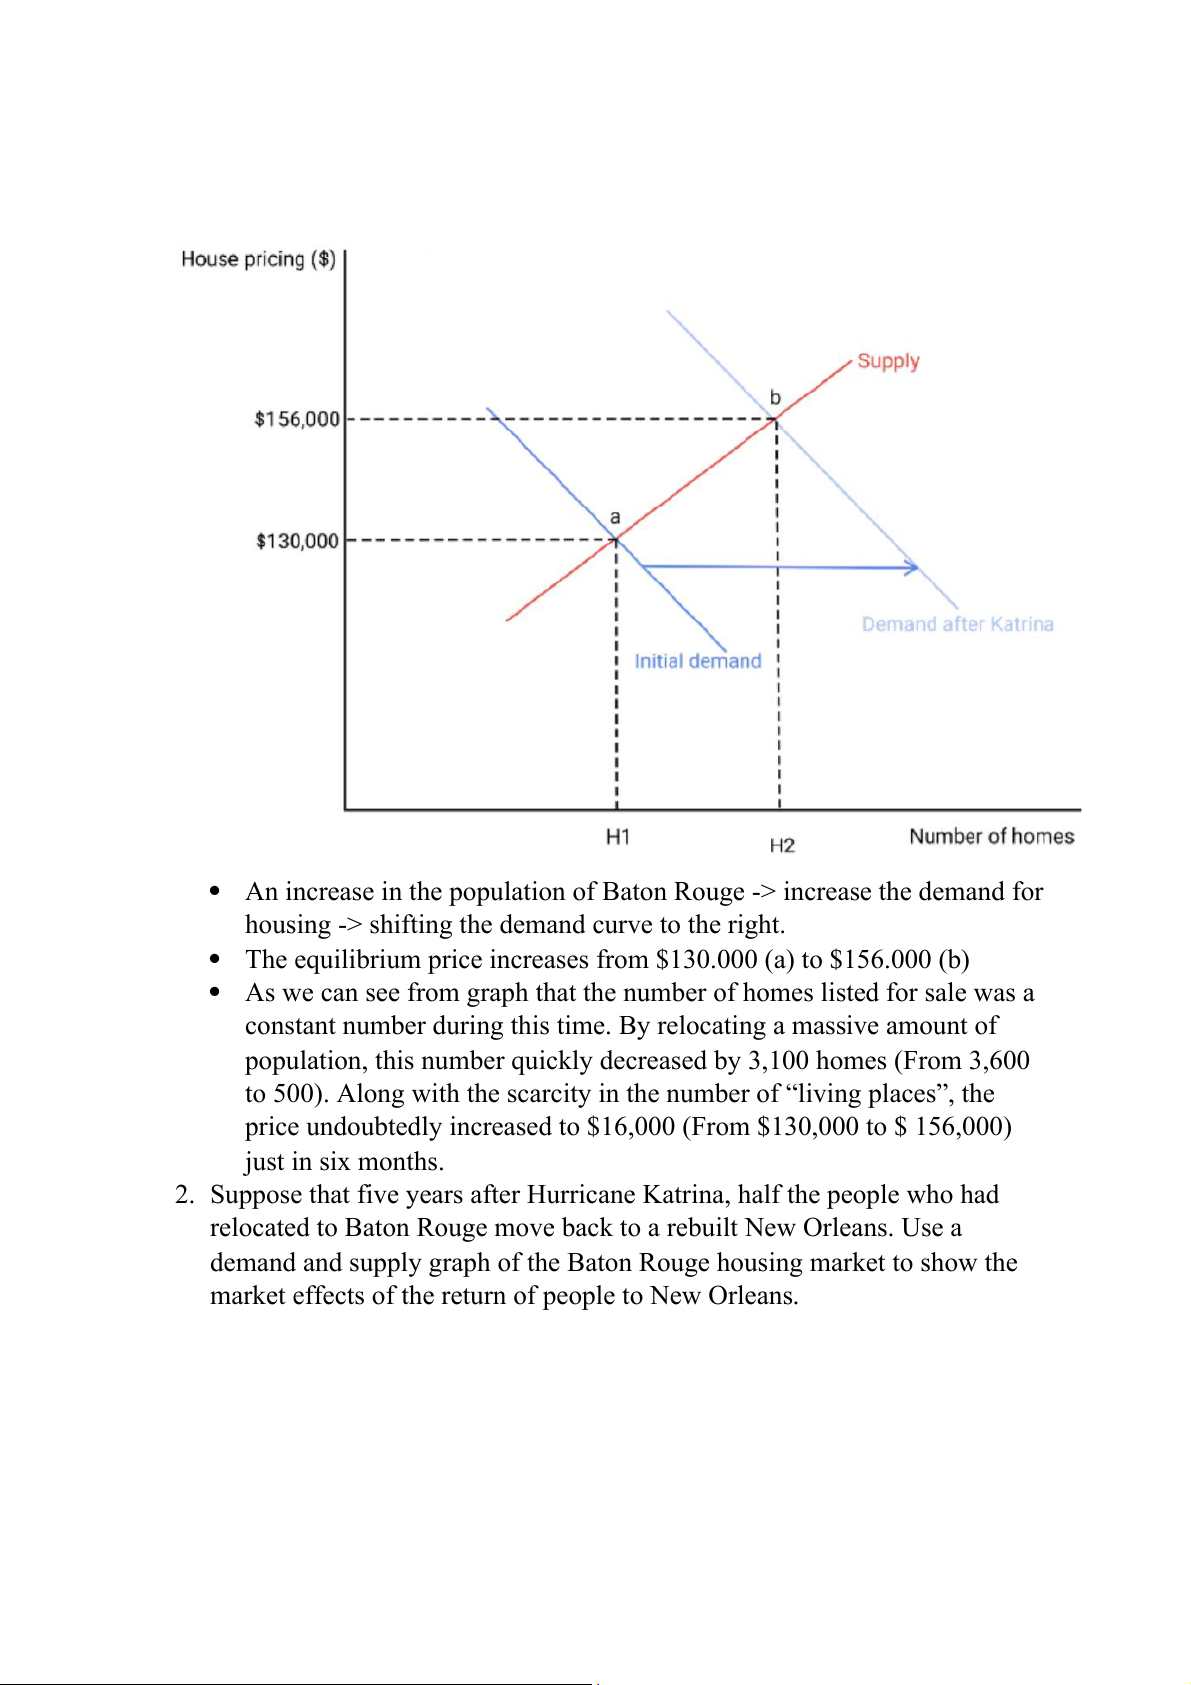
The line graphs show the demand for housing in Baton Rouge caused by Hurricane Katrina
An increase in the population of Baton Rouge -> increase the demand for
housing -> shifting the demand curve to the right.
The equilibrium price increases from $130.000 (a) to $156.000 (b)
As we can see from graph that the number of homes listed for sale was a
constant number during this time. By relocating a massive amount of
population, this number quickly decreased by 3,100 homes (From 3,600
to 500). Along with the scarcity in the number of “living places”, the
price undoubtedly increased to $16,000 (From $130,000 to $ 156,000) just in six months.
2. Suppose that five years after Hurricane Katrina, half the people who had
relocated to Baton Rouge move back to a rebuilt New Orleans. Use a
demand and supply graph of the Baton Rouge housing market to show the
market effects of the return of people to New Orleans.
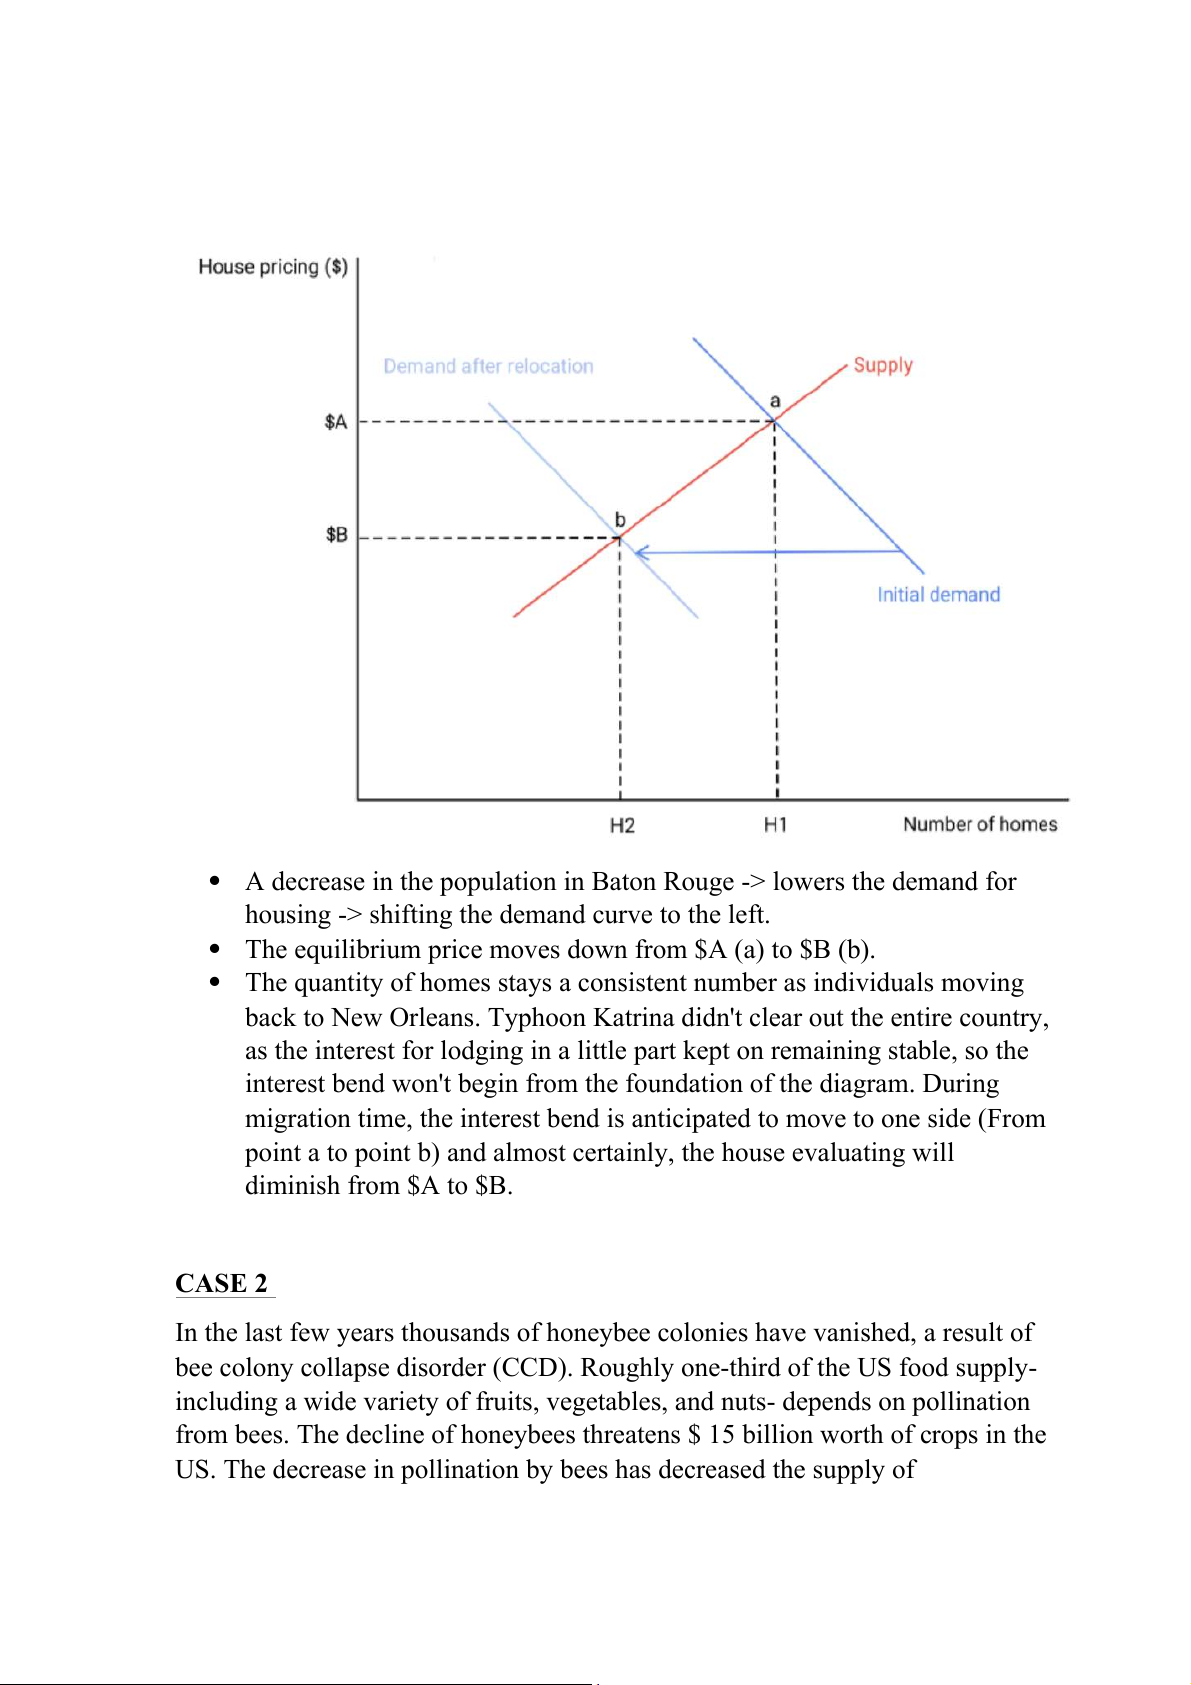
A decrease in the population in Baton Rouge -> lowers the demand for
housing -> shifting the demand curve to the left.
The equilibrium price moves down from $A (a) to $B (b).
The quantity of homes stays a consistent number as individuals moving
back to New Orleans. Typhoon Katrina didn't clear out the entire country,
as the interest for lodging in a little part kept on remaining stable, so the
interest bend won't begin from the foundation of the diagram. During
migration time, the interest bend is anticipated to move to one side (From
point a to point b) and almost certainly, the house evaluating will diminish from $A to $B. CASE 2
In the last few years thousands of honeybee colonies have vanished, a result of
bee colony collapse disorder (CCD). Roughly one-third of the US food supply-
including a wide variety of fruits, vegetables, and nuts- depends on pollination
from bees. The decline of honeybees threatens $ 15 billion worth of crops in the
US. The decrease in pollination by bees has decreased the supply of
strawberries, raspberries, and almost, leading to higher prices for these
ingredients for ice cream. The higher price for berries and nuts has increased
the cost of producing food products, such as ice cream, increasing their prices as well. Questions
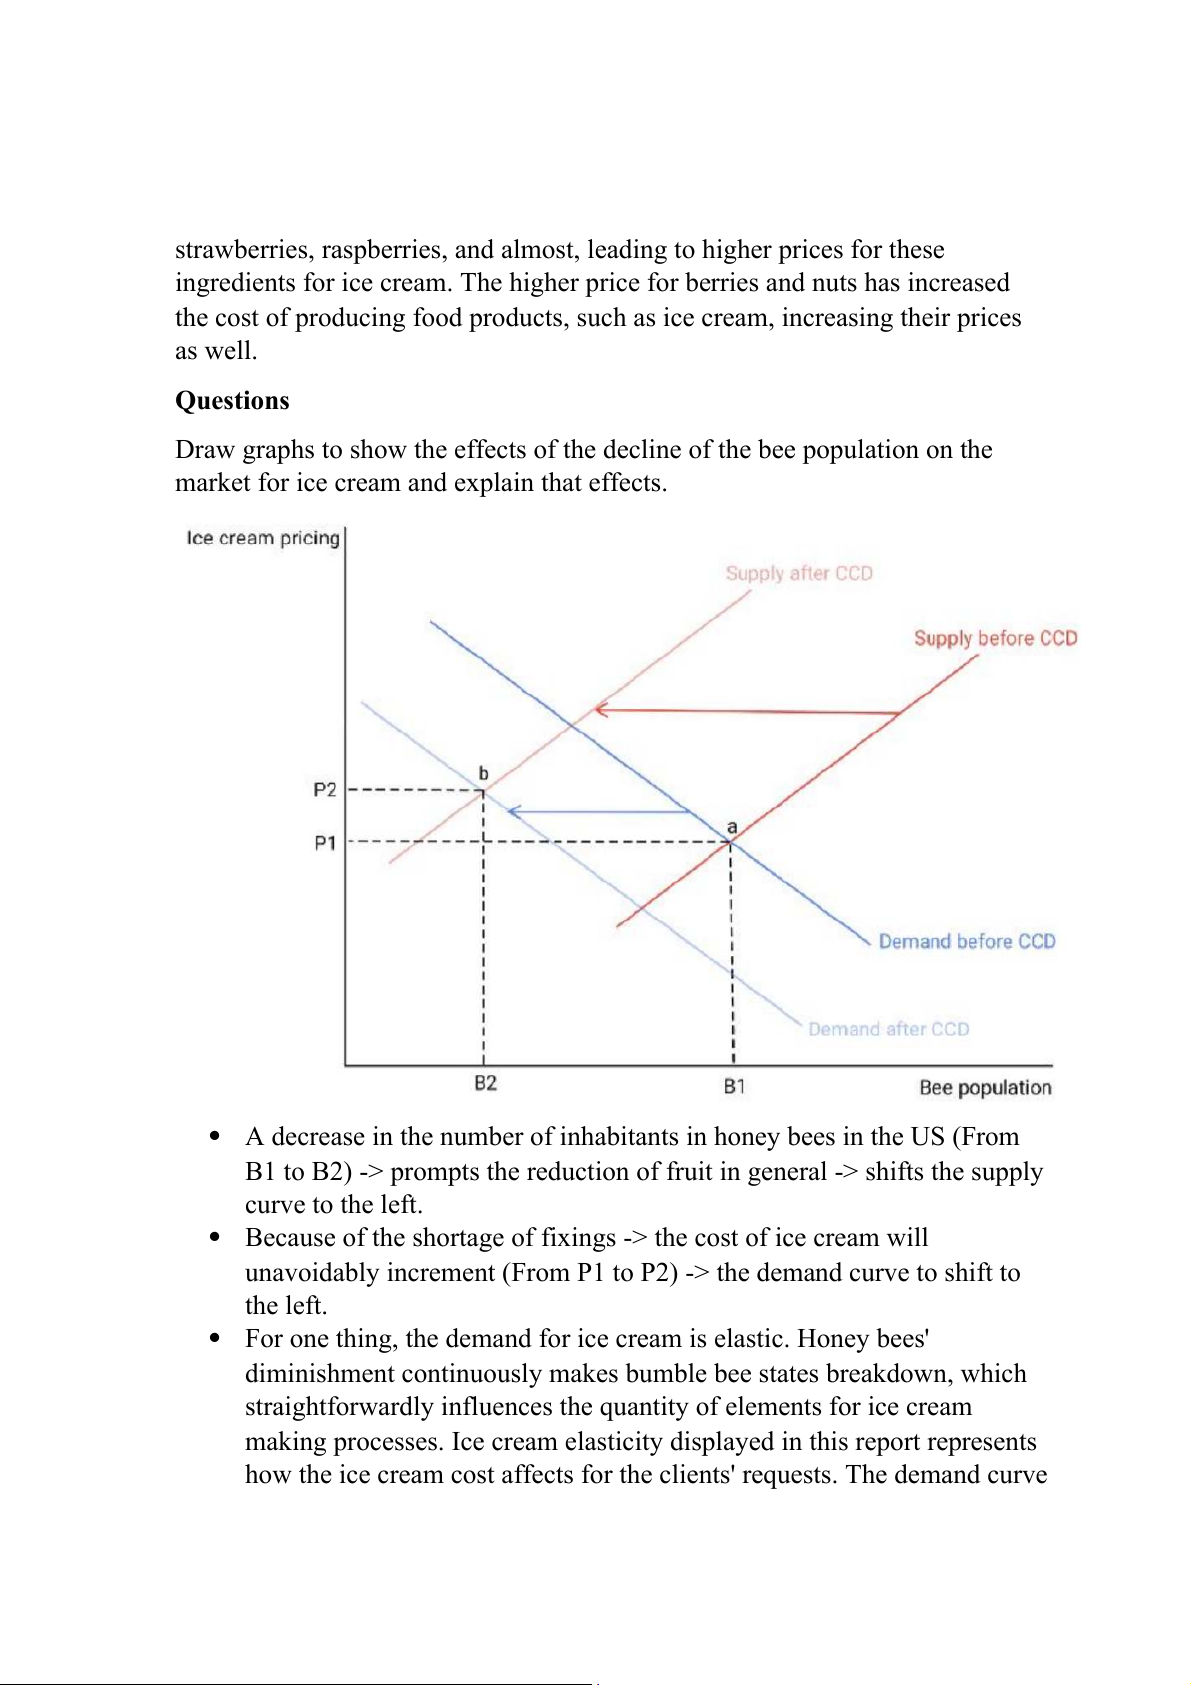
Draw graphs to show the effects of the decline of the bee population on the
market for ice cream and explain that effects.
A decrease in the number of inhabitants in honey bees in the US (From
B1 to B2) -> prompts the reduction of fruit in general -> shifts the supply curve to the left.
Because of the shortage of fixings -> the cost of ice cream will
unavoidably increment (From P1 to P2) -> the demand curve to shift to the left.
For one thing, the demand for ice cream is elastic. Honey bees'
diminishment continuously makes bumble bee states breakdown, which
straightforwardly influences the quantity of elements for ice cream
making processes. Ice cream elasticity displayed in this report represents
how the ice cream cost affects for the clients' requests. The demand curve
is predicted to strongly shift to the left as the supplement begins to show
its scarcity in producing products. By and large, the decrease of the bee
population will affect the market for ice cream in a rough way as ice cream is an elastic product.
Tài liệu liên quan:
-

Tự Luận Vimo: Phân Tích Cung, Cầu và Thị Trường Cạnh Tranh| Microeconomics | Trường Đại học Quốc tế, Đại học Quốc gia Thành phố Hồ Chí Minh
5 3 -
Review Questions: Thinking Like an Economist | Microeconomics | Trường Đại học Quốc tế, Đại học Quốc gia Thành phố Hồ Chí Minh
5 3 -
Final Exam Quizlet Questions & Answers | Microeconomics | Trường Đại học Quốc tế, Đại học Quốc gia Thành phố Hồ Chí Minh
5 3 -

Đề thi giữa kỳ II | Microeconomics | Trường Đại học Quốc tế, Đại học Quốc gia Thành phố Hồ Chí Minh
5 3 -

Final Group Project_ The Beer Industry | Microeconomics | Trường Đại học Quốc tế, Đại học Quốc gia Thành phố Hồ Chí Minh
4 2