Group Assignment on Microeconomics PPF Analysis | Microeconomics | Trường Đại học Quốc tế, Đại học Quốc gia Thành phố Hồ Chí Minh
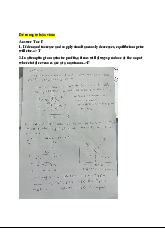
Graph the data in the table. Are there constant or increasing opportunity costs for the production of missiles? b. If the economy is currently at point C: - What is the cost of one million more cars? - What is the cost of one thousand more guided missiles? c. Label a point G inside the curve of the graph. What does it indicate? d. Label a point H that lies outside the PPF curve. - What does this point indicate? - What must occur before the economy can attain the level of production indicated by point H? Tài liệu được sưu tầm và soạn thảo dưới dạng file PDF để gửi tới các bạn cùng tham khảo, ôn tập đầy đủ kiến thức, chuẩn bị cho các buổi học thật tốt. Mời bạn đọc đón xem!
Môn: Microeconomics 613 tài liệu
Trường: Trường Đại học Quốc tế, Đại học Quốc gia Thành phố Hồ Chí Minh 1.9 K tài liệu
Tác giả:
Preview text:
TR NG Đ Ư I H Ờ C KINH Ạ Ọ TẾẾ QUỐẾC DÂN Viện Quả n tr kinh doanh ị Lớ p EBBA 13.1 Kinh tếế vi mô
Hôồ Sĩ Minh – MSV: 11219093
Group assignment presentation 1
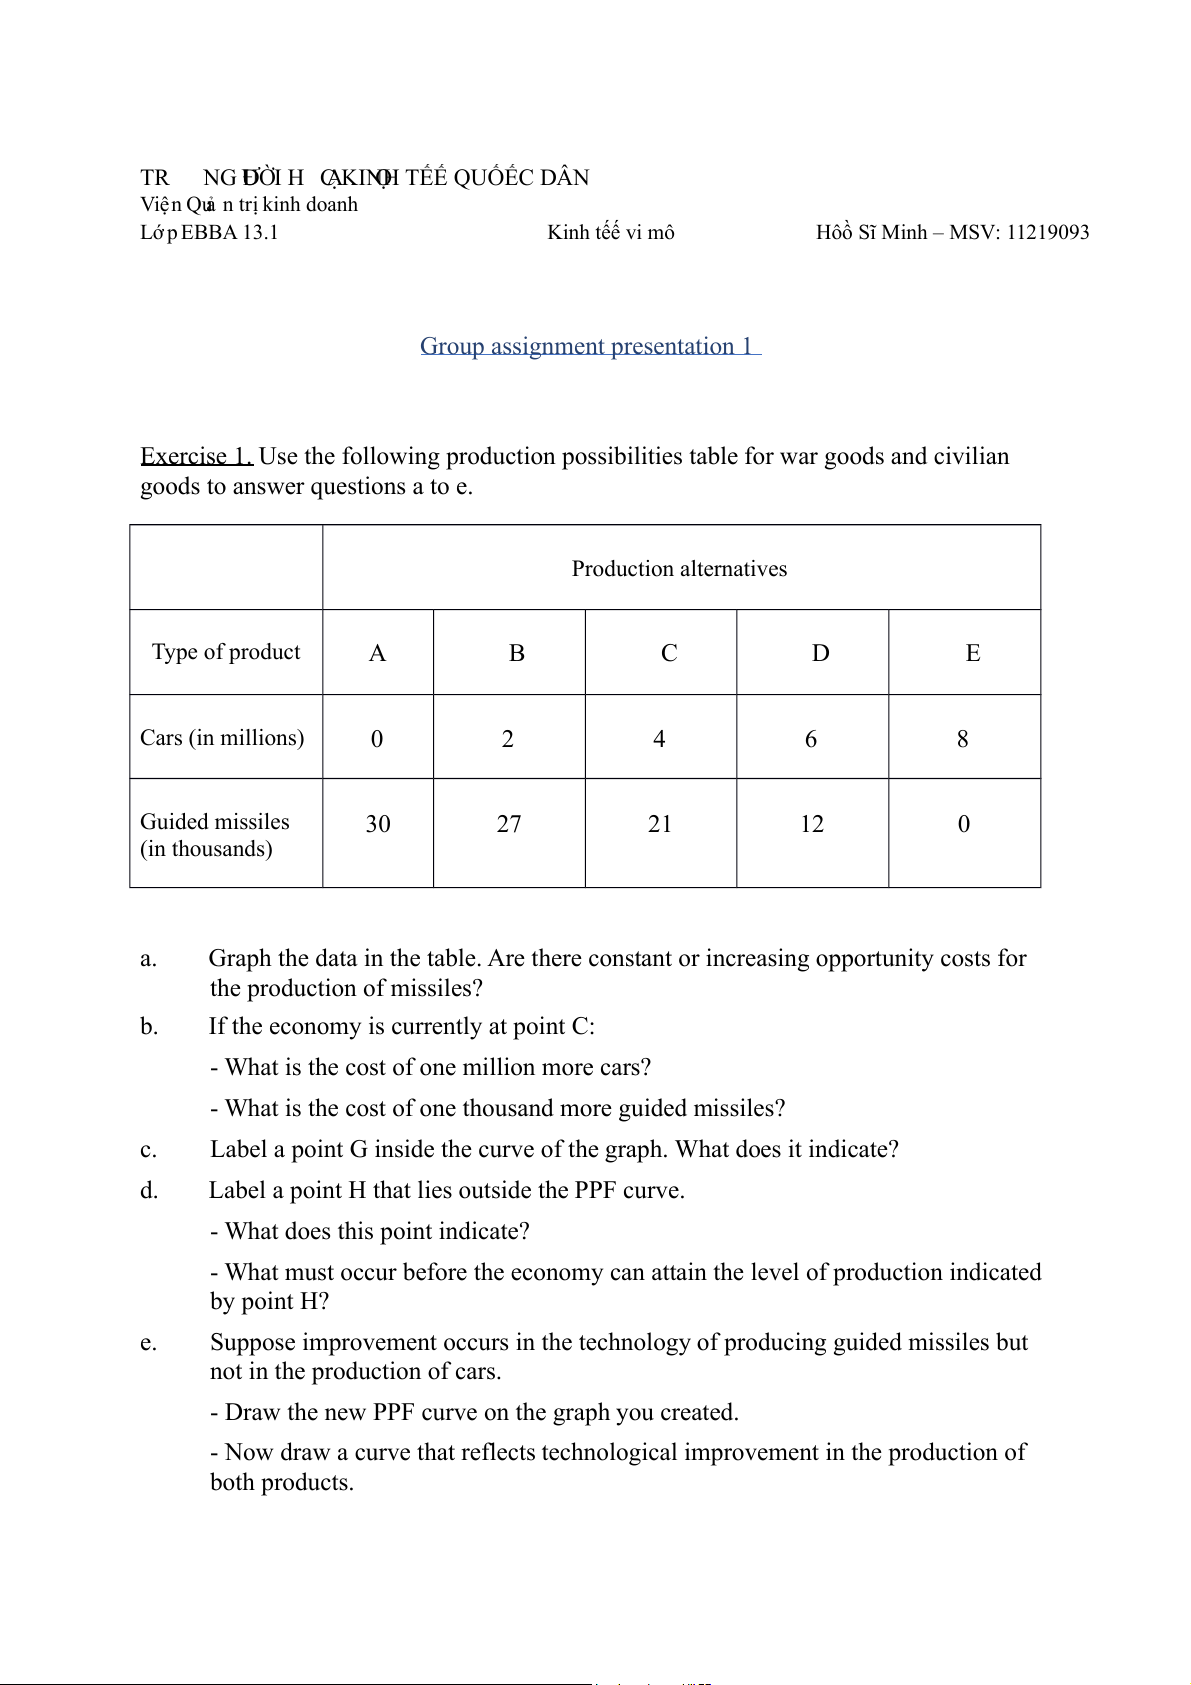
Exercise 1. Use the following production possibilities table for war goods and civilian
goods to answer questions a to e. Production alternatives Type of product A B C D E Cars (in millions) 0 2 4 6 8 Guided missiles 30 27 21 12 0 (in thousands) a.
Graph the data in the table. Are there constant or increasing opportunity costs for the production of missiles? b.
If the economy is currently at point C:
- What is the cost of one million more cars?
- What is the cost of one thousand more guided missiles? c.
Label a point G inside the curve of the graph. What does it indicate? d.
Label a point H that lies outside the PPF curve.
- What does this point indicate?
- What must occur before the economy can attain the level of production indicated by point H? e.
Suppose improvement occurs in the technology of producing guided missiles but
not in the production of cars.
- Draw the new PPF curve on the graph you created.
- Now draw a curve that reflects technological improvement in the production of both products. TR NG Đ Ư I H Ờ C KINH Ạ Ọ TẾẾ QUỐẾC DÂN Viện Quả n tr kinh doanh ị Lớ p EBBA 13.1 Kinh tếế vi mô
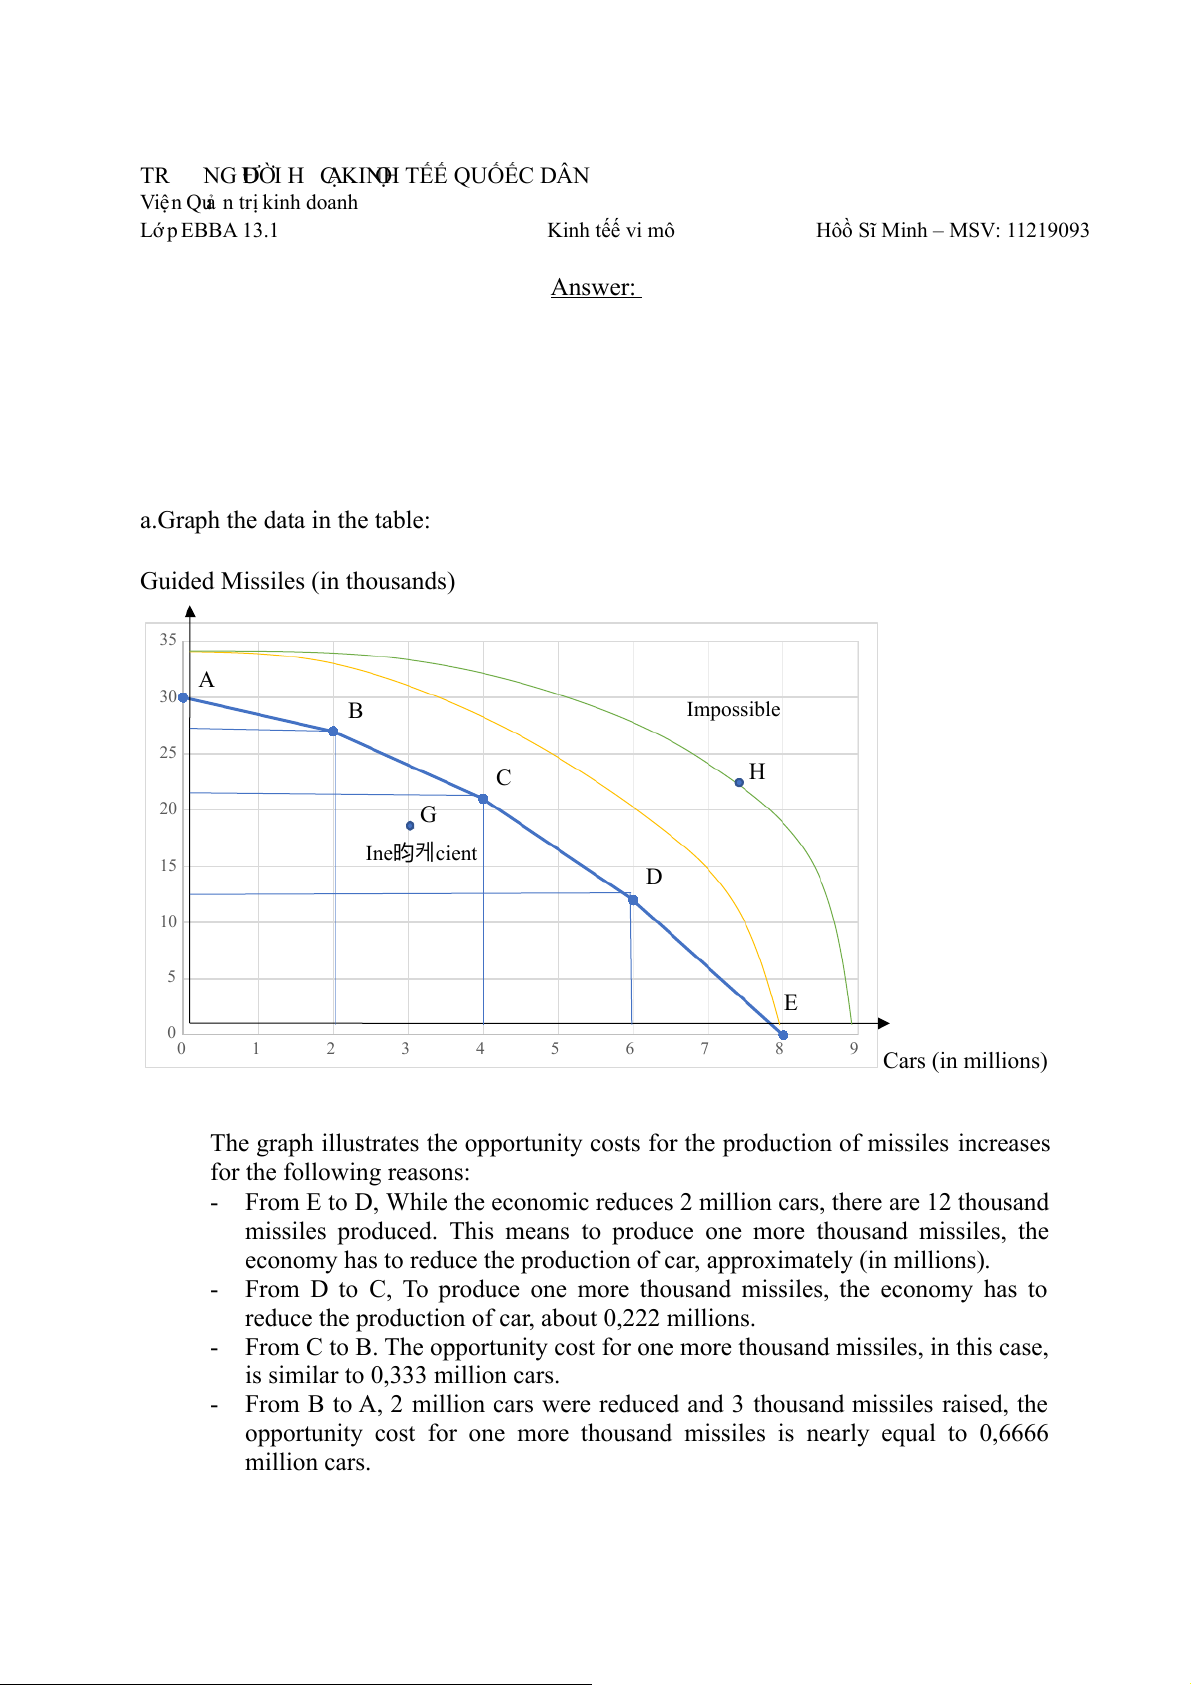
Hôồ Sĩ Minh – MSV: 11219093 Answer: a.Graph the data in the table: Guided Missiles (in thousands) 35 A 30 B Impossible 25 H C 20 G Ine昀케cient 15 D 10 5 E 00 1 2 3 4 5 6 7 8 9 Cars (in millions)
The graph illustrates the opportunity costs for the production of missiles increases for the following reasons:
- From E to D, While the economic reduces 2 million cars, there are 12 thousand
missiles produced. This means to produce one more thousand missiles, the
economy has to reduce the production of car, approximately (in millions).
- From D to C, To produce one more thousand missiles, the economy has to
reduce the production of car, about 0,222 millions.
- From C to B. The opportunity cost for one more thousand missiles, in this case,
is similar to 0,333 million cars.
- From B to A, 2 million cars were reduced and 3 thousand missiles raised, the
opportunity cost for one more thousand missiles is nearly equal to 0,6666 million cars. TR NG Đ Ư I H Ờ C KINH Ạ Ọ TẾẾ QUỐẾC DÂN Viện Quả n tr kinh doanh ị Lớ p EBBA 13.1 Kinh tếế vi mô
Hôồ Sĩ Minh – MSV: 11219093 b. At point C:
- The cost of one million more cars is: (thousand missiles)
- The cost of one thousand more guided missiles is: (million cars) c.
The G point indicates one production rate below the PPF curve. It’s show the inefficiently of economy. d.
- Point H indicates the impossible outcome with the fixed resource.
- There are may factors that can lead to point H’s level of production, such as the
production technology must me developed, the number of skilled labour must be increased. e.
- The green line indicates improvement occurs in the technology of producing guided
missiles but not in the production of cars.
- The yellow line indicates technological improvement in the production of both products.
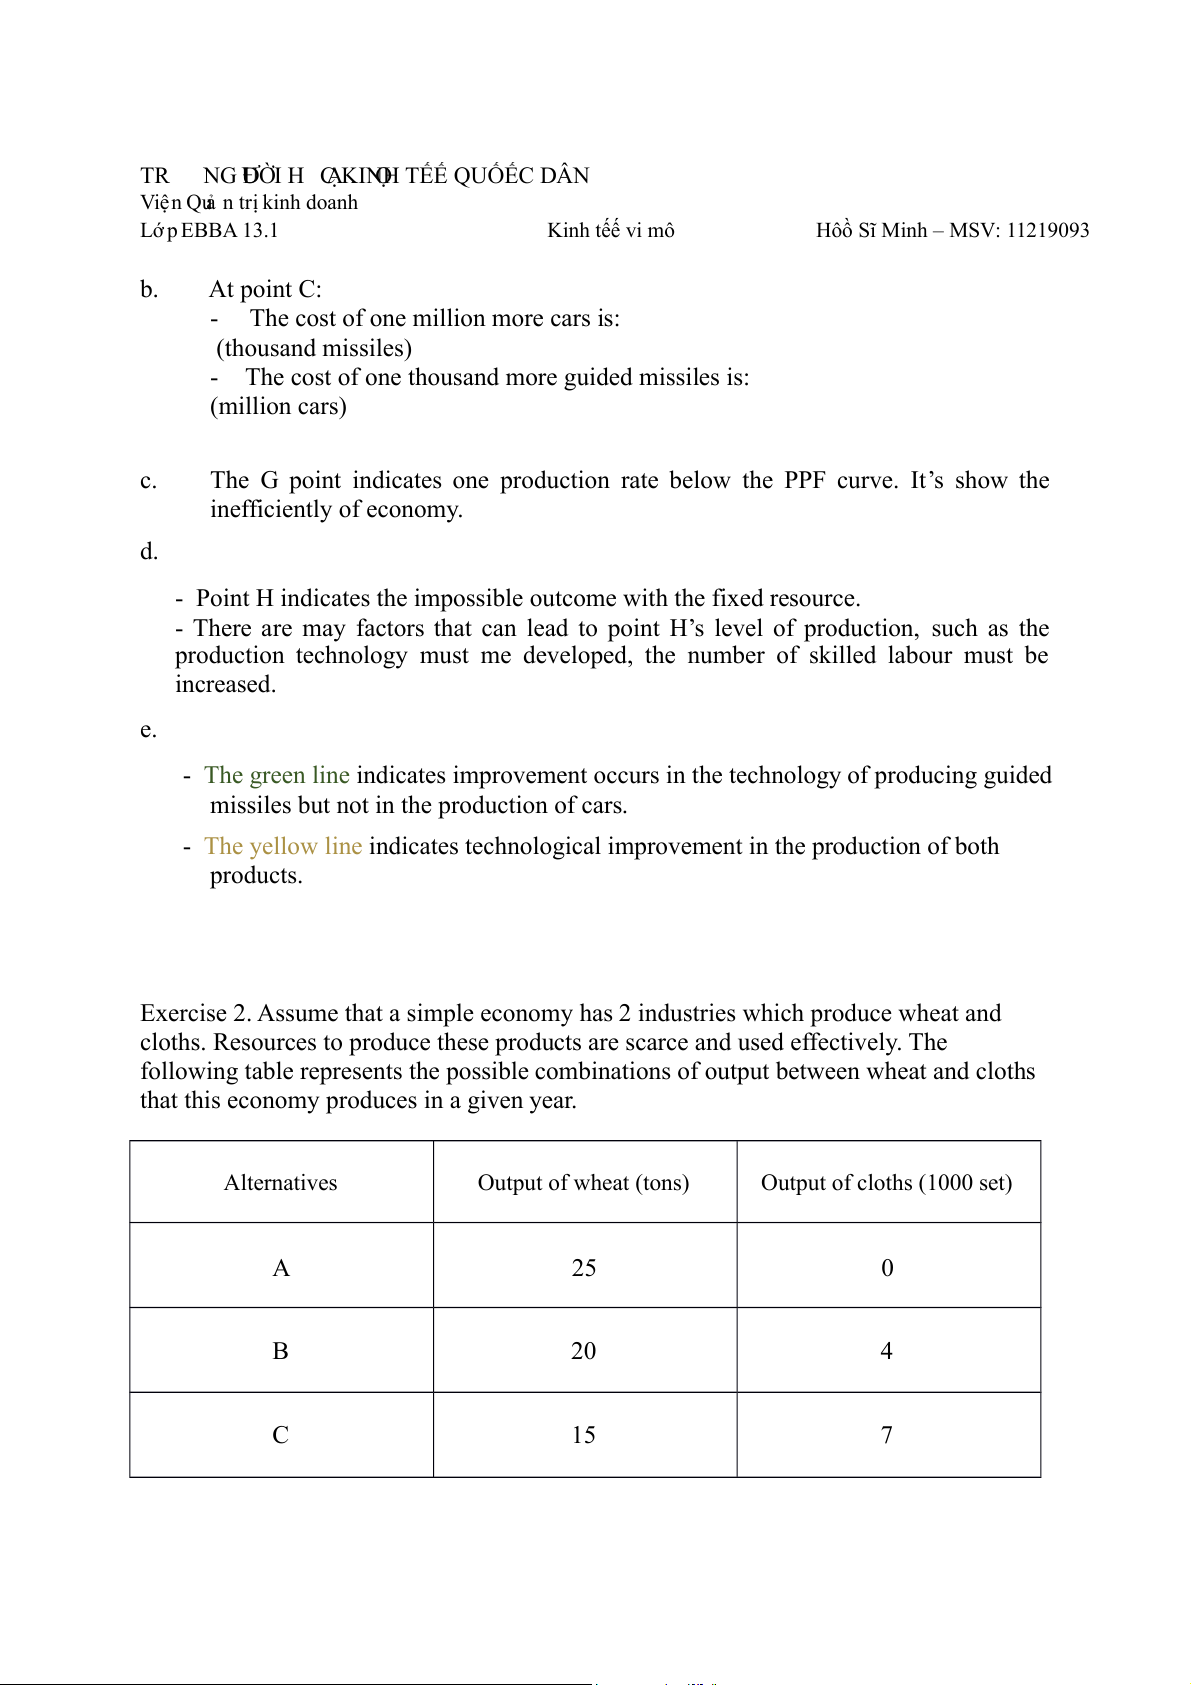
Exercise 2. Assume that a simple economy has 2 industries which produce wheat and
cloths. Resources to produce these products are scarce and used effectively. The
following table represents the possible combinations of output between wheat and cloths
that this economy produces in a given year. Alternatives Output of wheat (tons) Output of cloths (1000 set) A 25 0 B 20 4 C 15 7 TR NG Đ Ư I H Ờ C KINH Ạ Ọ TẾẾ QUỐẾC DÂN Viện Quả n tr kinh doanh ị Lớ p EBBA 13.1 Kinh tếế vi mô
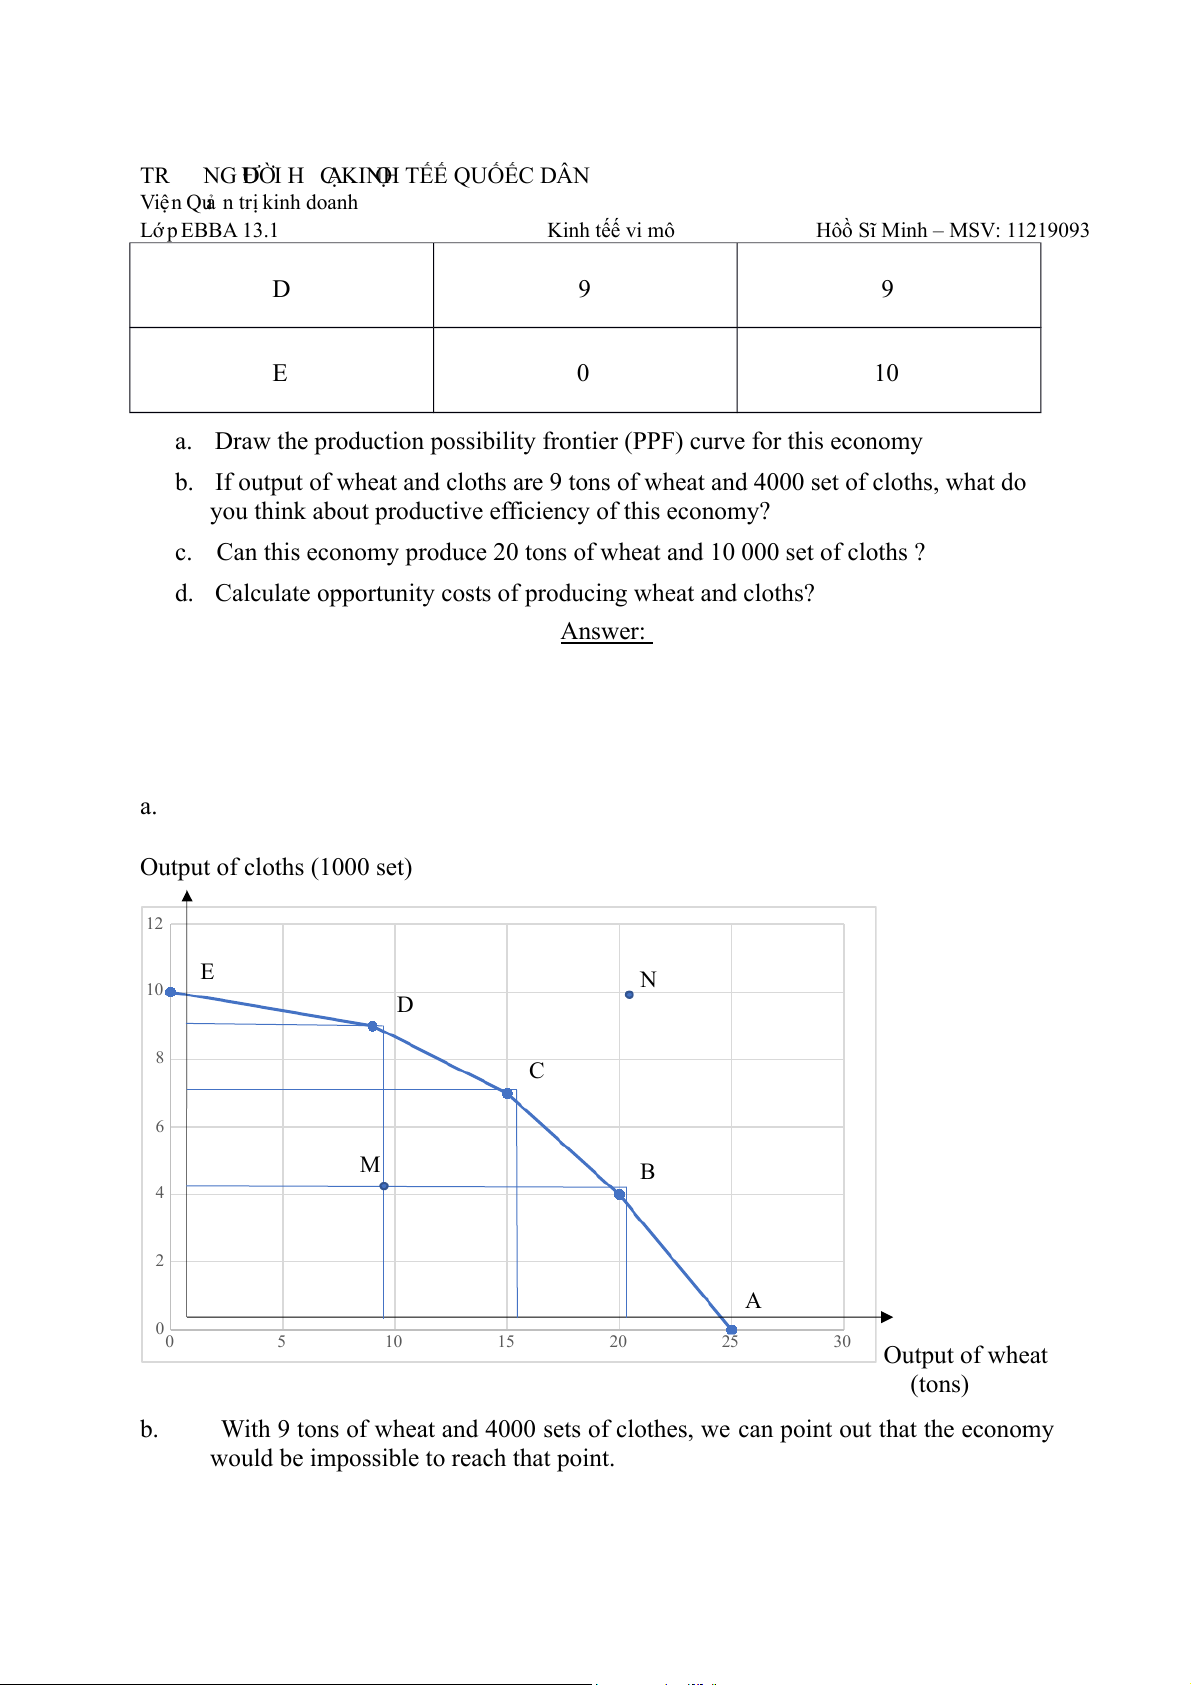
Hôồ Sĩ Minh – MSV: 11219093 D 9 9 E 0 10
a. Draw the production possibility frontier (PPF) curve for this economy
b. If output of wheat and cloths are 9 tons of wheat and 4000 set of cloths, what do
you think about productive efficiency of this economy?
c. Can this economy produce 20 tons of wheat and 10 000 set of cloths ?
d. Calculate opportunity costs of producing wheat and cloths? Answer: a. Output of cloths (1000 set) 12 E N 10 D 8 C 6 M B 4 2 A 00 5 10 15 20 25 30 Output of wheat (tons) b.
With 9 tons of wheat and 4000 sets of clothes, we can point out that the economy
would be impossible to reach that point. TR NG Đ Ư I H Ờ C KINH Ạ Ọ TẾẾ QUỐẾC DÂN Viện Quả n tr kinh doanh ị Lớ p EBBA 13.1 Kinh tếế vi mô
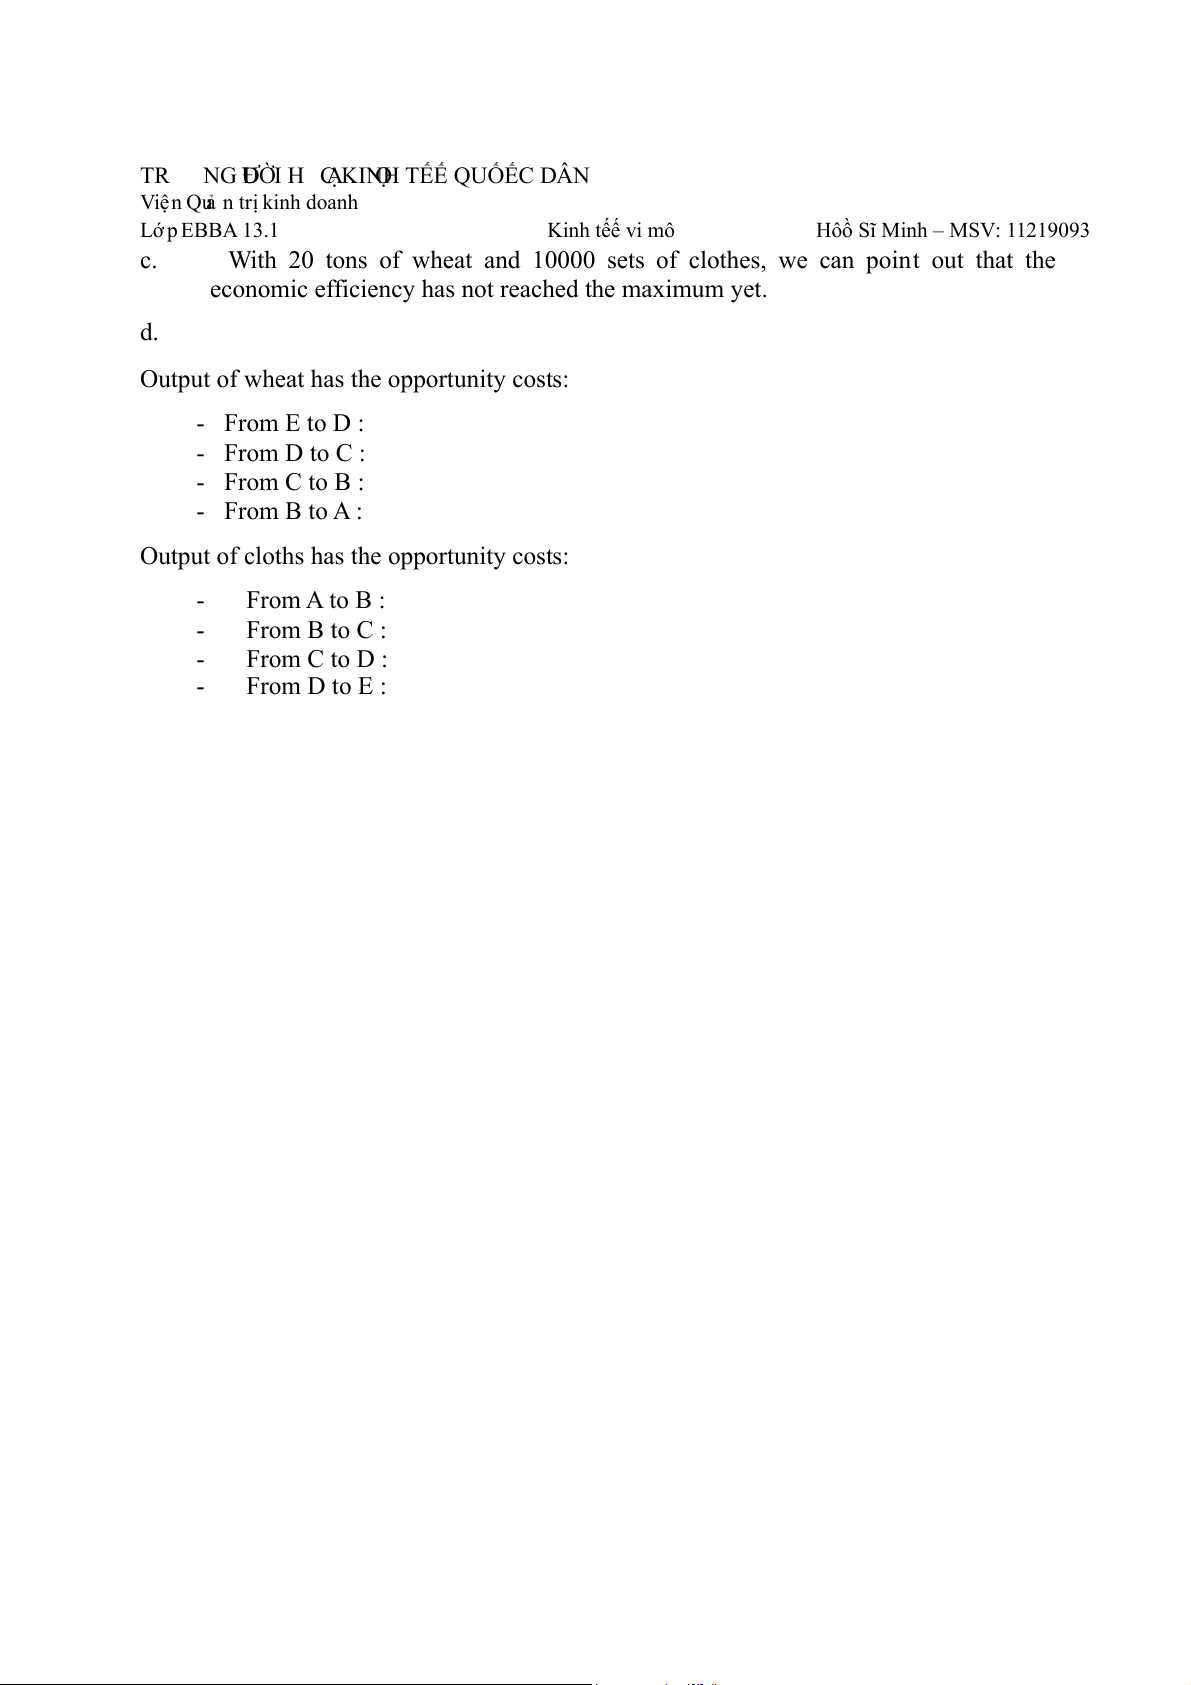
Hôồ Sĩ Minh – MSV: 11219093 c.
With 20 tons of wheat and 10000 sets of clothes, we can point out that the
economic efficiency has not reached the maximum yet. d.
Output of wheat has the opportunity costs: - From E to D : - From D to C : - From C to B : - From B to A :
Output of cloths has the opportunity costs: - From A to B : - From B to C : - From C to D : - From D to E :
Tài liệu liên quan:
-
Tự Luận Vimo: Phân Tích Cung, Cầu và Thị Trường Cạnh Tranh| Microeconomics | Trường Đại học Quốc tế, Đại học Quốc gia Thành phố Hồ Chí Minh
5 3 -
Review Questions: Thinking Like an Economist | Microeconomics | Trường Đại học Quốc tế, Đại học Quốc gia Thành phố Hồ Chí Minh
5 3 -
Final Exam Quizlet Questions & Answers | Microeconomics | Trường Đại học Quốc tế, Đại học Quốc gia Thành phố Hồ Chí Minh
5 3 -
Đề thi giữa kỳ II | Microeconomics | Trường Đại học Quốc tế, Đại học Quốc gia Thành phố Hồ Chí Minh
5 3 -
Final Group Project_ The Beer Industry | Microeconomics | Trường Đại học Quốc tế, Đại học Quốc gia Thành phố Hồ Chí Minh
4 2