Individual Tasks on Opportunity Costs Analysis | Microeconomics | Trường Đại học Quốc tế, Đại học Quốc gia Thành phố Hồ Chí Minh
Tài liệu được sưu tầm và soạn thảo dưới dạng file PDF với mục đích hỗ trợ học tập và tham khảo. Nội dung tài liệu được trình bày rõ ràng, dễ tiếp cận, phù hợp cho việc ôn tập và củng cố kiến thức trong quá trình học đại học. Đây sẽ là nguồn tư liệu hữu ích giúp các bạn sinh viên chuẩn bị tốt hơn cho các buổi học, đồng thời mở rộng thêm hiểu biết về môn học. Hy vọng tài liệu này sẽ mang lại nhiều giá trị và hỗ trợ các bạn trong hành trình học tập. Mời bạn đọc cùng tham khảo!
Môn: Microeconomics 483 tài liệu
Trường: Trường Đại học Quốc tế, Đại học Quốc gia Thành phố Hồ Chí Minh 1.8 K tài liệu
Tác giả:
Preview text:
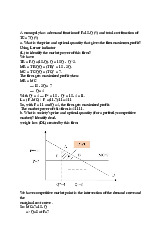
Microeconomics Individual Tasks (1) Exercise 1:
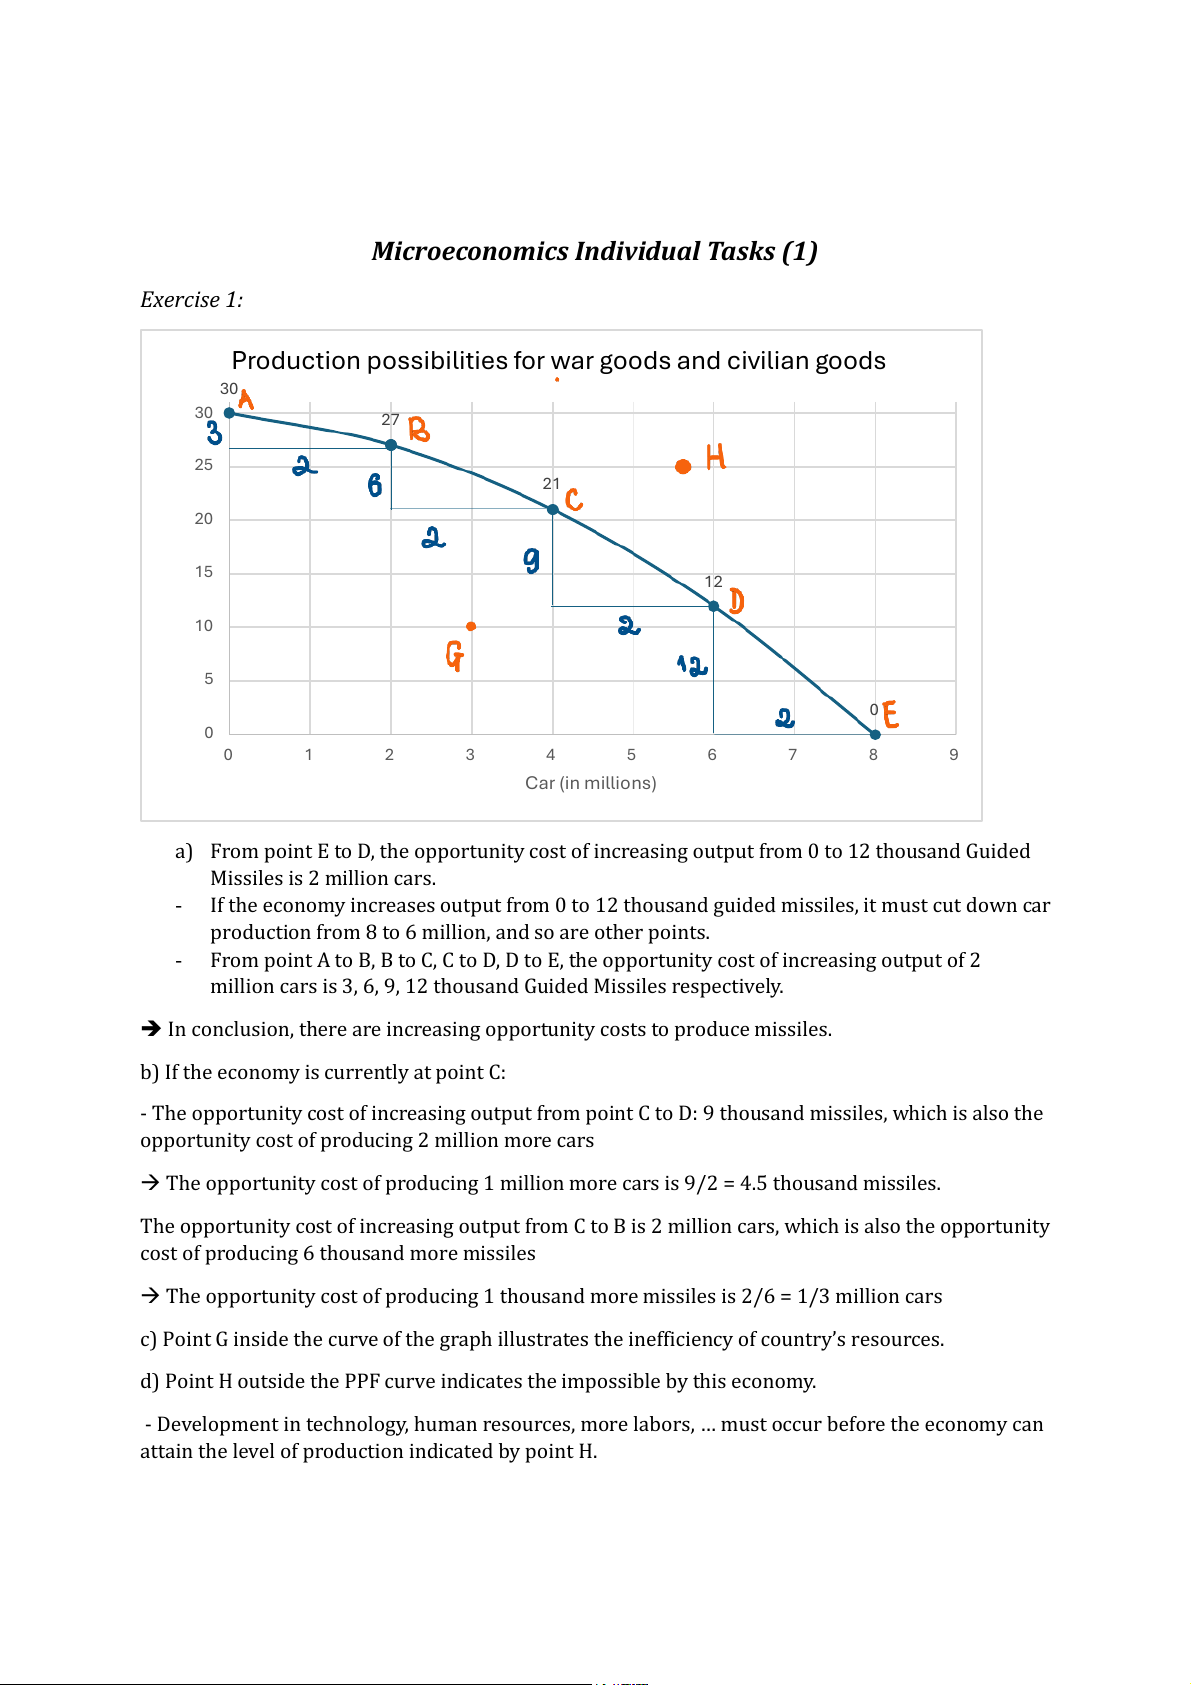
Production possibilities for war goods and civilian goods 30 30 27 s) d 25 21 san u o 20 th 15 12 issiles (in m 10 ed id 5 Gu 0 0 0 1 2 3 4 5 6 7 8 9 Car (in millions)
a) From point E to D, the opportunity cost of increasing output from 0 to 12 thousand Guided Missiles is 2 million cars.
- If the economy increases output from 0 to 12 thousand guided missiles, it must cut down car
production from 8 to 6 million, and so are other points.
- From point A to B, B to C, C to D, D to E, the opportunity cost of increasing output of 2
million cars is 3, 6, 9, 12 thousand Guided Missiles respectively.
➔ In conclusion, there are increasing opportunity costs to produce missiles.
b) If the economy is currently at point C:
- The opportunity cost of increasing output from point C to D: 9 thousand missiles, which is also the
opportunity cost of producing 2 million more cars
→ The opportunity cost of producing 1 million more cars is 9/2 = 4.5 thousand missiles.
The opportunity cost of increasing output from C to B is 2 million cars, which is also the opportunity
cost of producing 6 thousand more missiles
→ The opportunity cost of producing 1 thousand more missiles is 2/6 = 1/3 million cars
c) Point G inside the curve of the graph illustrates the inefficiency of country’s resources.
d) Point H outside the PPF curve indicates the impossible by this economy.
- Development in technology, human resources, more labors, … must occur before the economy can
attain the level of production indicated by point H.
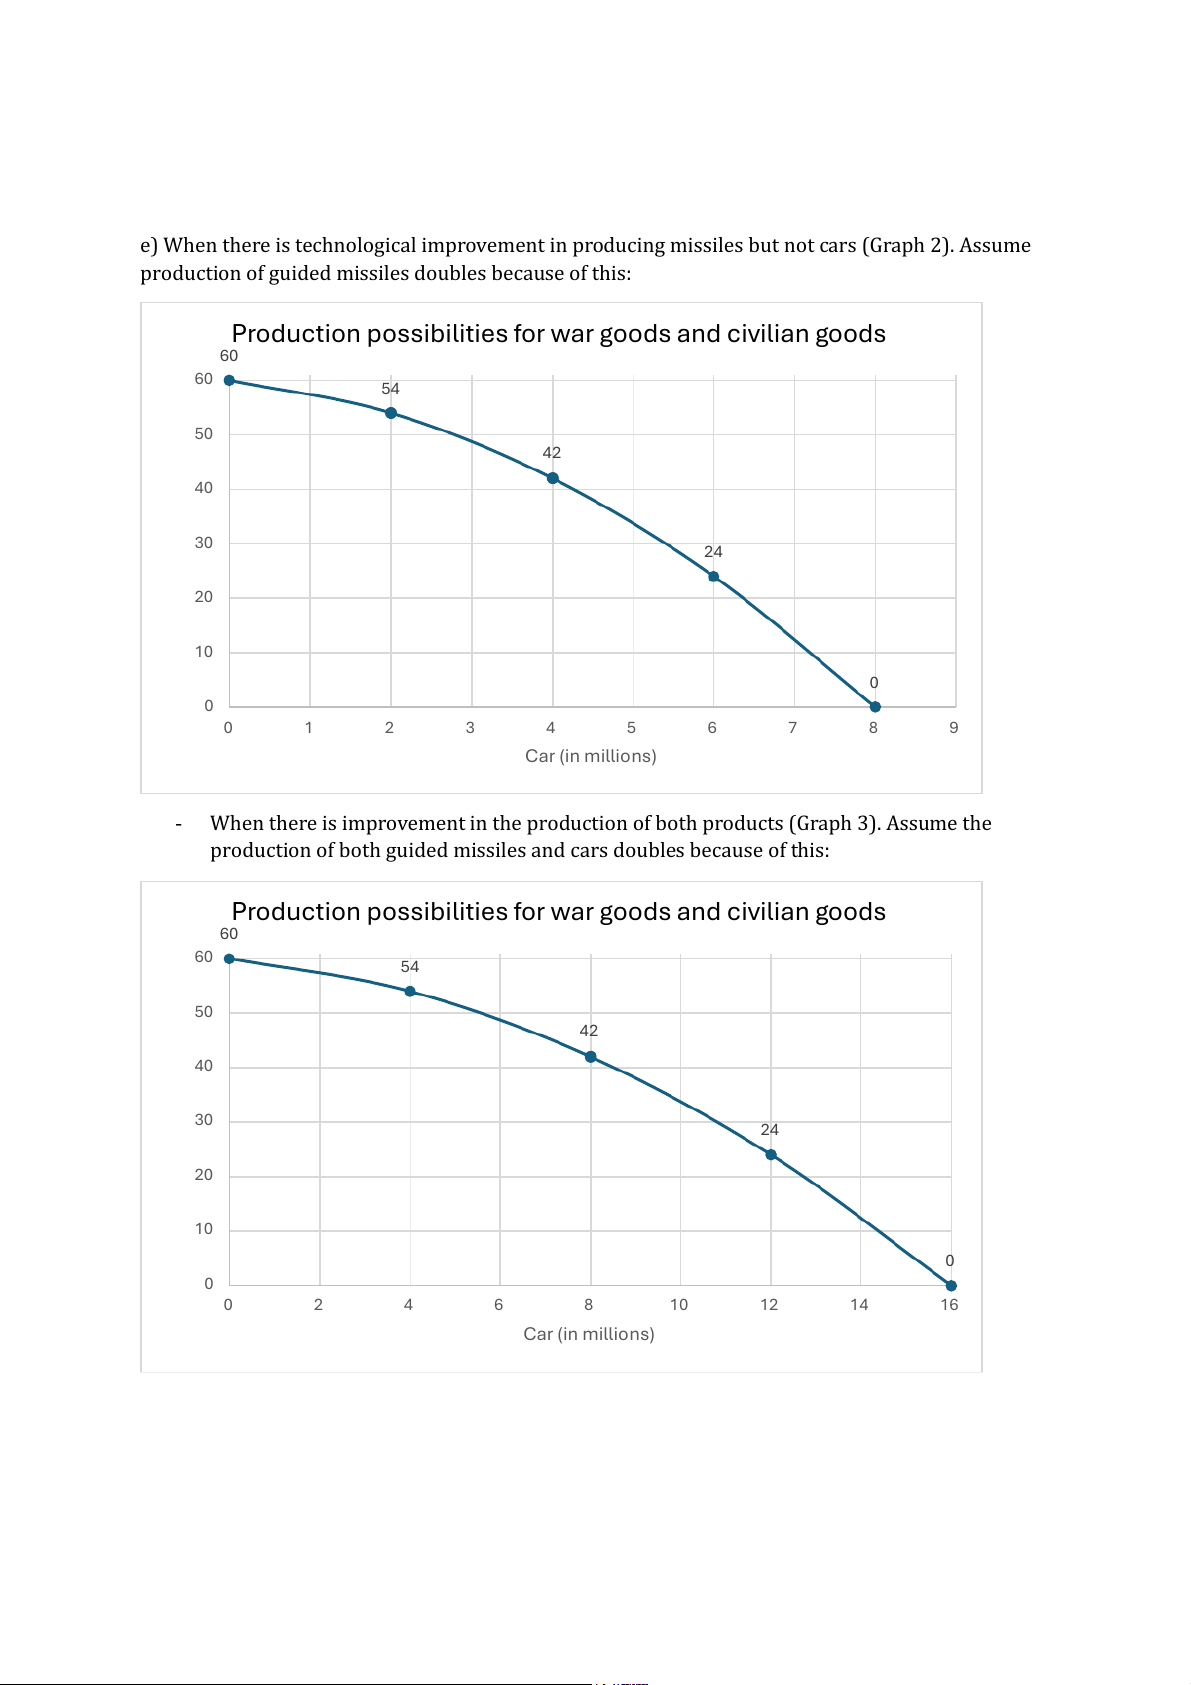
e) When there is technological improvement in producing missiles but not cars (Graph 2). Assume
production of guided missiles doubles because of this:
Production possibilities for war goods and civilian goods 60 60 54 s) d 50 42 san u o 40 th 30 24 issiles (in 20 m ed id 10 Gu 0 0 0 1 2 3 4 5 6 7 8 9 Car (in millions)
- When there is improvement in the production of both products (Graph 3). Assume the
production of both guided missiles and cars doubles because of this:
Production possibilities for war goods and civilian goods 60 60 54 s) d 50 42 san u o 40 th 30 24 issiles (in 20 m ed id 10 Gu 0 0 0 2 4 6 8 10 12 14 16 Car (in millions) Exercise 2: a)
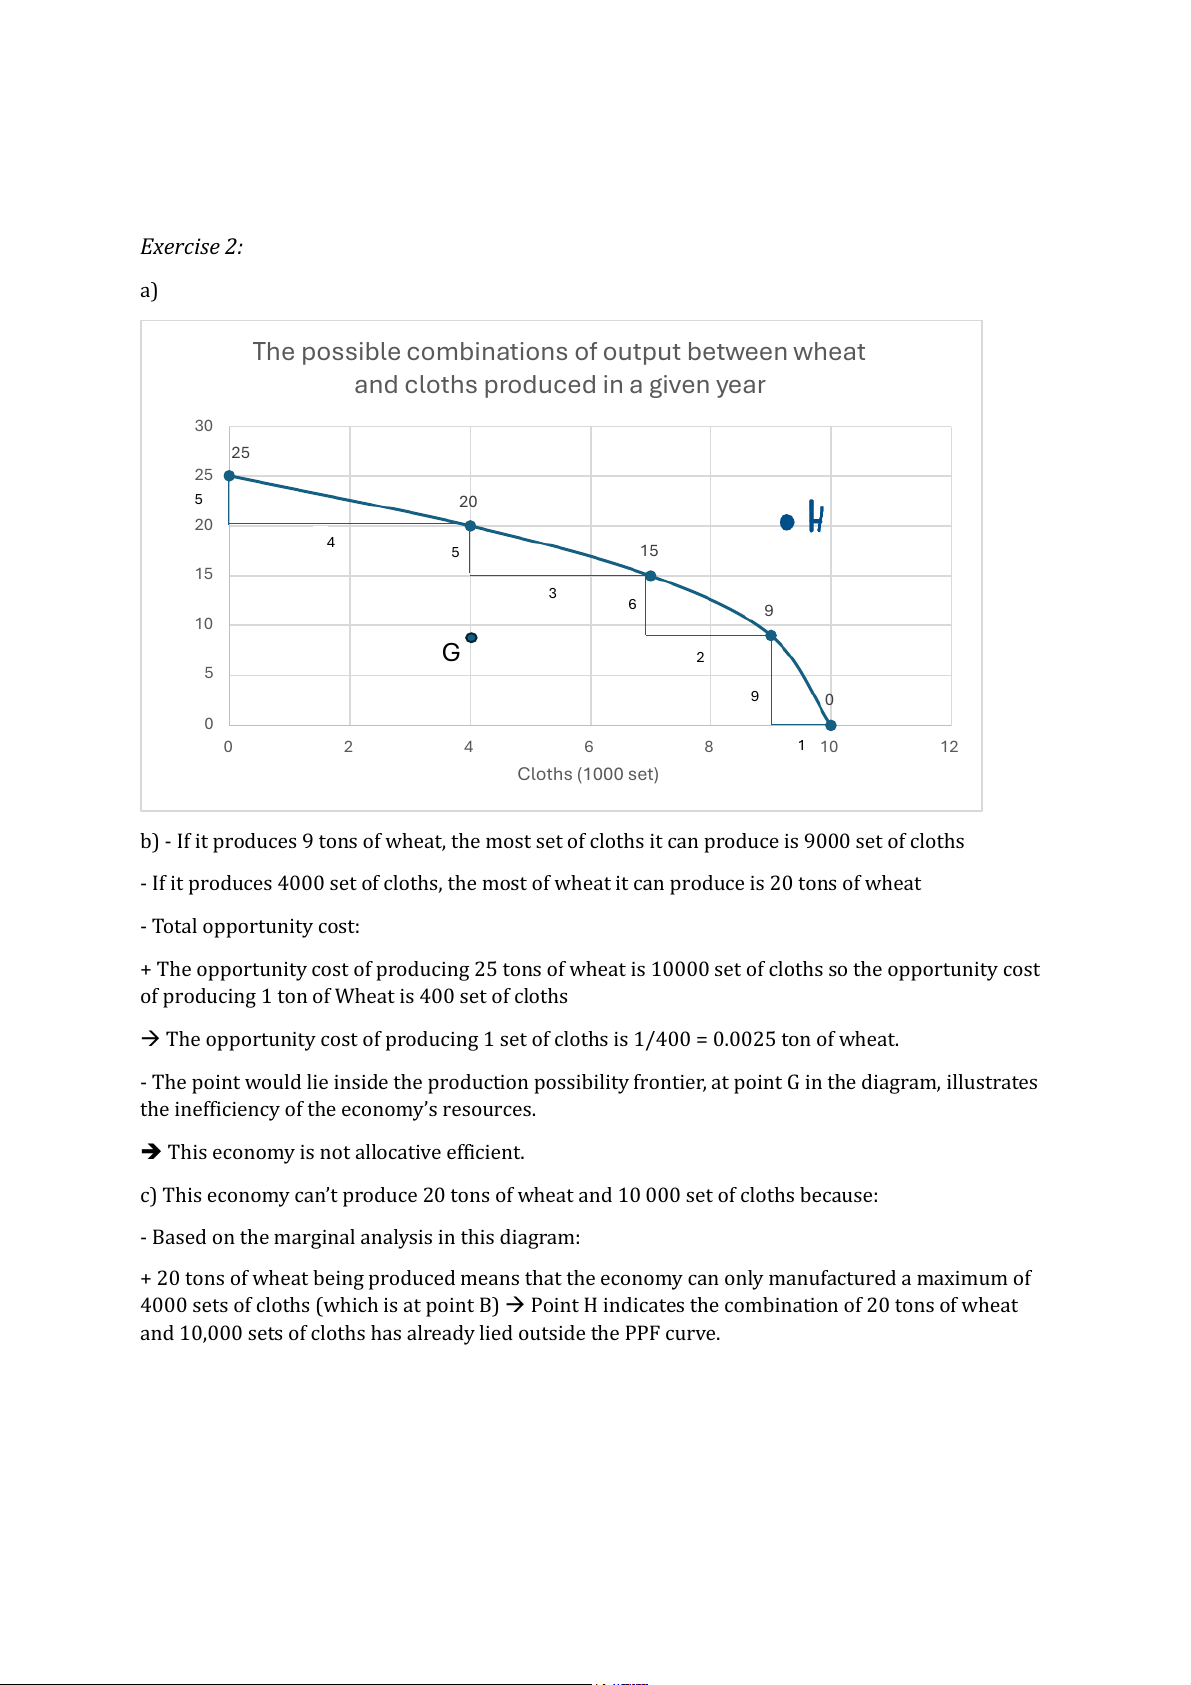
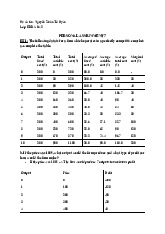
The possible combinations of output between wheat
and cloths produced in a given year 30 25 25 5 20 20 s) n o 4 5 15 15 eat (t 3 h 6 9 W 10 G 2 5 9 0 0 0 2 4 6 8 1 10 12 Cloths (1000 set)
b) - If it produces 9 tons of wheat, the most set of cloths it can produce is 9000 set of cloths
- If it produces 4000 set of cloths, the most of wheat it can produce is 20 tons of wheat - Total opportunity cost:
+ The opportunity cost of producing 25 tons of wheat is 10000 set of cloths so the opportunity cost
of producing 1 ton of Wheat is 400 set of cloths
→ The opportunity cost of producing 1 set of cloths is 1/400 = 0.0025 ton of wheat.
- The point would lie inside the production possibility frontier, at point G in the diagram, illustrates
the inefficiency of the economy’s resources.
➔ This economy is not allocative efficient.
c) This economy can’t produce 20 tons of wheat and 10 000 set of cloths because:
- Based on the marginal analysis in this diagram:
+ 20 tons of wheat being produced means that the economy can only manufactured a maximum of
4000 sets of cloths (which is at point B) → Point H indicates the combination of 20 tons of wheat
and 10,000 sets of cloths has already lied outside the PPF curve. d) Opportunity costs: From point to point Amount of wheat being reduced
Number of cloths being produced (tons) (1000 sets) A - B 5 4 B - C 5 3 C - D 6 2 D - E 9 1 Calculations:
At which point The cost of 1000 more set of cloths The cost of 1 more tons of wheat (tons of wheat) (set of cloth) A 1.25 B 1.67 800 C 3 600 D 9 333 E 111
Tài liệu liên quan:
-
Price Fluctuations of Masks and Oil in Vietnam | Microeconomics | Trường Đại học Quốc tế, Đại học Quốc gia Thành phố Hồ Chí Minh
4 2 -
Competitive Firm Analysis and Cost Calculations | Microeconomics | Trường Đại học Quốc tế, Đại học Quốc gia Thành phố Hồ Chí Minh
5 3 -
Assignment 9: Monopoly Profit Maximization & DWL Analysis | Microeconomics | Trường Đại học Quốc tế, Đại học Quốc gia Thành phố Hồ Chí Minh
5 3 -
Oligopoly and Game Theory Insights | Microeconomics | Trường Đại học Quốc tế, Đại học Quốc gia Thành phố Hồ Chí Minh
7 4