Lab Report Template Môn Electrical Engineering | Trường Đại học Quốc tế, Đại học Quốc gia Thành phố Hồ Chí Minh
Lab Report Template Môn Electrical Engineering. Tài liệu được sưu tầm gồm 9 trang, giúp bạn ôn tập tốt hơn. Mời các bạn đón xem.
Môn: Electrical Engineering 8 tài liệu
Trường: Trường Đại học Quốc tế, Đại học Quốc gia Thành phố Hồ Chí Minh 2 K tài liệu
Tác giả:


Preview text:
lOMoAR cPSD| 58583460
VIETNAM NATIONAL UNIVERSITY – HOCHIMINH CITY
INTERNATIONAL UNIVERSITY
SCHOOL OF ELECTRICAL ENGINEERING COURSE’S NAME [Lab Title Here] Submitted by
[Your name and Your ID number here]
[Your name and Your ID number here] Date Submitted: [insert date] Date Performed: [insert date] Lab Section: [insert section] Course Instructor: [insert instructor] lOMoAR cPSD| 58583460
International University
School of Electrical Engineering
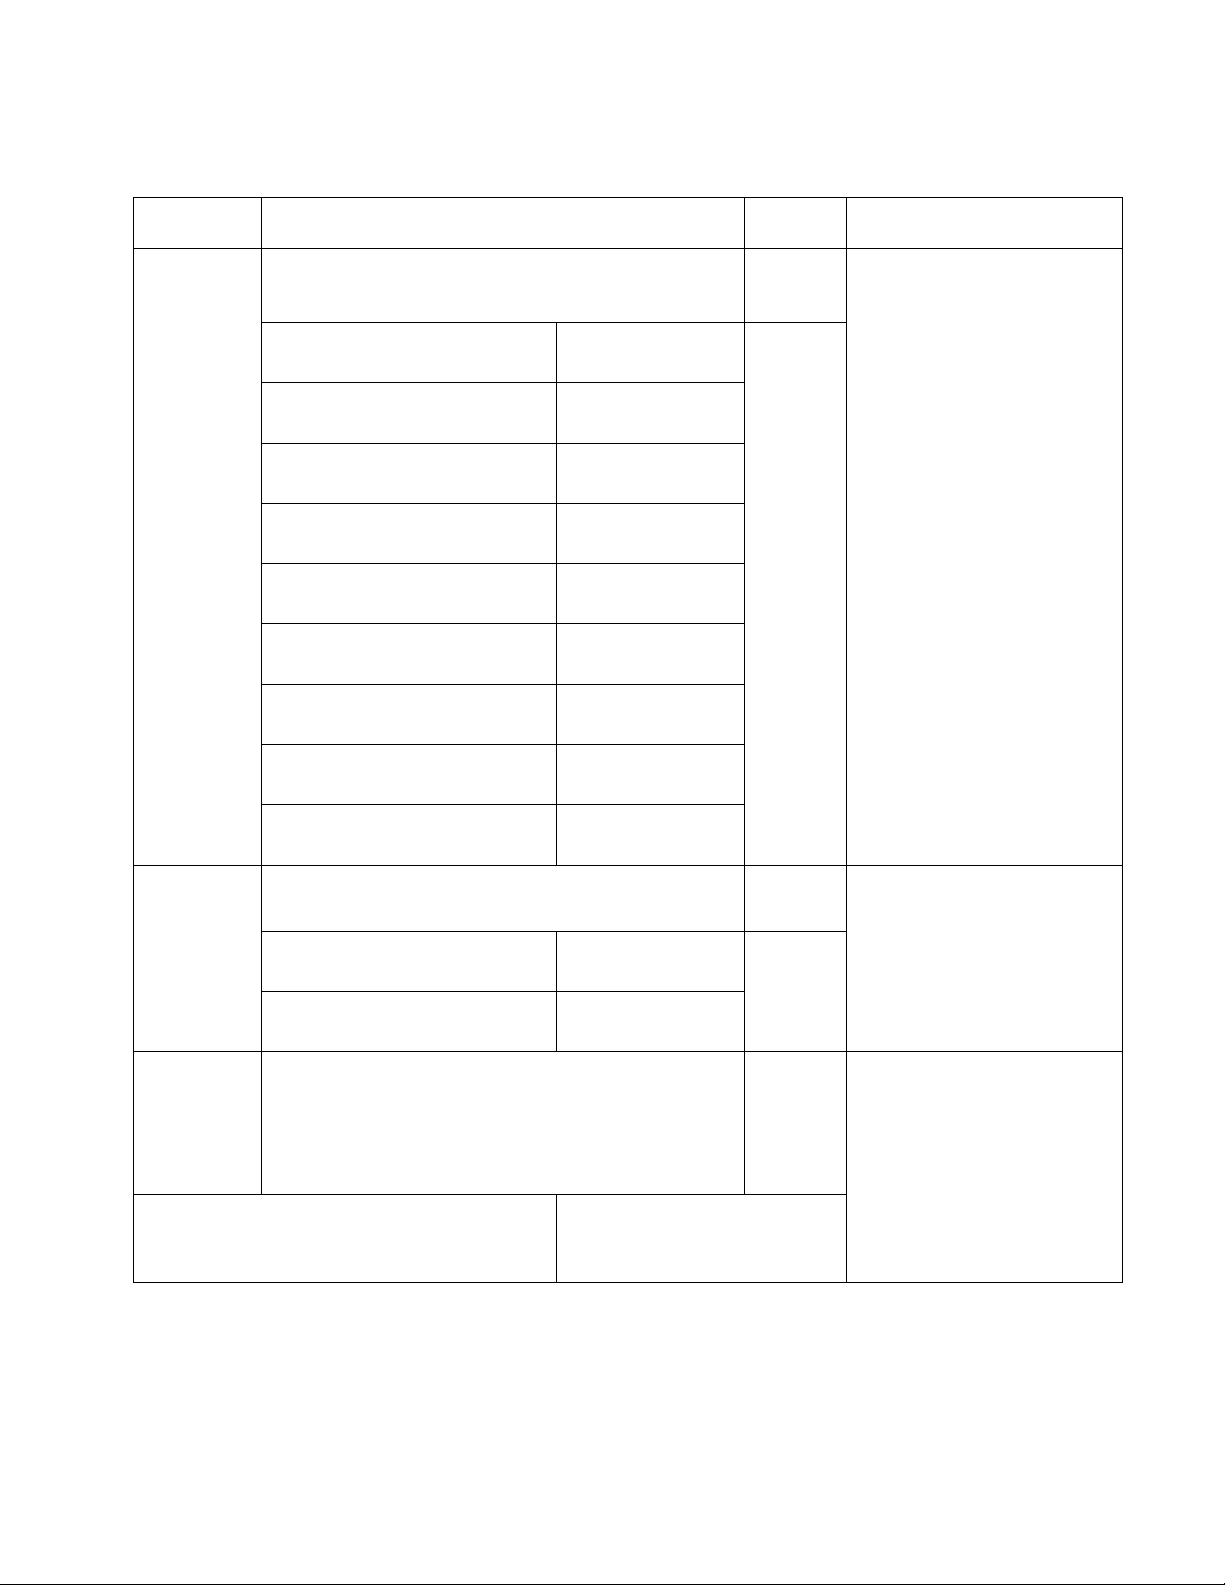
GRADING GUIDELINE FOR LAB REPORT Number Content Score Comment 1 Format (max 9%) - Font type Yes No - Font size Yes No - Lab title Yes No - Page number Yes No - Table of contents Yes No - Header/Footer Yes No
- List of figures (if exists) Yes No
- List of tables (if exists) Yes No - Lab report structure Yes No 2
English Grammar and Spelling (max 6%) - Grammar Yes No - Spelling Yes No 3
Data and Result Analysis (max 85%) Total Score Signature: Date: lOMoAR cPSD| 58583460 Table of Contents List of
Figures.................................................................................................................................. .. I List of
Tables................................................................................................................................... ... I
Nomenclature....................................................................................................................... ........... II
1 Theoretical Background .................................................................................................. 1
2 Experimental Procedure ................................................................................................. 2
2.1 Experiment 1 ................................................................................................................... 2
2.2 Experiment 2 ................................................................................................................... 3
2.3 Experiment 3 ................................................................................................................... 3
3 Experimental Results ...................................................................................................... 3
3.1 Experiment 1 ................................................................................................................... 3
3.2 Experiment 2 ................................................................................................................... 3
3.3 Experiment 3 ................................................................................................................... 3
4 Discussion of Results ...................................................................................................... 3 List of Figures Figure 1: Circuit diagram
1......................................................................................................................... 2 Figure 2: Circuit diagram
2......................................................................................................................... 2 Figure 3: Simulation for experiment
1....................................................................................................3 List of Tables Table 1: Comparison of circuit
parameters...........................................................................................1 lOMoAR cPSD| 58583460
International University
School of Electrical Engineering Table 2: Data of experiment
1.................................................................................................................... 3 Nomenclature I lOMoAR cPSD| 58583460
International University
School of Electrical Engineering
V DD: DC Voltage Source
Vdd: AC Voltage Source Iref: Reference Current Etc. II lOMoAR cPSD| 58583460
International University
School of Electrical Engineering 1 Theoretical Background
In this section, describe the different circuit designs, show mathematical equations, and
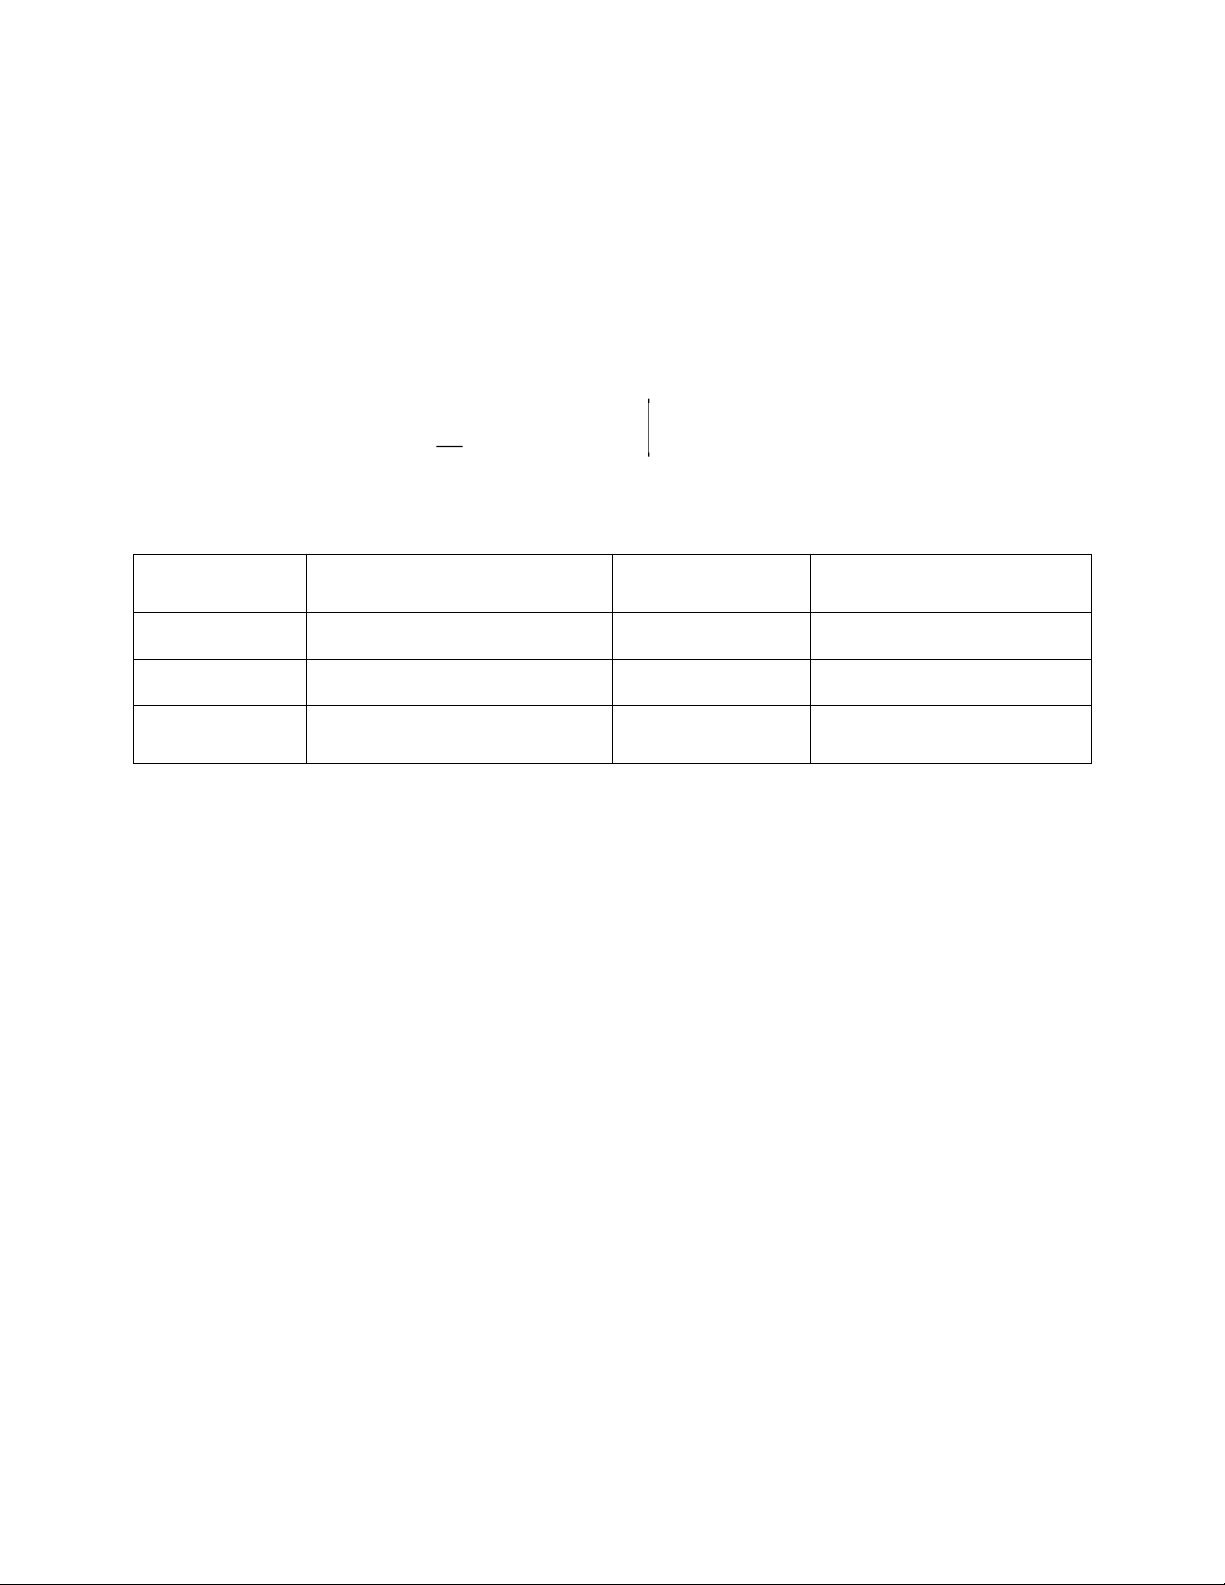
simulated output. When inserting an equation, use the Equation Editor, e.g.: R2 V ] os=V o/ 1+ R1
You should also include schematics, and discuss expected results.
Table 1: Comparison of circuit parameters. Vref Iref Iref2 Circuit 1 0.01 xxx xxx Cirucit 2 0.1 xxx xxx Etc. lOMoAR cPSD| 58583460
International University
School of Electrical Engineering 2 Experimental Procedure
The goal in this section is to explain the experiment well enough that someone else could
repeat the procedure. You should describe what equipment and components are used, how the
equipment is set up, and how the data are collected. A schematic diagram may be necessary to
fully explain the setup – remember – a picture is worth a thousand words. [Schematic of Circuit]
Figure 1: Circuit diagram 1.
In these writing assignments, you should figure out how to appropriately format your text.
You should be using the correct symbols like “”, not “a”. The symbol “” requires the use of
Symbol font. Also, superscripts and subscripts are easily done by selecting the text, and changing
the format. For numbers less than 1, you should remember to type the leading zero, as in “Vin =
0.01V)”. Learn how to insert a Table in the text and format the table borders. Your reports will
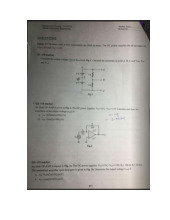
have a more professional character when you take the time to properly format the text. 2.1 Experiment 1
For this experiment, we prepare the circuit as the following figure: [Figure here]
Figure 2: Circuit diagram 2. 2.1.1 Sub-task 1 2.1.2 Sub-task 2 lOMoAR cPSD| 58583460
International University
School of Electrical Engineering 3 2.2 Experiment 2 2.3 Experiment 3 Experimental Results
In this section, describe the results. Remember to refer your reader to specific Figures,
Tables and Appendices where applicable and show your calculations and data manipulation. Note
that it is preferable to have Figures and Tables close to the text where they are discussed. The
goal here is to report the results – NOT to discuss whether they are good or bad results. Usually
the trends in a graph are pointed out, but not fully explained.
The discussion of the trend is saved for the Discussion section. 3.1 Experiment 1
Table 2: Data of experiment 1. [Table here] [Figure here]
Figure 3: Simulation for experiment 1. 3.2 Experiment 2 3.3 Experiment 3 Discussion of Results
In the discussion, you should point out how your experimental results compare with theory,
and suggest and explain reasons for deviations. Discuss the sources of error in this section.
Tài liệu liên quan:
-
Lab 2 Kirchoff’s Current And Voltage Laws | Môn Electrical Engineering - Trường Đại học Quốc tế, Đại học Quốc gia Thành phố Hồ Chí Minh
99 50 -
Lab 7: FET Amplifier Study Guide | Môn Electrical Engineering - Trường Đại học Quốc tế, Đại học Quốc gia Thành phố Hồ Chí Minh
99 50 -
Review Midterm: Differential & Integration Amplifiers Concepts | Môn Electrical Engineering - Trường Đại học Quốc tế, Đại học Quốc gia Thành phố Hồ Chí Minh
108 54 -

Instruction Set Overview: Key Registers and Addressing Modes | Môn Electrical Engineering - Trường Đại học Quốc tế, Đại học Quốc gia Thành phố Hồ Chí Minh
96 48