Lesson on Scarcity, Choice & Opportunity Costs | Microeconomics | Trường Đại học Quốc tế, Đại học Quốc gia Thành phố Hồ Chí Minh
Lesson summary: Scarcity, choice, and opportunity costs Economic resources are scarce. Faced with this scarcity, we must choose how to allocate our resources. Economics is the study of how societies choose to do that. Microeconomics focuses on how individuals, households, and firms make those decisions. Tài liệu được sưu tầm và soạn thảo dưới dạng file PDF để gửi tới các bạn cùng tham khảo, ôn tập đầy đủ kiến thức, chuẩn bị cho các buổi học thật tốt. Mời bạn đọc đón xem!
Môn: Microeconomics 613 tài liệu
Trường: Trường Đại học Quốc tế, Đại học Quốc gia Thành phố Hồ Chí Minh 1.9 K tài liệu
Tác giả:


Preview text:
Lesson summary: Scarcity, choice, and opportunity costs
Economic resources are scarce. Faced with this scarcity, we
must choose how to allocate our resources. Economics is the
study of how societies choose to do that. Microeconomics
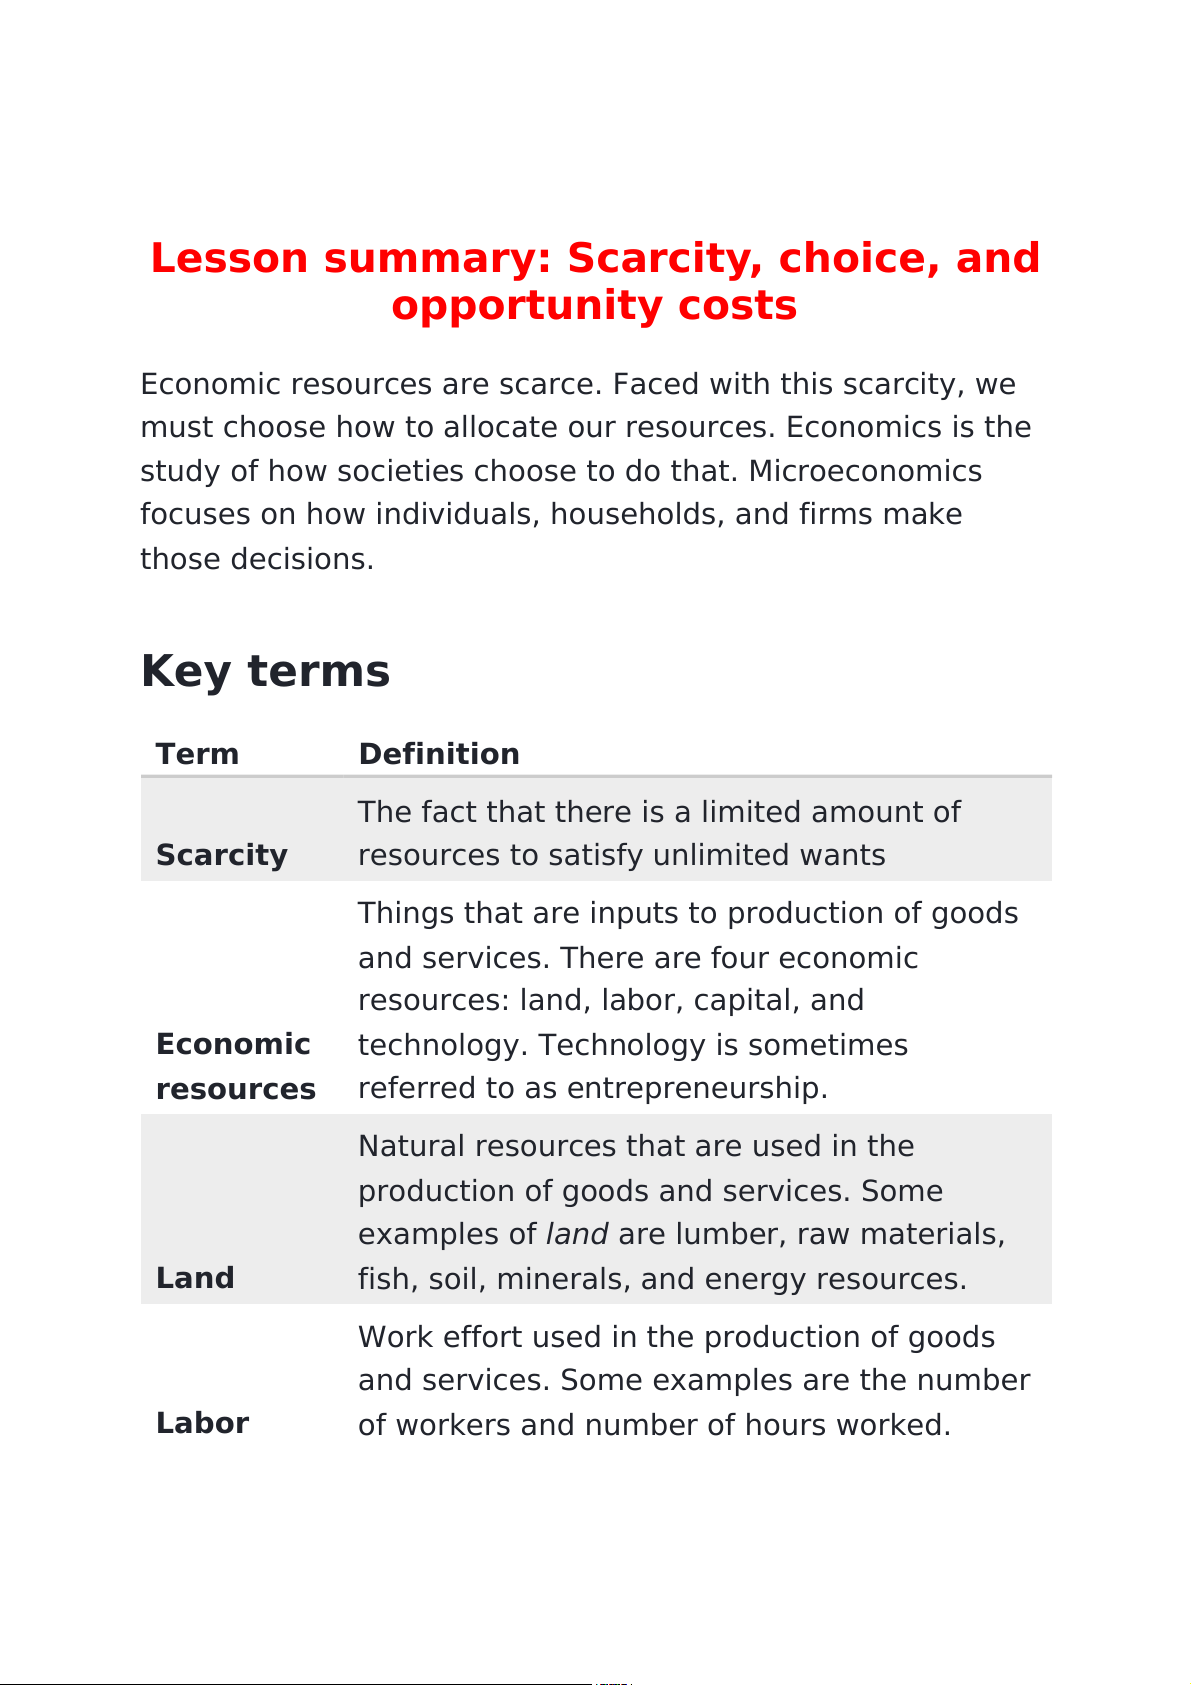
focuses on how individuals, households, and firms make those decisions. Key terms Term Definition
The fact that there is a limited amount of Scarcity
resources to satisfy unlimited wants
Things that are inputs to production of goods
and services. There are four economic
resources: land, labor, capital, and Economic
technology. Technology is sometimes resources
referred to as entrepreneurship.
Natural resources that are used in the
production of goods and services. Some
examples of#land#are lumber, raw materials, Land
fish, soil, minerals, and energy resources.
Work effort used in the production of goods
and services. Some examples are the number Labor
of workers and number of hours worked. Term Definition
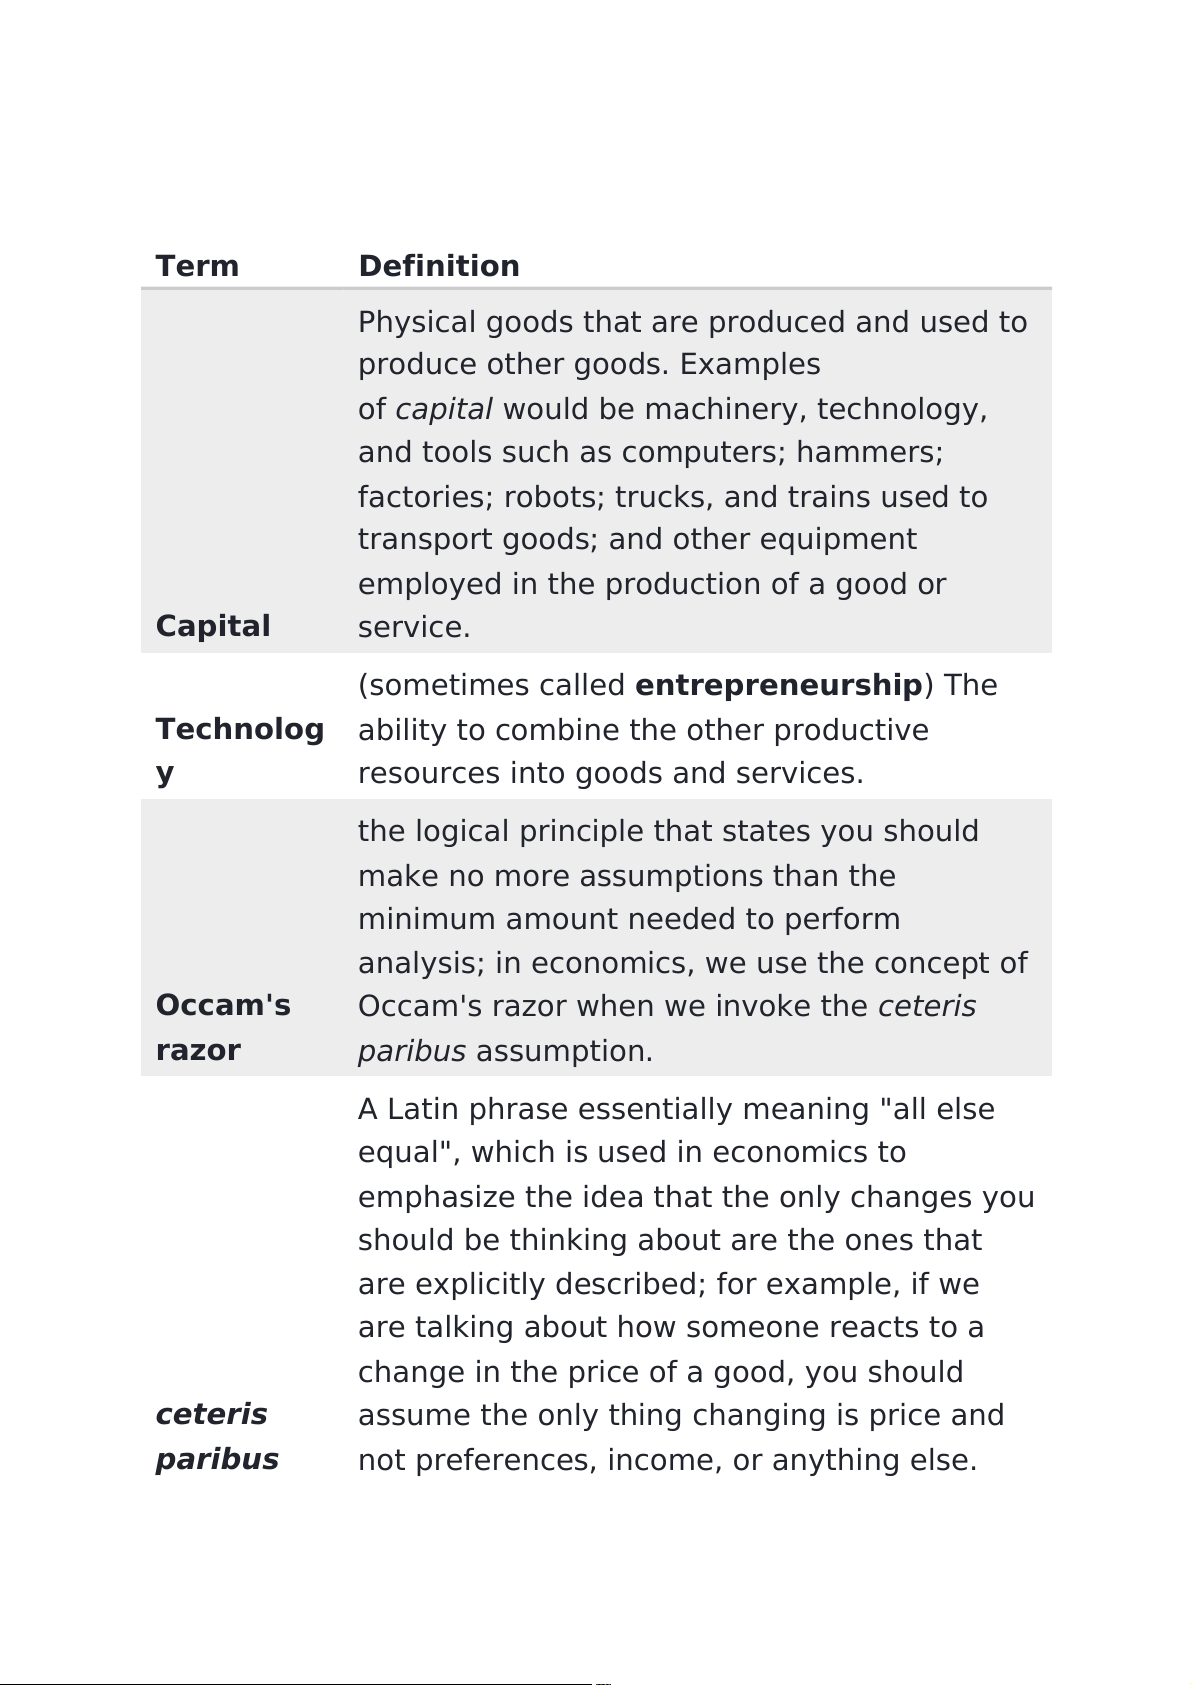
Physical goods that are produced and used to produce other goods. Examples
of#capital#would be machinery, technology,
and tools such as computers; hammers;
factories; robots; trucks, and trains used to
transport goods; and other equipment
employed in the production of a good or Capital service.
(sometimes called#entrepreneurship) The Technolog
ability to combine the other productive y
resources into goods and services.
the logical principle that states you should
make no more assumptions than the
minimum amount needed to perform
analysis; in economics, we use the concept of Occam's
Occam's razor when we invoke the#ceteris razor paribus#assumption.
A Latin phrase essentially meaning "all else
equal", which is used in economics to
emphasize the idea that the only changes you
should be thinking about are the ones that
are explicitly described; for example, if we
are talking about how someone reacts to a
change in the price of a good, you should ceteris
assume the only thing changing is price and paribus
not preferences, income, or anything else. Term Definition normative statement
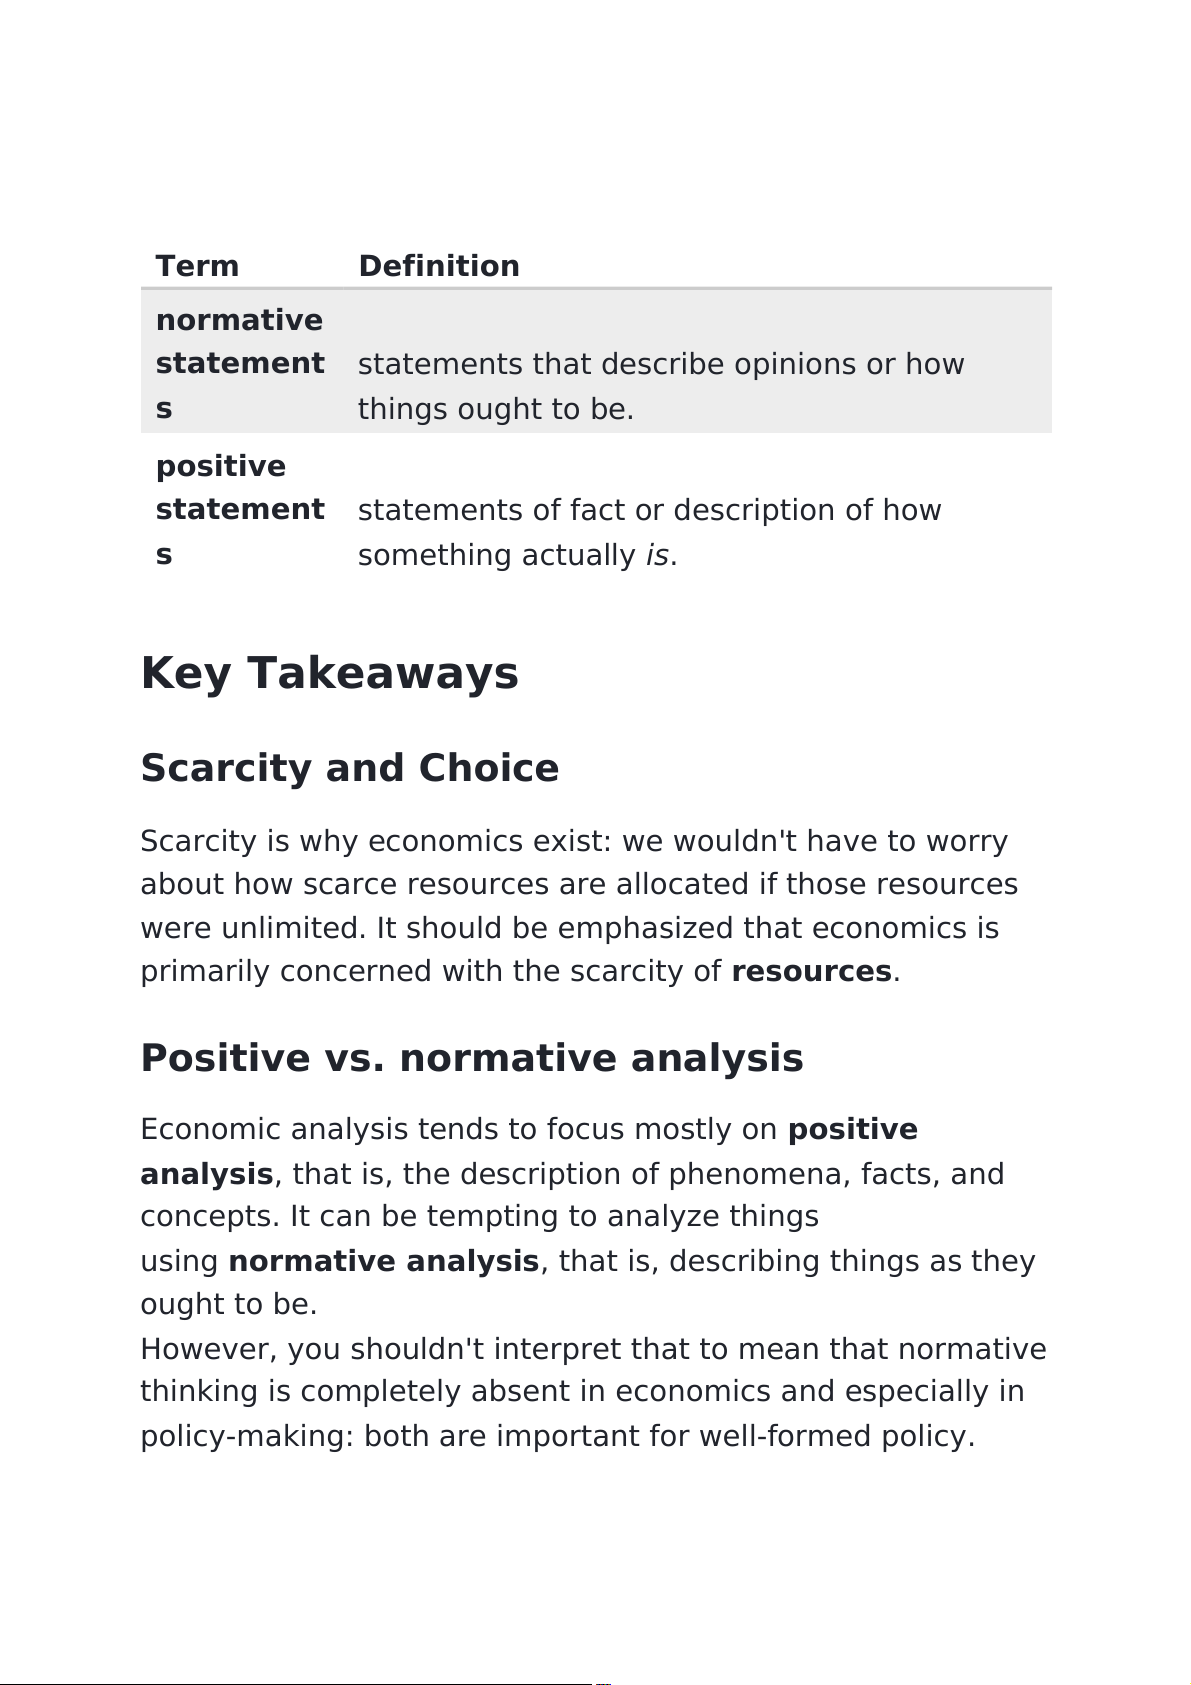
statements that describe opinions or how s things ought to be. positive statement
statements of fact or description of how s something actually#is. Key Takeaways Scarcity and Choice
Scarcity is why economics exist: we wouldn't have to worry
about how scarce resources are allocated if those resources
were unlimited. It should be emphasized that economics is
primarily concerned with the scarcity of#resources.
Positive vs. normative analysis
Economic analysis tends to focus mostly on#positive
analysis, that is, the description of phenomena, facts, and
concepts. It can be tempting to analyze things
using#normative analysis, that is, describing things as they ought to be.#
However, you shouldn't interpret that to mean that normative
thinking is completely absent in economics and especially in
policy-making: both are important for well-formed policy. Economic models
A#model#is a simplification of a concept or process that is
used to better understand that process by cutting away as
much as possible to focus on key aspects. For example, a
map is a model of how roads are laid out and where they
intersect. Maybe there is other useful or interesting
information, like the location of an interesting mural or the
world's best taco stand, but if we are just interested in
getting to the store, we don't need that, we just need to know how to get there.
Economists rely on models because it's impossible to capture
the full complexity of human interaction, let alone try to do it
in a straightforward and easy to read way! Common errors
Not all costs are monetary costs. Opportunity costs are
usually expressed in terms of how much of another
good, service, or activity must be given up in order to
pursue or produce another activity or good.
You might hear the fourth economic resource referred to
as either entrepreneurship or technology. The terms are
used interchangeably but mean the same thing: the
ability to make things happen. Take the example of
computers—a computer itself would be considered a
good, but our ability to make computers would be considered technology.
The word capital is used in everyday language to mean
what economists would call#financial capital. If you see
the word capital on its own in an economics context, it
refers to#physical capital—equipment, machinery, or
tools used to produce goods and services. Physical
capital is tangible, but financial capital isn't always so.
Lesson overview: economic systems,
the role of incentives, and the circular flow model Key terms Term Definition
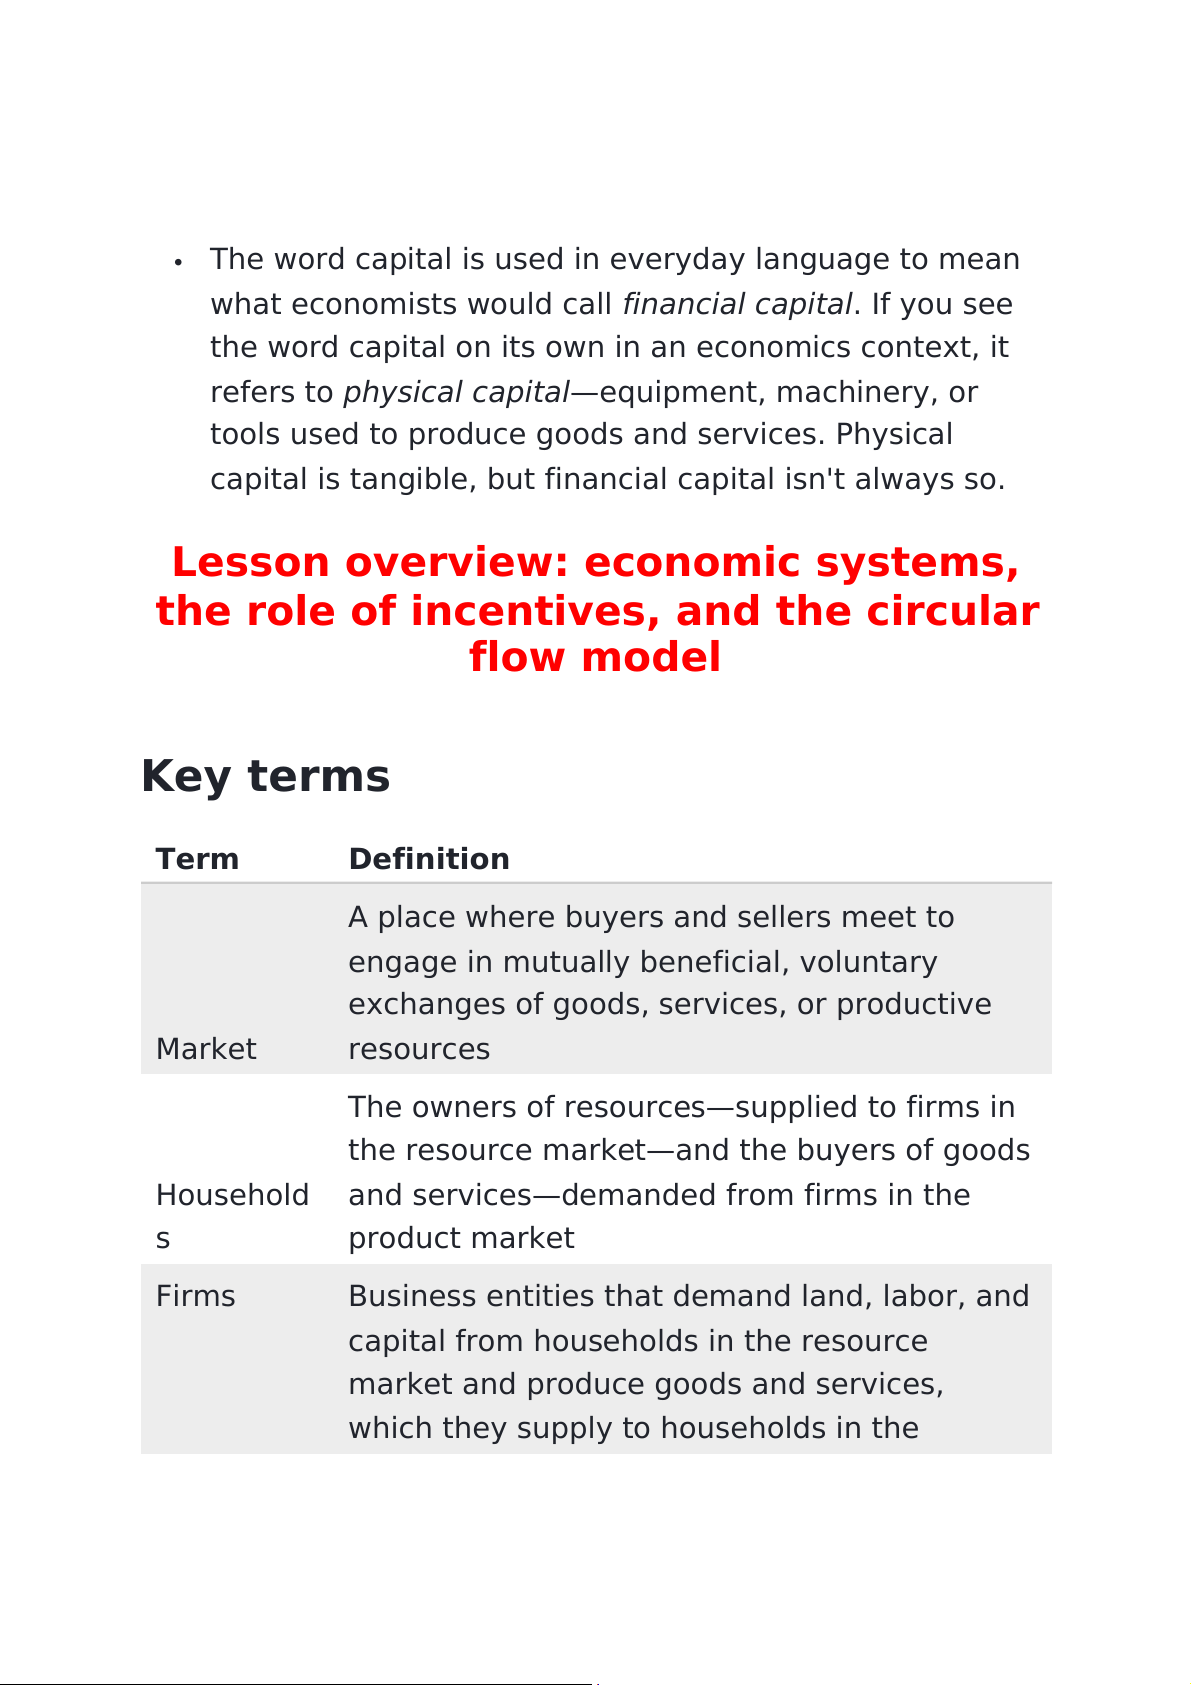
A place where buyers and sellers meet to
engage in mutually beneficial, voluntary
exchanges of goods, services, or productive Market resources
The owners of resources—supplied to firms in
the resource market—and the buyers of goods Household
and services—demanded from firms in the s product market Firms
Business entities that demand land, labor, and
capital from households in the resource
market and produce goods and services,
which they supply to households in the Term Definition product market
Where households supply land, labor, capital, Resource
and entrepreneurship/technology to firms in market exchange for money Product
Where firms supply goods and services to market
households in exchange for money
A system of allocating the means of Economic
production and the goods and services system produced in an economy
The payment firms make to households in Wages exchange for their labor
The payment firms make to households in Rent exchange for land
The payment firms make to households in Interest exchange for capital
The payment to entrepreneurs who start or Profit own businesses
In its purest form, a market economy answers
the three economic questions by allocating Market
resources and goods through markets, where economy prices are generated. Command
In its purest form, a command economy economy
answers the three economic questions by
making allocation decisions centrally by the Term Definition government. Key model
The#circular flow model#illustrates how a market economy
works. In the model, households and firms engage in
mutually beneficial exchanges of resources and products in the market.#
Households are the owners of the factors of production and
sell labor in exchange for a wage, land in exchange for rent,
and capital in exchange for interest. Firms sell goods and
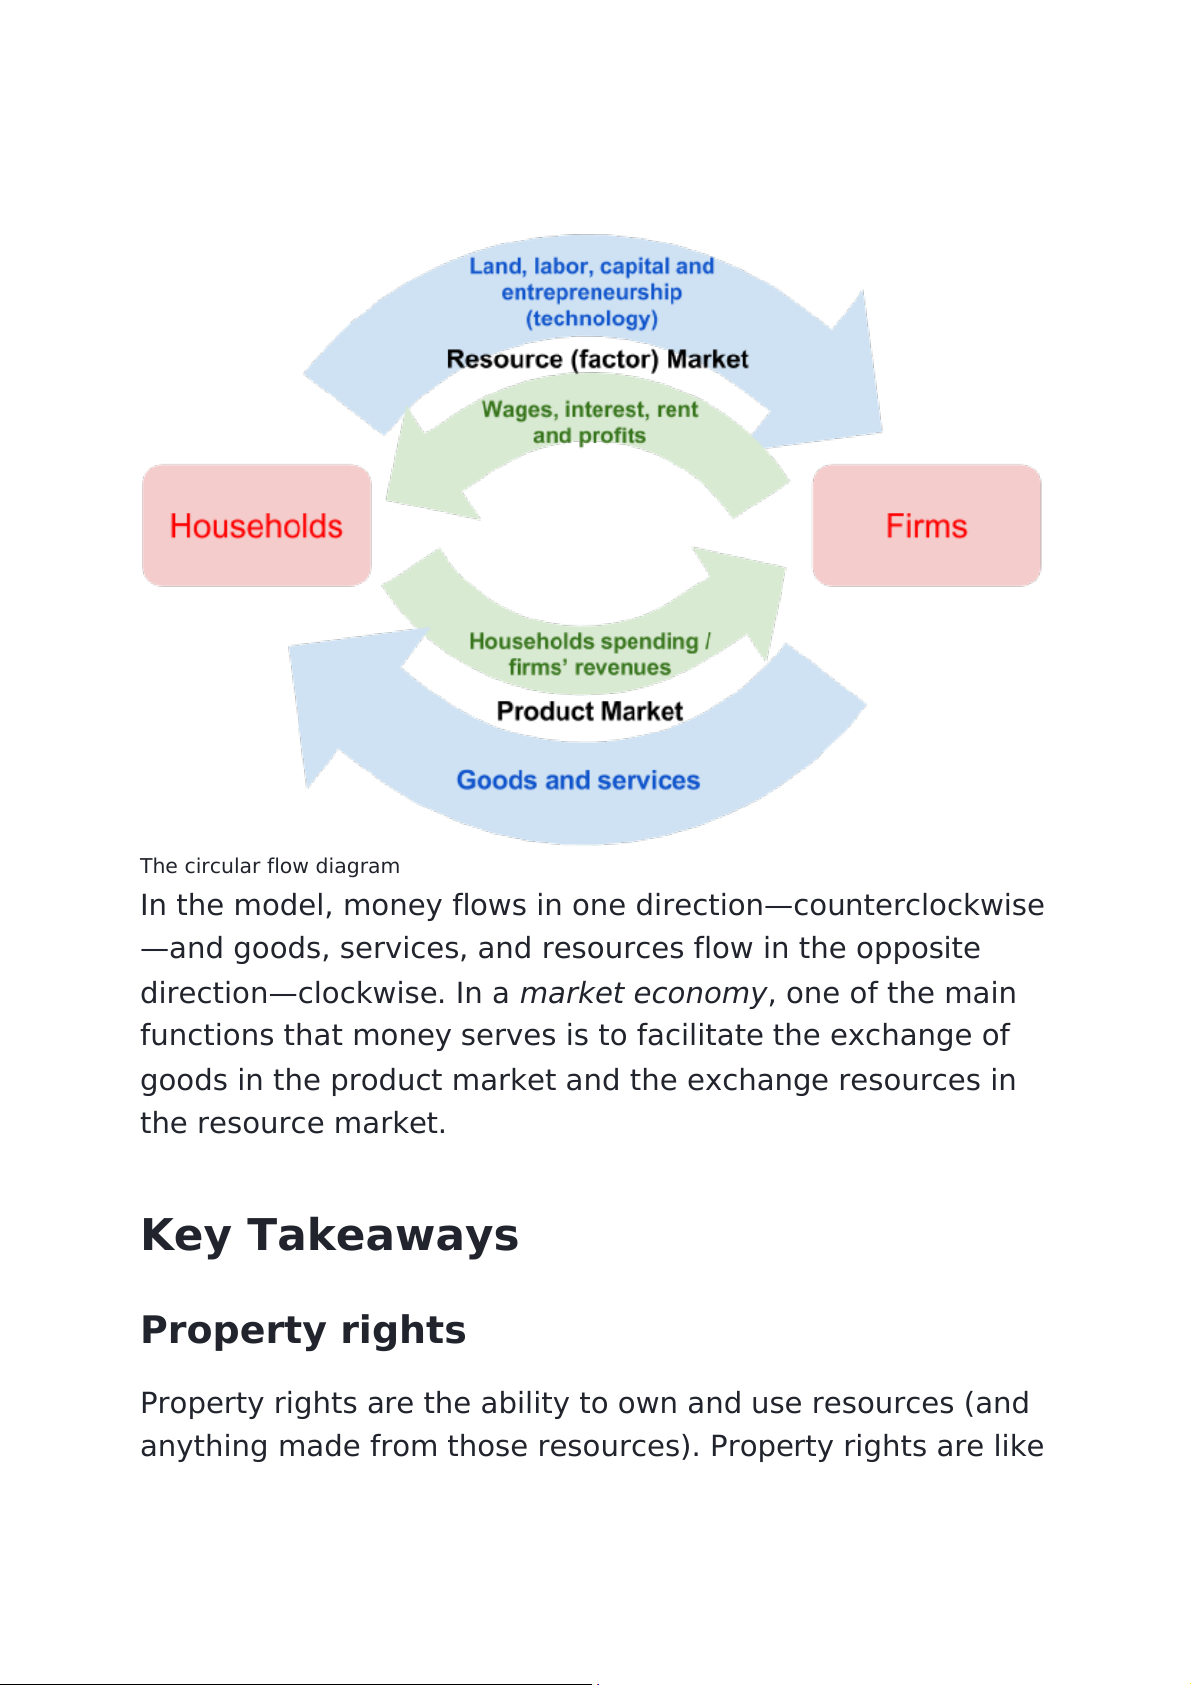
services in exchange for money. In exchang In Agent Sells e for To whom market Household In factor s sell Land For rent To firms markets Household In factor s sell Labor For wage To firms markets Household For In factor s sell Capital interest To firms markets Goods To In and For household product Firms sell services money s markets The circular flow diagram
In the model, money flows in one direction—counterclockwise
—and goods, services, and resources flow in the opposite
direction—clockwise. In a#market economy, one of the main
functions that money serves is to facilitate the exchange of
goods in the product market and the exchange resources in the resource market. Key Takeaways Property rights
Property rights are the ability to own and use resources (and
anything made from those resources). Property rights are like
the rules of a game such as soccer or hide-and-seek. When
everyone knows the rules, and those rules are consistently
enforced, people can focus on playing their best and having fun. Economic systems
An#economic system#is any system of allocating scarce
resources. Economic systems answer three basic questions:
what will be produced, how will it be produced, and how will
the output society produces be distributed?#
There are two extremes of how these questions get
answered. In#command economies, decisions about both
allocation of resources and allocation of production and
consumption are decided by the government. In#market
economies, there is private ownership of resources—
established though property rights—and the factors of
production and consumption are all coordinated through
markets. In a market system, resources are allocated to their
most productive use through prices that are determined in
markets. These prices act as a signal for buyers and sellers.
Most economies are#mixed economies#that lie between these two extremes.
In either system, a rational agent would allocate resources
and production using marginal analysis. In#command
economies, this is more difÏcult to do because without
markets, prices fail at being an effective signal.
The Production Possibilities Frontier, Key Points
The Production Possibilities Frontier (PPF) is a graph that
shows all the different combinations of output of two
goods that can be produced using available resources
and technology. The PPF captures the concepts of
scarcity, choice, and tradeoffs.
The shape of the PPF depends on whether there are
increasing, decreasing, or constant costs.
Points that lie on the PPF illustrate combinations of
output that are#productively efÏcient. We cannot
determine which points are#allocatively
efÏcient#without knowing preferences.
The slope of the PPF indicates the opportunity cost of
producing one good versus the other good, and the
opportunity cost can be compared to the opportunity
costs of another producer to determine comparative advantage.
The Production Possibilities Frontier and Social Choices
Just as individuals cannot have everything they want and
must instead make choices, society as a whole cannot have
everything it might want, either. This section of the chapter
will explain the constraints faced by society, using a model
called the#production possibilities frontier (PPF). There
are more similarities than differences between individual
choice and social choice. As you read this section, focus on the similarities.
Because society has limited resources (e.g., labor, land,
capital, raw materials) at any point in time, there is a limit to
the quantities of goods and services it can produce. Suppose
a society desires two products, healthcare and education.
This situation is illustrated by the production possibilities frontier in this graph.
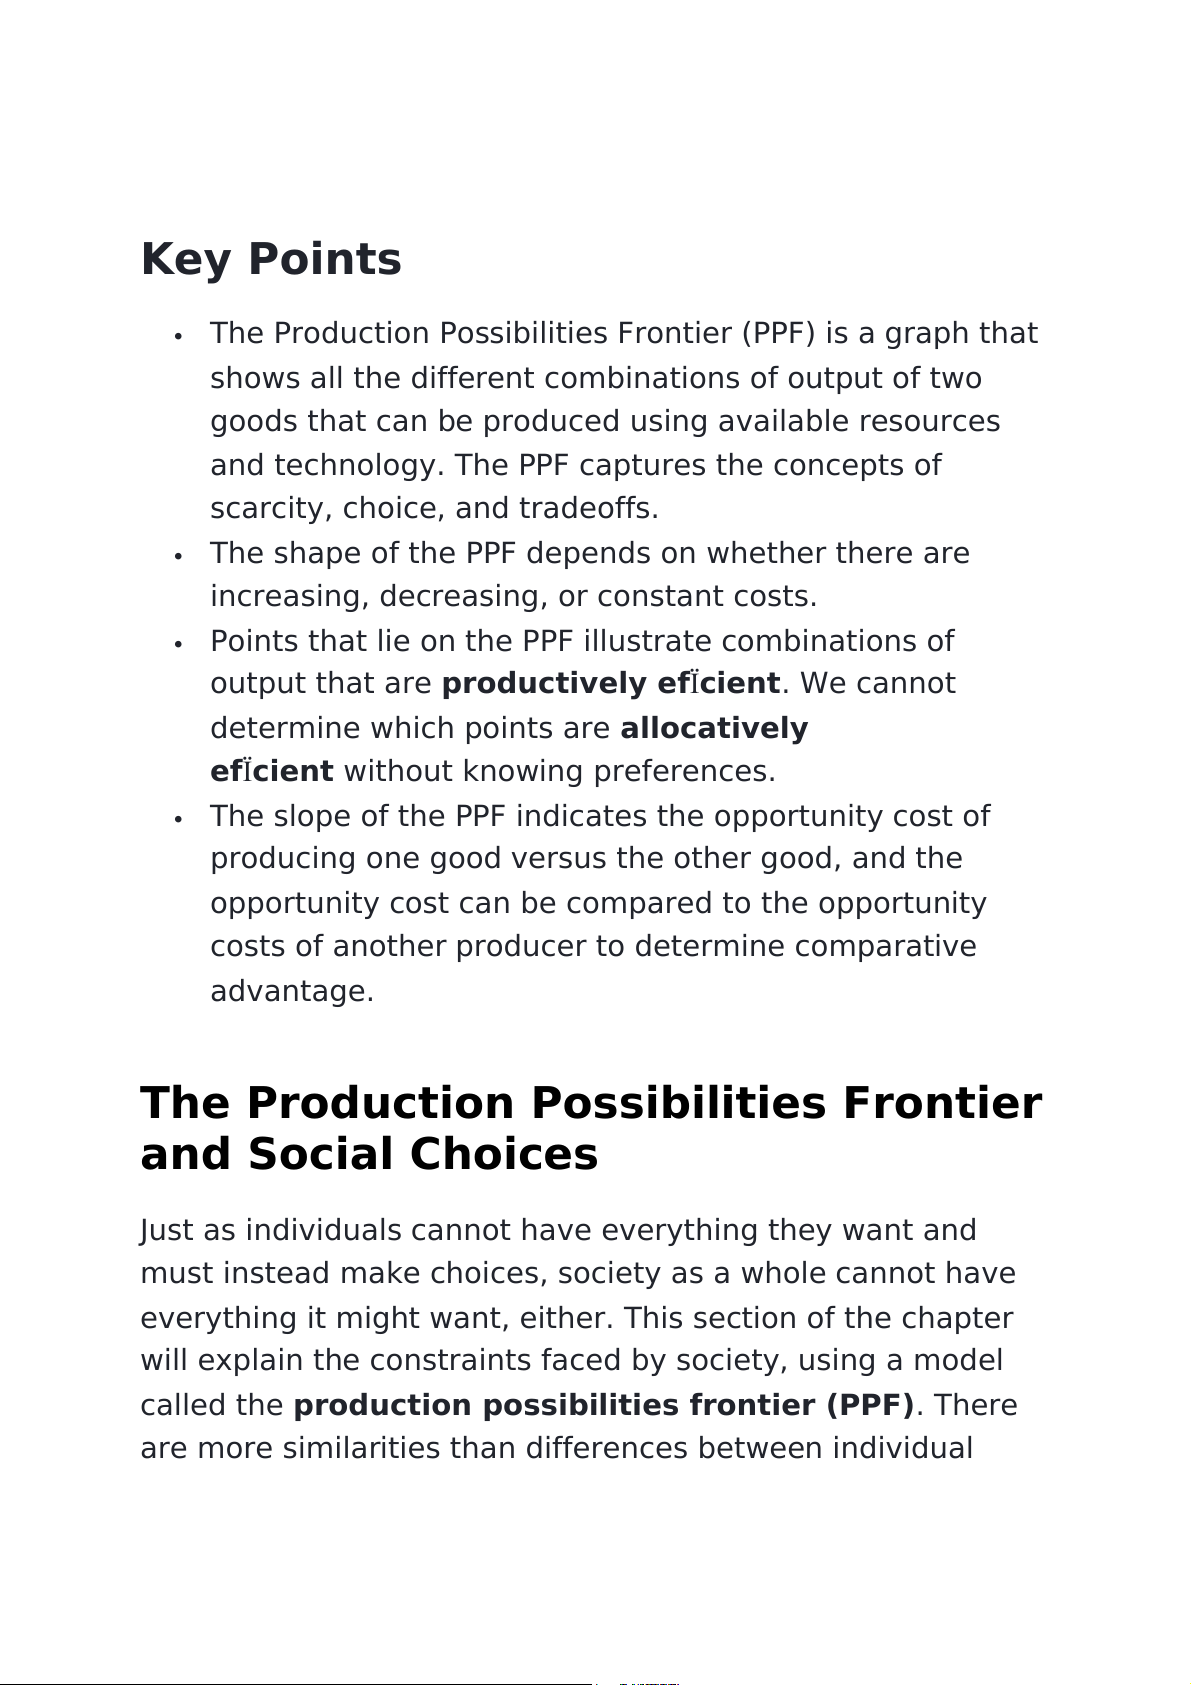
A Healthcare vs. Education Production Possibilities Frontier#
The graph shows that a society has limited resources and
often must prioritize where to invest. On this graph, the y-axis
is ʺHealthcare,ʺ and the x-axis is ʺEducation.ʺ
This production possibilities frontier shows a tradeoff between devoting social resources
to healthcare and devoting them to education. At A all resources go to healthcare and
at B, most go to healthcare. At D most resources go to education, and at F, all go to education.
In the graph, healthcare is shown on the vertical axis and
education is shown on the horizontal axis. If the society were
to allocate all of its resources to healthcare, it could produce
at point A. But it would not have any resources to produce
education. If it were to allocate all of its resources to
education, it could produce at point F. Alternatively, the
society could choose to produce any combination of
healthcare and education shown on the production
possibilities frontier. In effect, the production possibilities
frontier plays the same role for society as the budget
constraint plays for Alphonso. Society can choose any
combination of the two goods on or inside the PPF. But it does
not have enough resources to produce outside the PPF.
Most important, the production possibilities frontier clearly
shows the tradeoff between healthcare and education.
Suppose society has chosen to operate at point B, and it is
considering producing more education. Because the PPF is
downward sloping from left to right, the only way society can
obtain more education is by giving up some healthcare. That
is the tradeoff society faces. Suppose it considers moving
from point B to point C. What would the opportunity cost be
for the additional education? The opportunity cost would be
the healthcare society has to give up. Just as with Alphonso’s
budget constraint, the opportunity cost is shown by
the#slope#of the production possibilities frontier. By now you
might be saying, “Hey, this PPF is sounding like the budget
constraint.” If so, read the following Clear It Up feature.
The Shape of the PPF and the Law of Diminishing Returns
The budget constraints presented earlier in this chapter,
showing individual choices about what quantities of goods to
consume, were all straight lines. The reason for these straight
lines was that the slope of the budget constraint was
determined by the relative prices of the two goods in
the#consumption budget constraint. However, the
production possibilities frontier for healthcare and education
was drawn as a curved line. Why does the PPF have a different shape?
To understand why the PPF is curved, start by considering
point A at the top left-hand side of the PPF. At point A, all
available resources are devoted to healthcare and no
resources are left for education. This situation would be
extreme and even ridiculous. For example, children are
seeing a doctor every day, whether they are sick or not, but
not attending school. People are having cosmetic surgery on
every part of their bodies, but no high school or college
education exists. Now imagine that some of these resources
are diverted from healthcare to education, so that the
economy is at point B instead of point A. Diverting some
resources away from A to B causes relatively little reduction
in health because the last few marginal dollars going into
healthcare services are not producing much additional gain in
health. However, putting those marginal dollars into
education, which is completely without resources at point A,
can produce relatively large gains. For this reason, the shape
of the PPF from A to B is relatively flat, representing a
relatively small drop-off in health and a relatively large gain in education.
Now consider the other end, at the lower right, of the
production possibilities frontier. Imagine that society starts at
choice D, which is devoting nearly all resources to education
and very few to healthcare, and moves to point F, which is
devoting#all#spending to education and none to healthcare.
For the sake of concreteness, you can imagine that in the
movement from D to F, the last few doctors must become
high school science teachers, the last few nurses must
become school librarians rather than dispensers of
vaccinations, and the last few emergency rooms are turned
into kindergartens. The gains to education from adding these
last few resources to education are very small. However, the
opportunity cost lost to health will be fairly large, and thus
the slope of the PPF between D and F is steep, showing a
large drop in health for only a small gain in education.
The lesson is not that society is likely to make an extreme
choice like devoting no resources to education at point A or
no resources to health at point F. Instead, the lesson is that
the gains from committing additional marginal resources to
education depend on how much is already being spent. If on
the one hand, very few resources are currently committed to
education, then an increase in resources used can bring
relatively large gains. On the other hand, if a large number of
resources are already committed to education, then
committing additional resources will bring relatively smaller gains.
This pattern is common enough that it has been given a
name: the#law of diminishing returns, which holds that as
additional increments of resources are added to a certain
purpose, the marginal benefit from those additional
increments will decline. When government spends a certain
amount more on reducing crime, for example, the original
gains in reducing crime could be relatively large. But
additional increases typically cause relatively smaller
reductions in crime, and paying for enough police and
security to reduce crime to nothing at all would be tremendously expensive.
The curvature of the production possibilities frontier shows
that as additional resources are added to education, moving
from left to right along the horizontal axis, the original gains
are fairly large, but gradually diminish. Similarly, as
additional resources are added to healthcare, moving from
bottom to top on the vertical axis, the original gains are fairly
large, but again gradually diminish. In this way, the law of
diminishing returns produces the outward-bending shape of
the production possibilities frontier.
Productive EfÏciency and Allocative EfÏciency
The study of economics does not presume to tell a society
what choice it#should#make along its production possibilities
frontier. In a market-oriented economy, the choice will
involve a mixture of decisions by individuals, firms, and
government. However, economics can point out that some
choices are unambiguously better than others. This
observation is based on the concept of efÏciency. In everyday
usage, efÏciency refers to lack of waste. An inefÏcient
machine operates at high#cost, while an efÏcient machine
operates at lower cost, because it is not wasting energy or
materials. An inefÏcient organization operates with long
delays and high costs, while an efÏcient organization meets
schedules, is focused, and performs within budget.
The production possibilities frontier can illustrate two kinds of
efÏciency: productive efÏciency and allocative efÏciency. The
following graph illustrates these ideas using a production
possibilities frontier between healthcare and education.
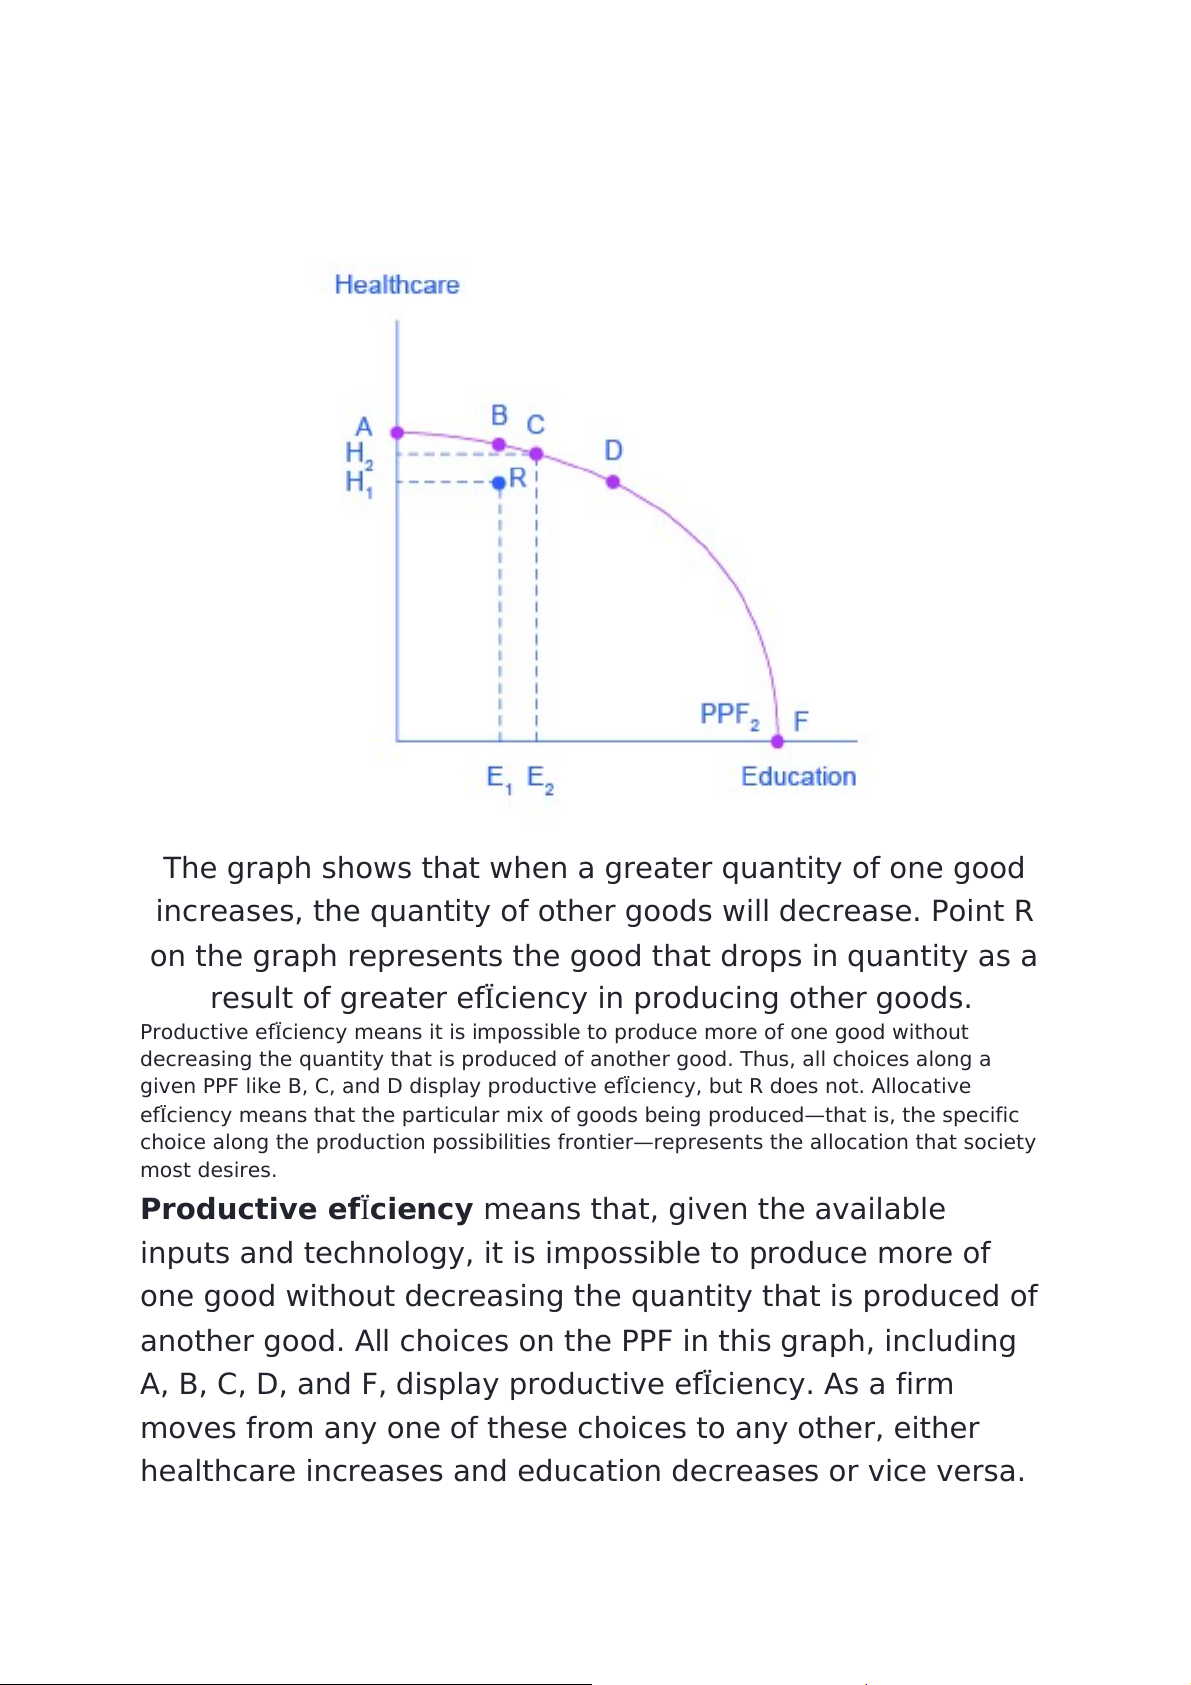
Productive and Allocative EfÏciency#
The graph shows that when a greater quantity of one good
increases, the quantity of other goods will decrease. Point R
on the graph represents the good that drops in quantity as a
result of greater efÏciency in producing other goods.
Productive efÏciency means it is impossible to produce more of one good without
decreasing the quantity that is produced of another good. Thus, all choices along a
given PPF like B, C, and D display productive efÏciency, but R does not. Allocative
efÏciency means that the particular mix of goods being produced—that is, the specific
choice along the production possibilities frontier—represents the allocation that society most desires.
Productive efÏciency#means that, given the available
inputs and technology, it is impossible to produce more of
one good without decreasing the quantity that is produced of
another good. All choices on the PPF in this graph, including
A, B, C, D, and F, display productive efÏciency. As a firm
moves from any one of these choices to any other, either
healthcare increases and education decreases or vice versa.
However, any choice inside the production possibilities
frontier is productively inefÏcient and wasteful because it is
possible to produce more of one good, the other good, or
some combination of both goods.
For example, point R is productively inefÏcient because it is
possible at choice C to have more of both goods: education
on the horizontal axis is higher at point C than point R (E2 is
greater than E1), and healthcare on the vertical axis is also
higher at point C than point R (H2 is great than H1).
The particular mix of goods and services being produced—
that is, the specific combination of healthcare and education
chosen along the production possibilities frontier—can be
shown as a ray (line) from the origin to a specific point on the
PPF. Output mixes that had more healthcare (and less
education) would have a steeper ray, while those with more
education (and less healthcare) would have a flatter ray.
Allocative efÏciency#means that the particular mix of goods
a society produces represents the combination that society
most desires. How to determine what a society desires can
be a controversial question, and is usually discussed in
political science, sociology, and philosophy classes as well as
in economics. At its most basic, allocative efÏciency means
producers supply the quantity of each product that
consumers demand. Only one of the productively efÏcient
choices will be the allocatively efÏcient choice for society as a whole. Why Society Must Choose
Every economy faces two situations in which it may be able
to expand consumption of all goods. In the first case, a
society may discover that it has been using its resources
inefÏciently, in which case by improving efÏciency and
producing on the production possibilities frontier, it can have
more of all goods (or at least more of some and less of none).
In the second case, as resources grow over a period of years
(e.g., more labor and more capital), the economy grows. As it
does, the production possibilities frontier for a society will
shift outward and society will be able to afford more of all goods.
But improvements in productive efÏciency take time to
discover and implement, and economic growth happens only
gradually. So, a society must choose between tradeoffs in the
present. For government, this process often involves trying to
identify where additional spending could do the most good
and where reductions in spending would do the least harm.
At the individual and#firm#level, the#market
economy#coordinates a process in which firms seek to
produce goods and services in the quantity, quality, and price
that people want. But for both the government and the
market economy in the short term, increases in production of
one good typically mean offsetting decreases somewhere else in the economy. The PPF and Comparative Advantage
While every society must choose how much of each good it
should produce, it does not need to produce every single
good it consumes. Often how much of a good a country
decides to produce depends on how expensive it is to
produce it versus buying it from a different country. As we
saw earlier, the curvature of a country’s PPF gives us
information about the tradeoff between devoting resources to
producing one good versus another. In particular, its slope
gives the opportunity cost of producing one more unit of the
good in the x-axis in terms of the other good (in the y-axis).
Countries tend to have different opportunity costs of
producing a specific good, either because of different
climates, geography, technology or skills.#
Suppose two countries, the US and Brazil, need to decide how
much they will produce of two crops: sugar cane and wheat.
Due to its climatic conditions, Brazil can produce a lot of
sugar cane per acre but not much wheat. Conversely, the
U.S. can produce a lot of wheat per acre, but not much sugar
cane. Clearly, Brazil has a lower opportunity cost of producing
sugar cane (in terms of wheat) than the U.S. The reverse is
also true; the U.S. has a lower opportunity cost of producing
wheat than Brazil. This can be illustrated by the PPFs of the
two countries in the following graphs.
Production Possibility Frontier for the U.S. and Brazil#
Tài liệu liên quan:
-
Tự Luận Vimo: Phân Tích Cung, Cầu và Thị Trường Cạnh Tranh| Microeconomics | Trường Đại học Quốc tế, Đại học Quốc gia Thành phố Hồ Chí Minh
5 3 -
Review Questions: Thinking Like an Economist | Microeconomics | Trường Đại học Quốc tế, Đại học Quốc gia Thành phố Hồ Chí Minh
5 3 -
Final Exam Quizlet Questions & Answers | Microeconomics | Trường Đại học Quốc tế, Đại học Quốc gia Thành phố Hồ Chí Minh
5 3 -
Đề thi giữa kỳ II | Microeconomics | Trường Đại học Quốc tế, Đại học Quốc gia Thành phố Hồ Chí Minh
5 3 -
Final Group Project_ The Beer Industry | Microeconomics | Trường Đại học Quốc tế, Đại học Quốc gia Thành phố Hồ Chí Minh
4 2