Microeconomics chapter 1 lecture note | Microeconomics | Trường Đại học Quốc tế, Đại học Quốc gia Thành phố Hồ Chí Minh
Introduction Households and society face decisions about how to allocate scarce resources. Resources are scarce in that we have fewer resources than we wish. Economics is the study ofhow society manages its scarce resources. Economists study how people make decisions about buying and selling, and and investing. We study how people interact vvith one another in markets where prices are determined and quantities are exchanged. We also study the economy as a whole when we concern ourselves with total income, unemployment, and inflation. Tài liệu được sưu tầm và soạn thảo dưới dạng file PDF để gửi tới các bạn cùng tham khảo, ôn tập đầy đủ kiến thức, chuẩn bị cho các buổi học thật tốt. Mời bạn đọc đón xem!
Môn: Microeconomics 613 tài liệu
Trường: Trường Đại học Quốc tế, Đại học Quốc gia Thành phố Hồ Chí Minh 1.9 K tài liệu
Tác giả:


Preview text:
Chap 1: 10 principles of economics
Introduction Households and society face decisions about how to allocate scarce resources.
Resources are scarce in that we have fewer resources than we wish. Economics is the
study ofhow society manages its scarce resources. Economists study how people make
decisions about buying and selling, and and investing. We study how people interact vvith one
another in markets where prices are determined and quantities are exchanged. We also study
the economy as a whole when we concern ourselves with total income, unemployment, and inflation.
This chapter addresses ten principles of economics. The text will refer to these principles
throughout. The ten principles are grouped into three categories: how people make decisions,
how people interact, and how the economy works as a whole.
How People Make Decisions
People face trade-offs: Economists often say, "There ain't no such thing as a free
lunch."This means that there are always trade-ofls--to get more of something we like,
we have to give up something else that we like. For example, if you spend money on
dinner and a movie, you won't be able to spend it on new clothes. Socially, we face
trade-ofts as a group. For example, there is the classic trade-off between "guns and
butter."That is, ifsociety spends more on national defense (guns), then it will have less
to spend on social programs (butter). There is also a social trade-off between efficiency
(getting the most from our scarce resources) and equality (benefits being distributed
uniformly across society). Policies such as taxes and welfare make incomes more
equal, bur these policies reduce returns to hard work, and thus, the economy doesn't
produce as much. As a result, when the government tries to cut the pie into more equal pieces, the pie gets smaller.
The cost of something is what you up give up to get it: The opportunity cost of an
item is what you give up to get that item. It is the true cost of the item. The opportunity
cost of going to college obviously includes your tuition payment. It also includes the
value ofyour time that you could have spent working, valued at your potential
earnings. It would exclude your room and board payment because you have to eat and
sleep whether you are in school or not.
Rational think at the margin: Rational people systematically do the best they can to
achieve their objectives. Marginal changes are inoremental changes to an existing plan.
Rational decision makers only proceed with an action if the marginal benefit exceeds
the marginal cost. For example, you should only attend school for another year ifthe
benefits from that year ofschooling exceed the cost ofattending that year. A farmer
should produce another bushel of corn only if the benefit (price received) exceeds the cost of producing it.
People respond to incentives: An incentive is something that induces a
person to act. Because rational people weigh marginal costs and marginal benefits
of activjties, they will respond when these costs or benefits change. For example, when
the price of automobiles rises, buyers have an incentive to buy fewer cars while
autom~)bile producers have an incentive to hire more workers and produce more
autos. Public policy can alter the costs or benefits of activities. For example, a luxury
tax on expensive boats raises the price and discourages purchases. Some policies
have unintended consequences because they alter behavior in a manner that was not predicted. How People Interact
Trade can make everyone better off: Trade is not a contest in which one wins and
one loses. Trade can .make each trader better off. Trade allows each trader to
specialize in what he or she does best, whether it be farming, building, or
manufacturing, and trade their output for the output of other efficient producers. This is
as true for countries as it is for individuals.
Markets are usually a good way to organize economic activity: In a market
economy, the decisions about what goods and services to produce, how much to
produce, and who gets to consume them are made by millions offirms and households.
Firms and households, guided by self-interest, interact in the marketplace where prices
and quantities are determined. Although this may appear to be chaos, Adam Smith
made the famous observation in the ~vealth o.fNations in 1776 that self-interested
households and firrns interact in markets and generate desirable social outcomes as if
guided by an "invisible hand."These optimal social outcomes were not their original
intent. The prices generated by their, competitive activity signal the value ofcosts and
benefits to producers and consumers, whose activities usually maximize the well-being
of society: Alternatively, the prices dictated by central planners contain no information
on costs and benefits, and therefore, th~se prices fail to guide economic activity
efficiently. Prices also fail to guide economic activity efficiently when goveruments
distort prices with taxes or restrict price movements with price controls.
Governments can sometimes itnprove market outcomes: Government must first
protect property rights in order for markets to work. In addition, government can
sometimes intervene in the market to improve efficiency or equality. When markets
fail to allocate resources efflCiently, there has been market failure, There are many
different sources of market failure. An externality is when the actions ofone person
affect the well-being ofa bystander. Pollution is a standard example. Market power is
when a single person or group can influence the price. In these cases, the government
may be able to intervene and improve economic efficiency. The government may also
intervene to improve equality with income taxes and welfare. Sometimes well-
intentioned policy intervention has unintended consequences.
How the Economy as a Whole Works
A country's standard ofliving depends on its ability to produce goods and
services There is great variation in average incomes across countries at a point in
time and within the same country over time.These differences in incomes and
standards of living are largely attributable to differences in productivity. Productivity
is the amount ofgoods and services produced from each unit oflabor input. As a
result, public policy intend~d to improve standards of living should improve
education, generate more and better tools, and improve access to current technology.
Prices rise when the government prints too much money: Inflation is an increase
in the overall level of prices in the economy. High inflation is costly to the economy.
Large and persistent inflation is caused by rapid growth in the quantity of money.
Policymakers wishing to keep inilation low should maintain slow growth in the quantity of money.
Society faces a short-run trade-oft" between inflation and unemployntent: In the
short run, an increase in the quantity ofmoney stimulates spending, which raises both
prices and production.The increase in production requires more hiring, which
reduces unemployment. Thus, in the short run, an increase in inflation tends to
reduce unemployment, causing a trade-off between inflation and unemployment.The
trade-offis temporary but can last for a year or two. Understanding this trade-offis
important for understanding the fluctuations in economic activity known as the
business cycle. In the short run, pohcymakers may be able to affect the mix
ofinflation and unemployment by changing government spending, taxes, and the quantity of money.
Chap 2: Thinking like an economist
Introduction Like other fields of study, economics has its own jargon and way of thinking. It is
necessary to learn the special language of economics, because knowledge of the economic
vocabulary will help you communicate with precision to others about economic issues.This
chapter will also provide an overview ofhow economists look at the world. The Economist as Scientist
Although economists don't use test tubes or telescopes, they are scientists because they employ
the scientific method-the dispassionate and objective development and testing of theories.
The Scientific Method: Observation, Theory, and More Observation Just as in
other sciences, an economist observes an event, develops a theory, and collects data to
test the theory. An economist observes inflation, creates a theory that excessive growth
in money causes inflation, and then collects data on money growth and inflation to see
ifthere is a relationship. Collecting data to test economic theories is difficult, however,
because economists usually cannot create data from experiments. That is, economists
cannot manipulate the economy just to test a theory. Therefore, economists oftep use
data gathered from historical economic events. .
The Role ofAssutnptions Assumptions are made to make the world easier
to understand. A physicist assumes an object is falling in a vacuum when measuring
acceleration due to gravity.This assumption is reasonably accurate for a marble but not
for a beach ball. An economist may assume that prices are fixed (can't be changed) or
may assume that prices are flexible (can move up or down in response to market
pressures). Because prices often cannot be changed quickly (the menu in a restaurant is
expensive to change) but can be changed easily over time, it is reasonable for
economists to assume that prices are fixed in the short run but flexible in the long run.
The art of scientific thinking is deciding which assumptions to make.
Econotnic Models Biology teachers employ plastic models of the human body. They
are simpler than the actual human body but that is what makes them useful.
Economists use economic models that are composed of diagrams and equations.
Economic models are based on assumptions and are simplifications of economic reality.
Our First Model: The Circular-Flow Diagram The circular-flow diagram shows the
flow ofgoods and factors ofproduction, and monetary payments between households
and firms. Households sell the factors ofproduction, such as land, labor, and capital to
firms, in the market for factors of production. In exchange, the households receive
wages, rent, and profit. Households use these dollars to buy goods and services from
firms in the market for goods and services.The firms use this revenue to pay for the
factors of production, and so on.This is a simplified model of the entire economy. This
version of the circular-flow diagram has been simplified because it excludes
international trade and the government.
Our Second Model:The Production Possibilities Frontier A production possibilities
frontier is a graph that shows the combinations of output the economy can possibly
produce given the available factors ofproduction and the available production
technology. It is drawn assuming the economy produces only two goods. This model
demonstrates the following economic principles:
+ If the economy is operating on the production possibilities frontier, it is operating
efficiently because it is producing a mix of output that is the maximum possible from the resources available.
+ Points inside the curve are, therefore, inefficient. Points outside the curve are currently unattainable.
+ If the economy is operating on the production possibilities frontier, we can see the
trade-offs society faces. To produce more ofone good, it must produce less of the
other. The amount of one good given up when producing more of another good is the
opportunity cost of the additional production.
+ The production possibilities frontier is bowed outward because the opportunity cost
of producing more ofa good increases as we near maximum production of that good.
This is because we use resources better suited toward production of the other good in
order to continue to expand production of the first good.
+ A technological advance in production shifts the production possibilities frontier
outward. This is a demonstration o f economic growth.
Microeconomics and Macroeconomics Economics is studied on various levels.
Microeconomics is the study of how households and firms make decisions and how
they interact in specific markets. Macroeconomics is the study of economy-
wide phenomena such as the federal deficit, the rate of unemployment, and policies to
improve our standard of living. Microeconomics and macroeconomics are related
because changes in the overall economy arise from decisions ofmillions of individuals.
Although related, the methods employed in microeconomics and macroeconomics
differ that they are often taught in separate courses
The Economist as Policy Adviser
When economists attempt to explain the world as it is, they act as scientists. When economists
attempt to improve the world, they act as policy advisers. Correspondingly, positive
statements describe the world as it is, while normative statements prescribe how the world
ought to be. Positive statements can be confirmed or refuted with evidence. Normative
statements involve values (ethics, religion, political philosophy) as well as facts. For example,
"Money growth causes inflation" is a positive statement (of a scientist). "The government
ought to reduce inflation" is a normative statement (of a policy adviser). The two statements
are related because evidence about whether money causes inflation might help us decide what
tool the government should use if it chooses to reduce inflation.
Economists act as policy advisers to the government in many different areas.The president is
advised by economists on the Council of Economic Advisers, the Department of the Treasury,
the Department of Labor, and the Department of Justice. Congress is advised by economists
from the Congressional Budget Office and the Federal Reserve. Why Economists Disagree
There are two reasons why economists have a reputation for giving conflicting advice to policymakers.
Economists may have different scientific judgments. That is, economists may
disagree about the validity of alternative positive theories regarding how the world
works. For example, economists differ in their views of the sensitivity of household
saving to changes in the after-tax return to saving.
Economists may have different values. That is, economists may have different
normative views about what policy should try to accomplish. For example, economists
differ in their views ofwhether taxes should be used to redistribute income.
In reality, although there are legitimate disagreements among economists on many there is
tremendous agreement on many basic principles of economics.
Chap 4: Supply and Demand
Introduction In a market economy, supply and demand determine both the quantity of each
good produced and the price at which each good is sold. In this chapter, we develop the
determinants of supply and demand.We also address how changes in supply and demand alter
prices and change the allocation of the economy's resources. Markets and Competition
A market is a group of buyers and sellers of a particular good or service. It can be highly
organized like a stock market or less organized like the market for ice cream. A competitive
market is a market in which there are many buyers and sellers so that each has a negligible impact on the market price.
A perfectly competitive market has two main characteristics:
The goods offered for sale are all exactly the same.
The buyers and sellers are so numerous that no one buyer or seller can influence the price.
If a market is perfectly competitive, both buyers and sellers are said to be price takers because
they cannot influence the The assumption of perfect competition applies well to agricultural
markets because the product is similar and no individual buyer or seller can influence the price,
If a market has only one seller, the market is known as a monopoly. Other types of markets fall
between the extremes of perfect competition and mononopoly. Demand
The behavior of buyers is captured by the concept of demand.The quantity demanded is the
amount of a good that buyers are willing and able to purchase. Although many things
determine the quantity demanded of a good, the of the good plays a central role. The law of
demand states that, other things equal, an increase in the price of a good reduces the quantity
demanded of the good, while a decrease in the price of a good increases the quantity demanded ofthe good.
The demand schedule is a table that shows the relationship between the price of a good and the
quantity demanded. The demand curve is a graph of this relationship with the price on the
vertical axis and the quantity demanded on the horizontal axis. The demand curve is
downward sloping due to the law of demand.
Market demand is the sum of the quantities demanded for each individual buyer at each
price.That is, the market demand curve is the horizontal sum of the individual demand
curves.The market demand curve shows the total quantity demanded of a good at each price,
while all other factors that affect how much buyers wish to buy are held constant.
Shifts in the Demand Curve When people change how much they wish to buy at each
price, the demand curve shifts. If buyers increase the quantity demanded at the demand
curve shifts to the right, which is called an increase in demand. Alternatively, if buyers
decrease the quantity demanded at each price, the demand curve shifts to the left,
which is called a decrease in demand. The most important factors that shift demand curves are:
+ Income: A normal good is a good for which an increase in income leads to an,
increase in demand. An inferior good is a good for which an increase in income leads to a decrease in demand. +
If two goods can be used in place of one another, they are
Prices of Related Goods:
known as substitutes. When two goods are substitutes, an increase in the price of one
leads to an increase in the demand for the other good. If two goods are used they are
known as complements.When two goods are complements, an increase in the price of
one good leads to a decrease in the demand for the other good.
+ Tastes: If your preferences shift toward a good, it will lead to an increase in the demand for that good.
+ Expectations: Expectations about future income or prices will affect the demand for a good today.
+ Number of Buyers: An increase in the number of buyers will lead to an increase in
the market demand for a good there are more individual demand curves to horizontally sum.
A demand curve is drawn with price on the vertical axis and quantity demanded on the
horizontal axis while holding other a change in the price of a good represents a movement
along the demand curve while a change in income, prices of related goods, tastes,
expectations, and the number ofbuyers causes a shift in the demand curve. Supply
The behavior of sellers is captured by the concept of supply. The quantity supplied is the
amount of a good that sellers are willing and able to sell. Although many things determine the
quantity supplied of a good, the
of the good is central. An increase in the price of a good price
makes production of the good more profitable. Therefore, the law of supply states that, other
things equal, an increase in the price of a good increases the quantity supplied of the good,
while a decrease in the price of a good reduces the quantity supplied of the good.
The supply schedule is a table that shows the relationship between the price of a good and the
quantity supplied. The supply curve is a graph of this relationship with the price on the vertical
axis and the quantity supplied on the horizontal axis. The supply curve is upward sloping due to the law of supply.
Market supply is the sum of the quantity supplied for each individual seller at each price. That
is, the market supply curve is the horizontal sum of the individual supply curves.The market
supply curve shows the total quantity supplied of a good at each price, while all other factors
that affect how much producers wish to sell are held constant.
Shifts in the Supply Curve When producers how much wish to sell at each price, the
supply curve shifts. If producers increase the quantity supplied at each price, the
supply curve shifts right, which is called an Alternatively, if increase in supply.
producers decrease the quantity supplied at each the supply curve shifts left, which is called a
The most factors that shift supply curves are: decrease in supply.
+ Input Prices: A decrease in the price of an input makes production more profitable and increases supply.
+ Technology: An improvement in technology reduces costs, makes production more
profitable, and increases supply.
+ Expectations: Expectations about the future will affect the supply of a good today.
+ Number of Sellers: An increase in the number of sellers will lead to an increase in
the market supply for a good because there are more individual supply curves to horizontally sum.
A supply curve is drawn with price on the vertical axis and quantity supplied on the horizontal
axis while holding other things equal. Therefore, a change in the price of a good represents a
movement along the supply curve while a change in input prices, technology, expectations,
and the number of sellers causes a shift in the supply curve. Supply and Demand Together
When placed on the same graph, the intersection ofsupply and demand is called the market's
equilibrium. Equilibrium is a situation in which the price has reached the level where quantity
supplied equals quantity demanded. The equilibrium or the market-clearing price, is the price
that balances the quantity demanded and the quantity supplied. When the quantity supplied
equals the quantity demanded at the equilibrium price, we have determined the equilibrium quantity.
The market naturally moves toward its equilibrium. If the price is above the equilibrium price,
the quantity supplied exceeds the quantity demanded and there is a or an excess supply, of the
good. A surplus causes the price to fall until it reaches equilibrium. If the is below the
equilibrium price, the quantity demanded exceeds the quantity supplied and there is a
shortage, or an excess demand for the good. A shortage causes the price to rise until it
reaches equilibrium.This natural adjustment of the price to bring the quantity supplied and
the quantity demanded into balance is known as the law of supply and demand. '
When an economic event shifts the supply or the demand curve, the equilibrium in the market
resulting in a new equilibrium price and quantity.When analyzing the impact of some event on
the market equilibrium, employ the following three steps:
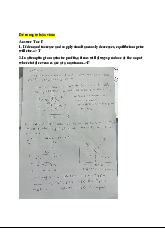
* Decide whether the event shifts the supply curve or demand curve or both.
* Decide which direction the curve shifts.
* Use the supply-and-demand diagram to see how the shift changes the equilibrium price and quantity.
A shift in the demand curve is called a "change in demand." It is caused by a change in a
variable that affects the amount people wish to purchase of a good other than the price of the
good. A change in the of a good causes a movement along a given demand curve and is called
a "change in the quantity demanded." Likewise, a shift in the supply curve is called a "change
in supply." It is caused by a change in a variable that affects the amount producers wish to
supply of a good other than the price of the good. A change in the price of a good causes a
movement along a supply curve and is called a "change in the quantity supplied."
For example, a frost that destroys much of the orange crop causes a decrease in the supply of
oranges (supply shifts to the left). This increases the price of oranges and decreases the
quantity demanded of oranges. In other words, a decrease in the supply of oranges increases
the of oranges and decreases the quantity of oranges purchased..
If both supply and demand shift at the same time, there may be more than one possible
outcome for the changes in the equilibrium price and quantity. For example, if demand were
to increase (shift right) while supply were to decrease (shift left), the price will certainly rise
but the impact on the equilibrium quantity is ambiguous. In this case, the change in the
equilibrium quantity on the magnitudes ofthe shifts in supply and demand.
Conclusion: How Prices Allocate Resources
Markets generate equilibrium prices.These are the signals that guide the allocation of scarce
resources. Prices of products rise to the level necessary to allocate the products, to those who
are willing to pay for them. Prices of inputs (such as labor) rise to the
level necessary to induce people to do the jobs that need to be done. Prices coordinate
decentralized decision making so that no jobs go undone, and there is no shortage of goods
and services for those willing and able to pay for them.
Chapter 5: Elasticity and its application
Introduction In Chapter 4, we learned that an increase in price reduces the quantity demanded
and increases the quantity supplied in a market. In this chapter, we will develop the concept of
elasticity so that we can address how much the quantity demanded and the quantity supplied
responds to changes in market conditions such as price. The Elasticity of Demand
To measure the response of demand to its determinants, we use the concept of elasticity. Price
elasticity ofdemand measures how much the quantity demanded responds to a change in the
price of that good, computed as the percentage change in quantity demanded divided by the percentage change in price.
If the quantity demanded changes substantially from a change in price, demand is If elastic.
the quantity demanded changes little from a change in price, demand is inelastic.Whether a
demand curve tends to be price elastic or inelastic depends on the following:
Availability ofdose substitutes: The demand for goods with close substitutes is more
sensitive to changes in prices and, thus, is more price elastic.
Necessities versus luxuries: The demand for necessities is inelastic while the. demand
for luxuries inelastic. Because one cannot do without a necessity, an increase in the
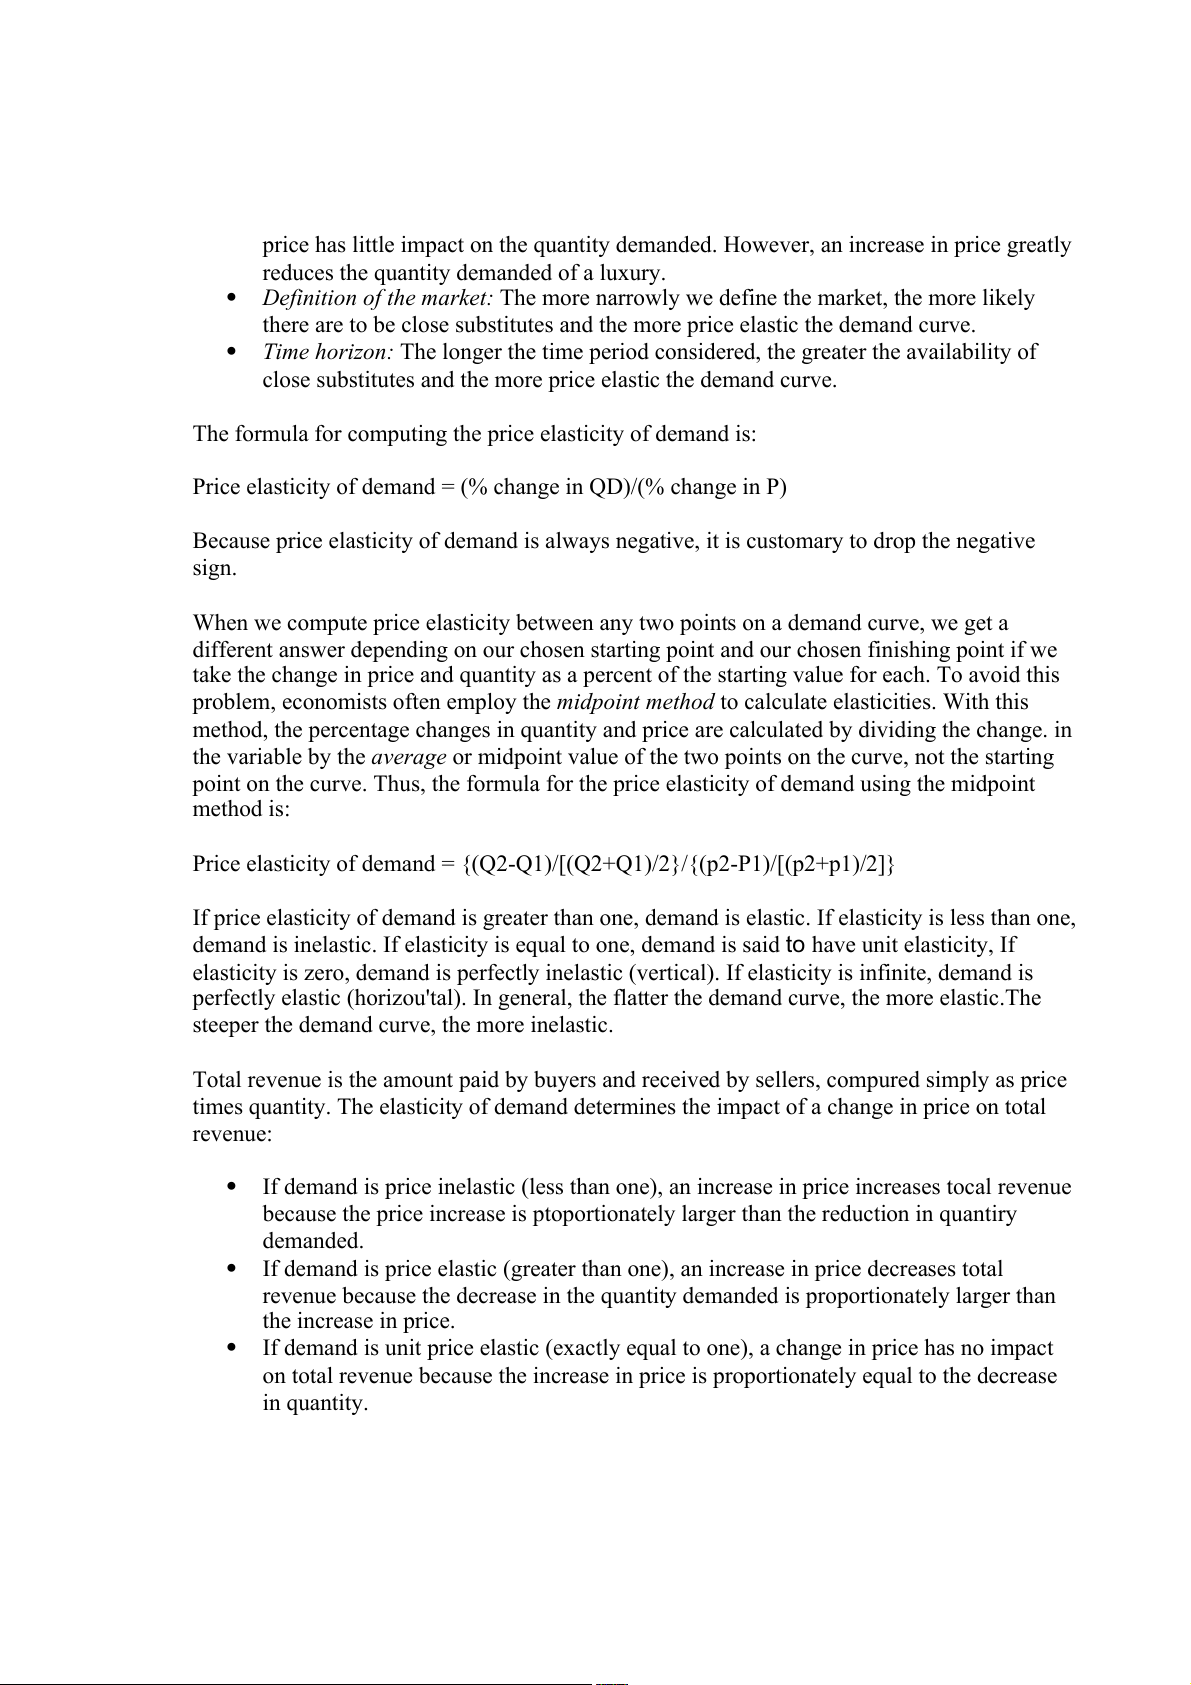
price has little impact on the quantity demanded. However, an increase in price greatly
reduces the quantity demanded of a luxury.
Definition of the market: The more narrowly we define the market, the more likely
there are to be close substitutes and the more price elastic the demand curve.
Time horizon: The longer the time period considered, the greater the availability of
close substitutes and the more price elastic the demand curve.
The formula for computing the price elasticity of demand is:
Price elasticity of demand = (% change in QD)/(% change in P)
Because price elasticity of demand is always negative, it is customary to drop the negative sign.
When we compute price elasticity between any two points on a demand curve, we get a
different answer depending on our chosen starting point and our chosen finishing point if we
take the change in price and quantity as a percent of the starting value for each. To avoid this
problem, economists often employ the midpoint method to calculate elasticities. With this
method, the percentage changes in quantity and price are calculated by dividing the change. in the variable by the
or midpoint value of the two points on the curve, not the starti average ng
point on the curve. Thus, the formula for the price elasticity of demand using the midpoint method is:
Price elasticity of demand = {(Q2-Q1)/[(Q2+Q1)/2}/{(p2-P1)/[(p2+p1)/2]}
If price elasticity of demand is greater than one, demand is elastic. If elasticity is less than one,
demand is inelastic. If elasticity is equal to one, demand is said to have unit elasticity, If
elasticity is zero, demand is perfectly inelastic (vertical). If elasticity is infinite, demand is
perfectly elastic (horizou'tal). In general, the flatter the demand curve, the more elastic.The
steeper the demand curve, the more inelastic.
Total revenue is the amount paid by buyers and received by sellers, compured simply as price
times quantity. The elasticity of demand determines the impact of a change in price on total revenue:
If demand is price inelastic (less than one), an increase in price increases tocal revenue
because the price increase is ptoportionately larger than the reduction in quantiry demanded.
If demand is price elastic (greater than one), an increase in price decreases total
revenue because the decrease in the quantity demanded is proportionately larger than the increase in price.
If demand is unit price elastic (exactly equal to one), a change in price has no impact
on total revenue because the increase in price is proportionately equal to the decrease in quantity.
Along a linear demand curve, price elasticity is not constant,When price is high and quantity
low, price elasticity is large because a change in price causes, a larger percentage change in
quantity. When price is low and quantity high, price elasticity is small because a change in causes a smaller change in quantity. perrerltage
There are additional demand elasticities.The income elasticity of demand is a measure of how
much the quantiry demanded responds to a change in consumers' income, computed as the
percentage change in quantity demanded divided by the percentage change in income or:
Income elasticity of demand = (% change in QD) / (%change in income)
For normal goods, income elasticity is positive. For ,
inferior goods, income elasticity is
negative. Within the group of normal goods, necessities like food have small income
elasticities because the quantity demanded changes little when income changes. Luxuries have larger income elasticities,
The cross-price elasticity of demand is a measure of the response of the quantity demanded of
one good to a change in the price of another good, computed as the percentage change in the
quantity demanded of one good divided by the percentage change in the price of another good or:
Cross-price elasticity of D = (%change in QD of good 1)/(% change in the P of good 2
The cross-price elasticity of demand is positive for and negative for substitutes complements. The Elasticity of Supply
Price elasticity of supply measures how much the quantity supplied responds to a change in
the price of that good, computed as the percentage change in quantity supplied divided by the percentage change in price.
If the quantity supplied changes substantially from a in price, supply is If the quanti elastic. ty
supplied changes little from a change in price, supply is inelastic. Supply is more elastic when
the sellers have greater flexibility to change the amount of a good they produce in response to
a change in price. Generally, the shorter the time period considered, the less flexibility the
seller has in choosing how much to produce and the more inelastic the supply curve,
The formula for computing the price elasticity ofsupply is:
P elasticity of S = (% change in QS)/(% change in P)
If price elasticity of supply is greater than one, supply is elastic. If elasticity is less than one,
supply is inelastic. If elasticity is equal to one, supply is said to have unit elasticity.
'If elasticity is zero, supply is perfectly inelastic (vertical). If elasticity is infinite, supply is
perfectly elastic (horizontal). Tn general, the flatter the supply curve, the more elastic.The
steeper the supply curve, the more inelastic.
Price elasticity of supply may not be constant along a supply curve. At low quantities, a small
increase in price may stimulate a large increase in quantity supplied because there is excess
capacity in the production facility.Therefore,price elasticity is large. At high quantities, a large
increase in price may cause only a small increase in quantity supplied because the production
facility is at full capacity. Therefore, price elasticity is smalL
Three applications of S, D and e
The market for agricultural products: Advances in technology have shifted the supply curve
tor agricultural products to the right. The demand for food, however, is generally inelastic
(steep) because tOod is inexpensive and a necessity As a result, the rightward shift in supply
has caused a great reduction in the equilibrium price and a small increase in the equilibrium
quantity Thus, ironically, technological advances in agriculture reduce total revenue paid to farmers as a group.
The market for oil: In the 1970s and early 1980s, the Organization of Petroleum Exporting
Countries (OPEC) reduced the supply of oil in order'to raise its price.
In the short run, the demand for oil tends to be inelastic (steep) because consumers cannot
easily find substitutes. Thus, the decrease in supply raised the price substantially and increased
total revenue to the producers. In the long run, however, consumers found substitutes and
drove inore fuel-efficient cars causing the demand for oil to become more elastic, and
producers searched tor more oil causing supply to become more elastic. As a result, while the
price of oil rose a great deal in the short run, it did not rise much in the long run.
The market for illegal drugs: In the short run, the demand for illegal addictive drugs
is relatively inelastic. As a result, drug interdiction policies that reduce the supply ofdrugs tend
to greatly increase the price ofdrugs while reducing the quantity consumed very little, and
thus, total revenue paid by drug users increases.This need for additional funds by drug users
may cause drug-related crime to rise. This increase in total revenue and in crime is likely to be
smaller in the long run because the demand for illegal drugs becomes more elastic as time
passes. Alternatively, policies aimed at reducing the demand tor drugs reduce total revenue in
the drug market and reduce drug-related crime.
Tài liệu liên quan:
-
Tự Luận Vimo: Phân Tích Cung, Cầu và Thị Trường Cạnh Tranh| Microeconomics | Trường Đại học Quốc tế, Đại học Quốc gia Thành phố Hồ Chí Minh
5 3 -
Review Questions: Thinking Like an Economist | Microeconomics | Trường Đại học Quốc tế, Đại học Quốc gia Thành phố Hồ Chí Minh
5 3 -
Final Exam Quizlet Questions & Answers | Microeconomics | Trường Đại học Quốc tế, Đại học Quốc gia Thành phố Hồ Chí Minh
5 3 -
Đề thi giữa kỳ II | Microeconomics | Trường Đại học Quốc tế, Đại học Quốc gia Thành phố Hồ Chí Minh
5 3 -

Final Group Project_ The Beer Industry | Microeconomics | Trường Đại học Quốc tế, Đại học Quốc gia Thành phố Hồ Chí Minh
4 2