Principles and decision-making | Microeconomics | Trường Đại học Quốc tế, Đại học Quốc gia Thành phố Hồ Chí Minh
Trade-offs - Cng phải đối mặt với sự từ bỏ, đánh đổi cái gì đấy để đc cái mình mong muốn 2. Opportunity cost - Cái giá phải trả cho cơ hội bn chọn 3. Marginal thinking - Cng thường suy nghĩ tại điểm cận biên , usually compare Marginal cost and Marginal benefit 4. Incentives - Cng bị ảnh hưởng bới sự khuyến khích. Tài liệu được sưu tầm và soạn thảo dưới dạng file PDF để gửi tới các bạn cùng tham khảo, ôn tập đầy đủ kiến thức, chuẩn bị cho các buổi học thật tốt. Mời bạn đọc đón xem!
Môn: Microeconomics 634 tài liệu
Trường: Trường Đại học Quốc tế, Đại học Quốc gia Thành phố Hồ Chí Minh 1.9 K tài liệu
Tác giả:
Preview text:
MICROECONOMICS ( KINH TẾ VI MÔ )
I, PRINCIPLES OF ECONOMICS( MANKIW)
HOW PEOPLE MAKE DECISIONS 1. Trade-offs -
Cng phải đối mặt với sự từ bỏ, đánh đổi cái gì đấy để đc cái mình mong muốn 2. Opportunity cost -
Cái giá phải trả cho cơ hội bn chọn 3. Marginal thinking -
Cng thường suy nghĩ tại điểm cận biên , usually compare Marginal cost and Marginal benefit 4. Incentives -
Cng bị ảnh hưởng bới sự khuyến khích
HOW PEOPLE INTERACT 5. Trade benefits -
Thương mại có thể làm mọi người đều có lợi 6. Markets are efficient -
Thị trường là 1 cách tốt để tổ chức hoạt động kinh tế
7. Government can improve outcomes -
Nhà nước có thể cải thiện kết quả thị trường
THE ECONOMIY AS A WHOLE ( nền kinh tế như một tổng thể )
8. Productivity drives living standards -
Mức sống của 1 nước phụ thuộc vào sự năng suất , năng lực sản xuất hàng hoá và dịch vụ của nc đó. 9. Money ↑ → Prices ↑ -
Tiền lạm phát, chính phủ in nhiều tiền, giá cả tăng
10. Inflation–unemployment trade-off -
Xã hội đối mặt ngắn hạn với sự lạm phát và thất nghiệp.
BÀN TAY VÔ HÌNH
Bàn tay vô hình hoạt động thông qua giá cả: -
Sự tương tác giữa ng bán và ng mụa quyết định giá cả -
Mỗi mức giá phản ánh giá trị của hàng hoá đối với ng mua và chi phí sản xuất hành hoá đó -
Giá cả hướng dẫn các hộ giađình và cty vì lợiích cá nhân đưa ra cá quyết định ,ntrong
nhiều trường hợp tối đa hoá phúc lợi kte của xã hội
THINKING LIKE AN ECONOMIST
2-1. The Economist as Scientist
Economists approach the world using scientific thinking.
( nhà kinh tế tiếp cận như một khoa học, mặc dù là hướng tới cng )
2-1a. The Scientific Method: Observation, Theory, and More Observation
Economists observe real-world ,
events form theories, collect data, and test whether the
data support the theory. ( nhà kinh tế quan sát xây dựng lý thuyết thu thập dữ liệu
kiểm chứng lý thuyết )
Example: Observing high inflation → theory: “Inflation happens when the government
prints too much money” → test data across countries.
2-1b. The Role of Assumptions
Assumptions help simplify complex reality. ( đơn giản hoá thực tế, tập trung cốt lõi )
Different assumptions apply to different contexts: o
Short run: prices may be assumed .
sticky ( giá cả cứng nhắc ) o
Long run: prices are flexible.( giá cả linh hoạt )
2-1c. Economic Models
Simplified representations of reality using diagrams or equations.
( biểu đồ or phương trình lm đơn giản hoá thực tế )
Models highlight essential relationships while ignoring unnecessary details.
2-1d. Model 1: The Circular-Flow Diagram ( sơ đồ dòng thu chuyển )
Illustrates how the economy is organized and how participants interact. Two types of decision makers: households and firms. Two markets:
1. Markets for goods and services: Households = buyers Firms = sellers
2. Markets for factors of production:
Households = sellers (labor, land, capital) Firms = buyers Two loops:
o Inner loop: flow of inputs and outputs ( dòng vật chất: goods/service, production)
o Outer loop: flow of dollars (income, spending, revenue, profit) ( dòng tiền )
Household nhân công nhận lương mua đồ
Firms sản xuất trả lương bán hàng
2-1e. Model 2: The Production Possibilities Frontier (PPF)
A graph that shows combinations of goods an economy can produce with available resources and technology. Key ideas illustrated by PPF:
Scarcity: resources are limited ( khan hiếm )
Trade-offs: producing more of one good means producing less of another ( sự đánh đổi )
Opportunity cost: slope of the PPF Efficiency: o Points on the PPF = efficient o Points inside = inefficient o Points outside = unattainable
Economic growth: technological improvement shifts the PPF outward
2-1f. Microeconomics vs. Macroeconomics Microeconomics:
Study of households, firms, and individual markets (e.g., rent control, labor decisions). Macroeconomics:
Study of the entire economy (GDP, unemployment, inflation).
Though related, each field uses different models and answers different questions.
2-2. The Economist as Policy Adviser
Economists advise governments on policy decisions. (không chỉ làm khoa học mà còn đưa ra đánh giá )
2-2a. Positive vs. Normative Statements
Positive statements: describe the world as it
is (testable) ( thực chứng ) o
Example: “Law X will reduce national income.”
Normative statements: describe how the world should be (value-based) ( chuẩn tắc ) o
Example: “Congress should pass law X.”
Positive = scientific; Normative = policy recommendation.
2-2b. Economists in Washington Economists work in: o The White House o Congress o
Federal agencies (e.g., Fed, Treasury)
They help evaluate the economic impact of policies.
2-2c. Why Economists’ Advice Is Not Always Followed
Politics involves many forces—public opinion, interest groups, elections—
which may conflict with economic recommendations.
2-3. Why Economists Disagree
2-3a. Differences in Scientific Judgments
Economists may interpret data differently or use different models → different conclusions.
2-3b. Differences in Values
Economists may have different beliefs about what policies are desirable
(e.g., fairness vs. efficiency).
2-3c. Perception vs. Reality
The public may misunderstand economists' positions.
Sometimes economists agree more than people think.
THE MARKET FORCES OF SUPPLY AND DEMAND
4-1. Markets and Competition
1. Market là gì?
Market = nhóm người mua
và người bán của một hàng hóa/dịch vụ.
Ngườimua→quyếtđịnhdemand,
Người bán → quyết định . supply
2. Competition (cạnh tranh)
Một thị trường cạnh tranh cao có nhiều người mua – nhiều người bán, không ai có thể tự quyết giá.
→ Các bên đều là price takers (nhận giá thị trường) .
3. Perfectly competitive market có 2 đặc điểm:
1. Hàng hóa giống hệt nhau.
2. Người mua & người bán quá nhiều → không ai có ảnh hưởng đến giá. 4-2. Demand
1. Quantity demanded
Lượng mà người mua muốn và có khả năng mua.
2. Law of demand Giá↑→lượngcầu↓ Giá↓→lượngcầu↑
→ Đường cầu dốc xuống.
3. Demand schedule → demand curve
Demandschedule.là.bảng.giá–sốlượng.
Demand curve là đồ thị biểu diễn mối quan hệ này. 4. Market demand
= tổng lượng cầu của tất cả người mua.
5. Những yếu tố làm shift đường cầu
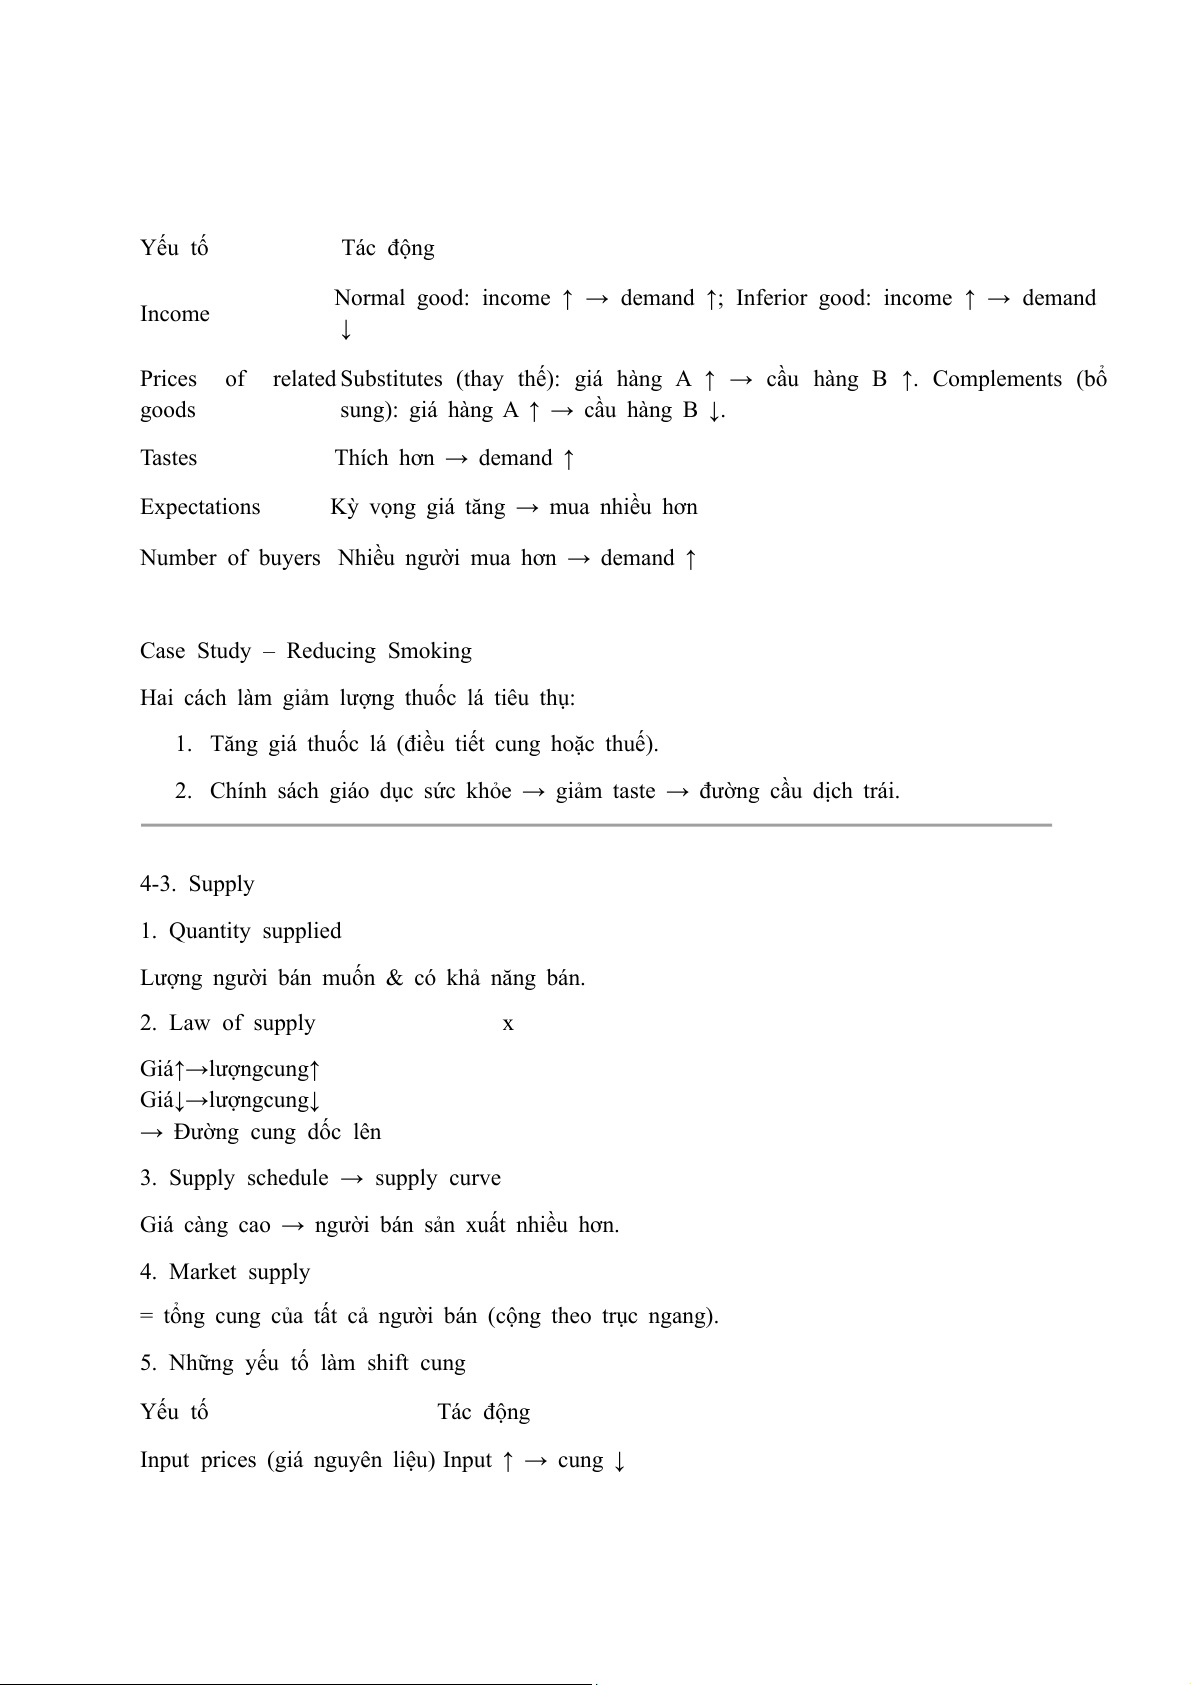
Không phải giá! (giá chỉ tạo movement along curve) Yếu tố Tác động
Normal good: income ↑ → demand ↑; Inferior good: income ↑ → demand Income ↓
Prices of related Substitutes (thay thế): giá hàng A ↑ → cầu hàng B ↑. Complements (bổ goods
sung): giá hàng A ↑ → cầu hàng B ↓. Tastes Thích hơn → demand ↑ Expectations
Kỳ vọng giá tăng → mua nhiều hơn
Number of buyers Nhiều người mua hơn → demand ↑
Case Study – Reducing Smoking
Hai cách làm giảm lượng thuốc lá tiêu thụ:
1. Tăng giá thuốc lá (điều tiết cung hoặc thuế).
2. Chính sách giáo dục sức khỏe → giảm taste → đường cầu dịch trái. 4-3. Supply
1. Quantity supplied
Lượng người bán muốn & có khả năng bán.
2. Law of supply x Giá↑→lượngcung↑ Giá↓→lượngcung↓
→ Đường cung dốc lên
3. Supply schedule → supply curve
Giá càng cao → người bán sản xuất nhiều hơn. 4. Market supply
= tổng cung của tất cả người bán (cộng theo trục ngang).
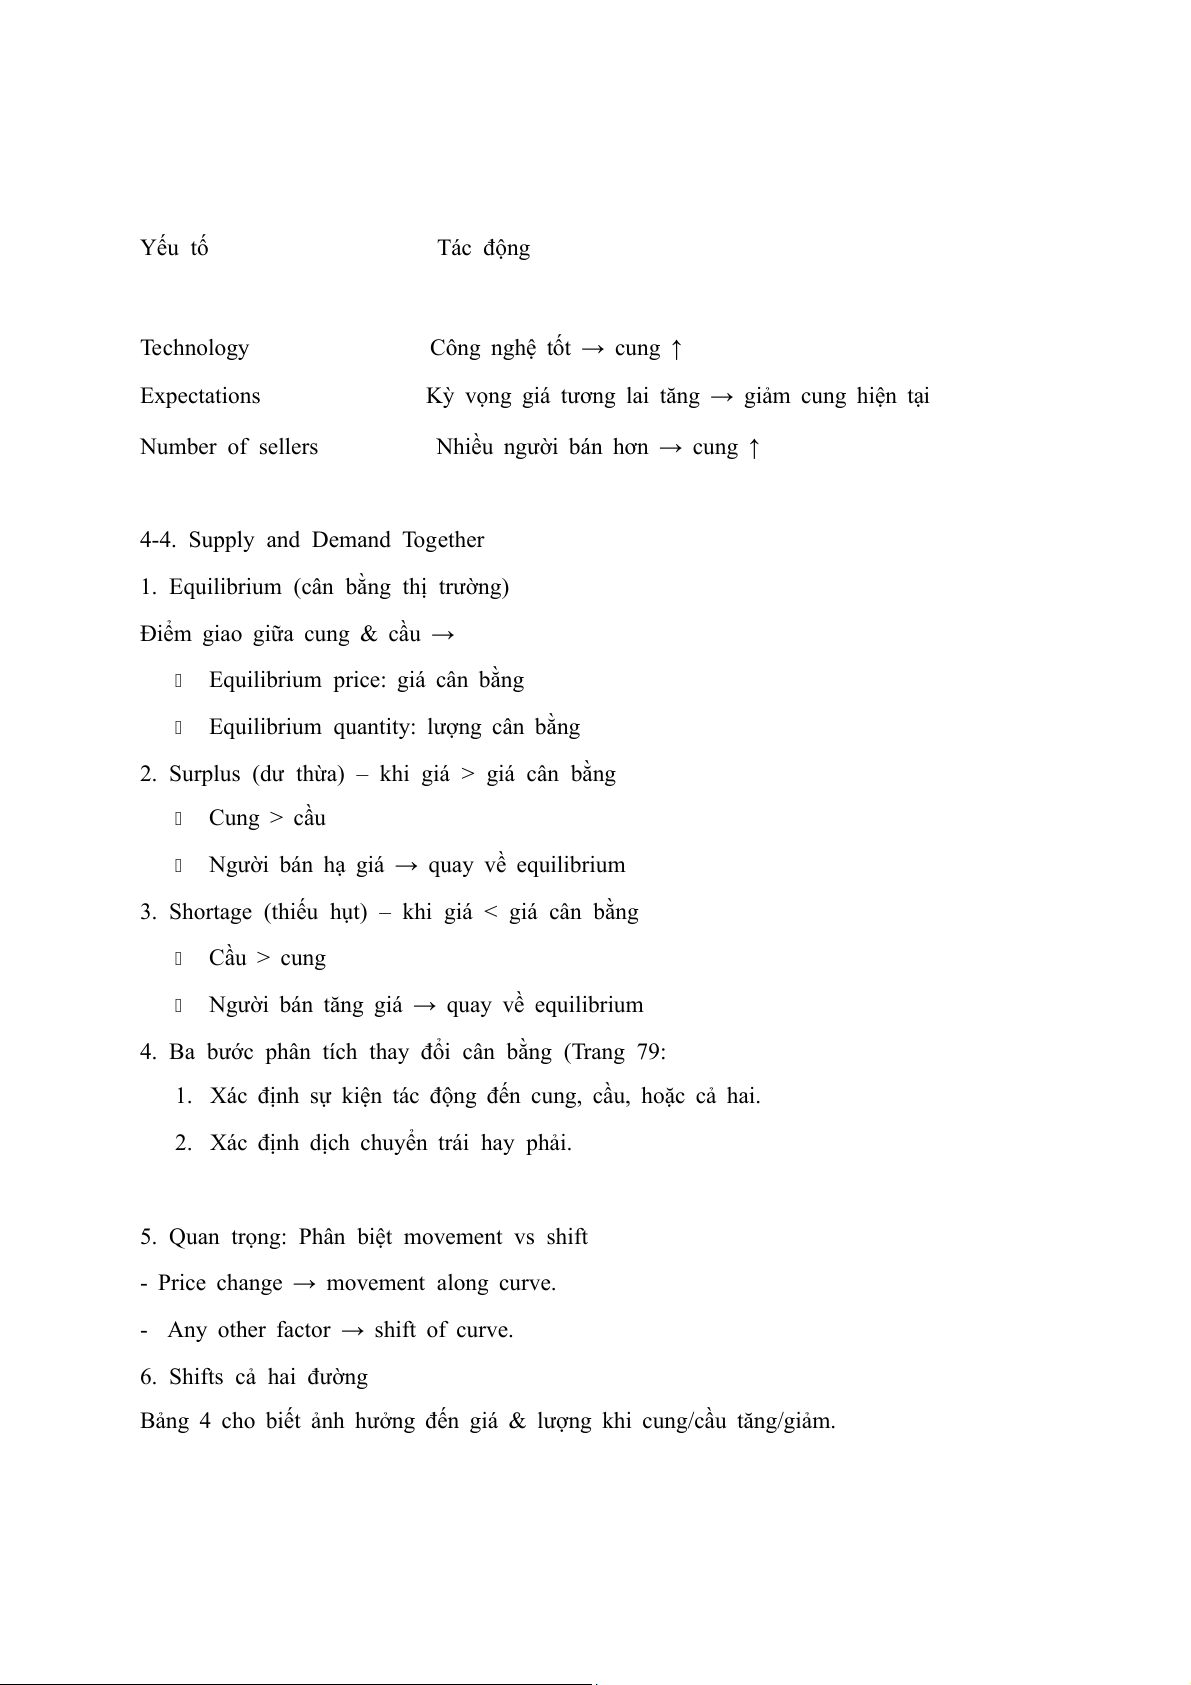
5. Những yếu tố làm shift cung Yếu tố Tác động
Input prices (giá nguyên liệu) Input ↑ → cung ↓ Yếu tố Tác động Technology
Công nghệ tốt → cung ↑ Expectations
Kỳ vọng giá tương lai tăng → giảm cung hiện tại
Number of sellers
Nhiều người bán hơn → cung ↑
4-4. Supply and Demand Together
1. Equilibrium (cân bằng thị trường)
Điểm giao giữa cung & cầu →
Equilibrium price: giá cân bằng
Equilibrium quantity: lượng cân bằng
2. Surplus (dư thừa) – khi giá > giá cân bằng Cung > cầu
Người bán hạ giá → quay về equilibrium
3. Shortage (thiếu hụt) – khi giá < giá cân bằng Cầu > cung
Người bán tăng giá → quay về equilibrium
4. Ba bước phân tích thay đổi cân bằng (Trang 79:
1. Xác định sự kiện tác động đến cung, , cầu hoặc cả hai.
2. Xác định dịch chuyển trái hay . phải
5. Quan trọng: Phân biệt movement vs shift
- Price change → movement along curve.
- Any other factor → shift of curve.
6. Shifts cả hai đường
Bảng 4 cho biết ảnh hưởng đến giá & lượng khi cung/cầu tăng/giảm.
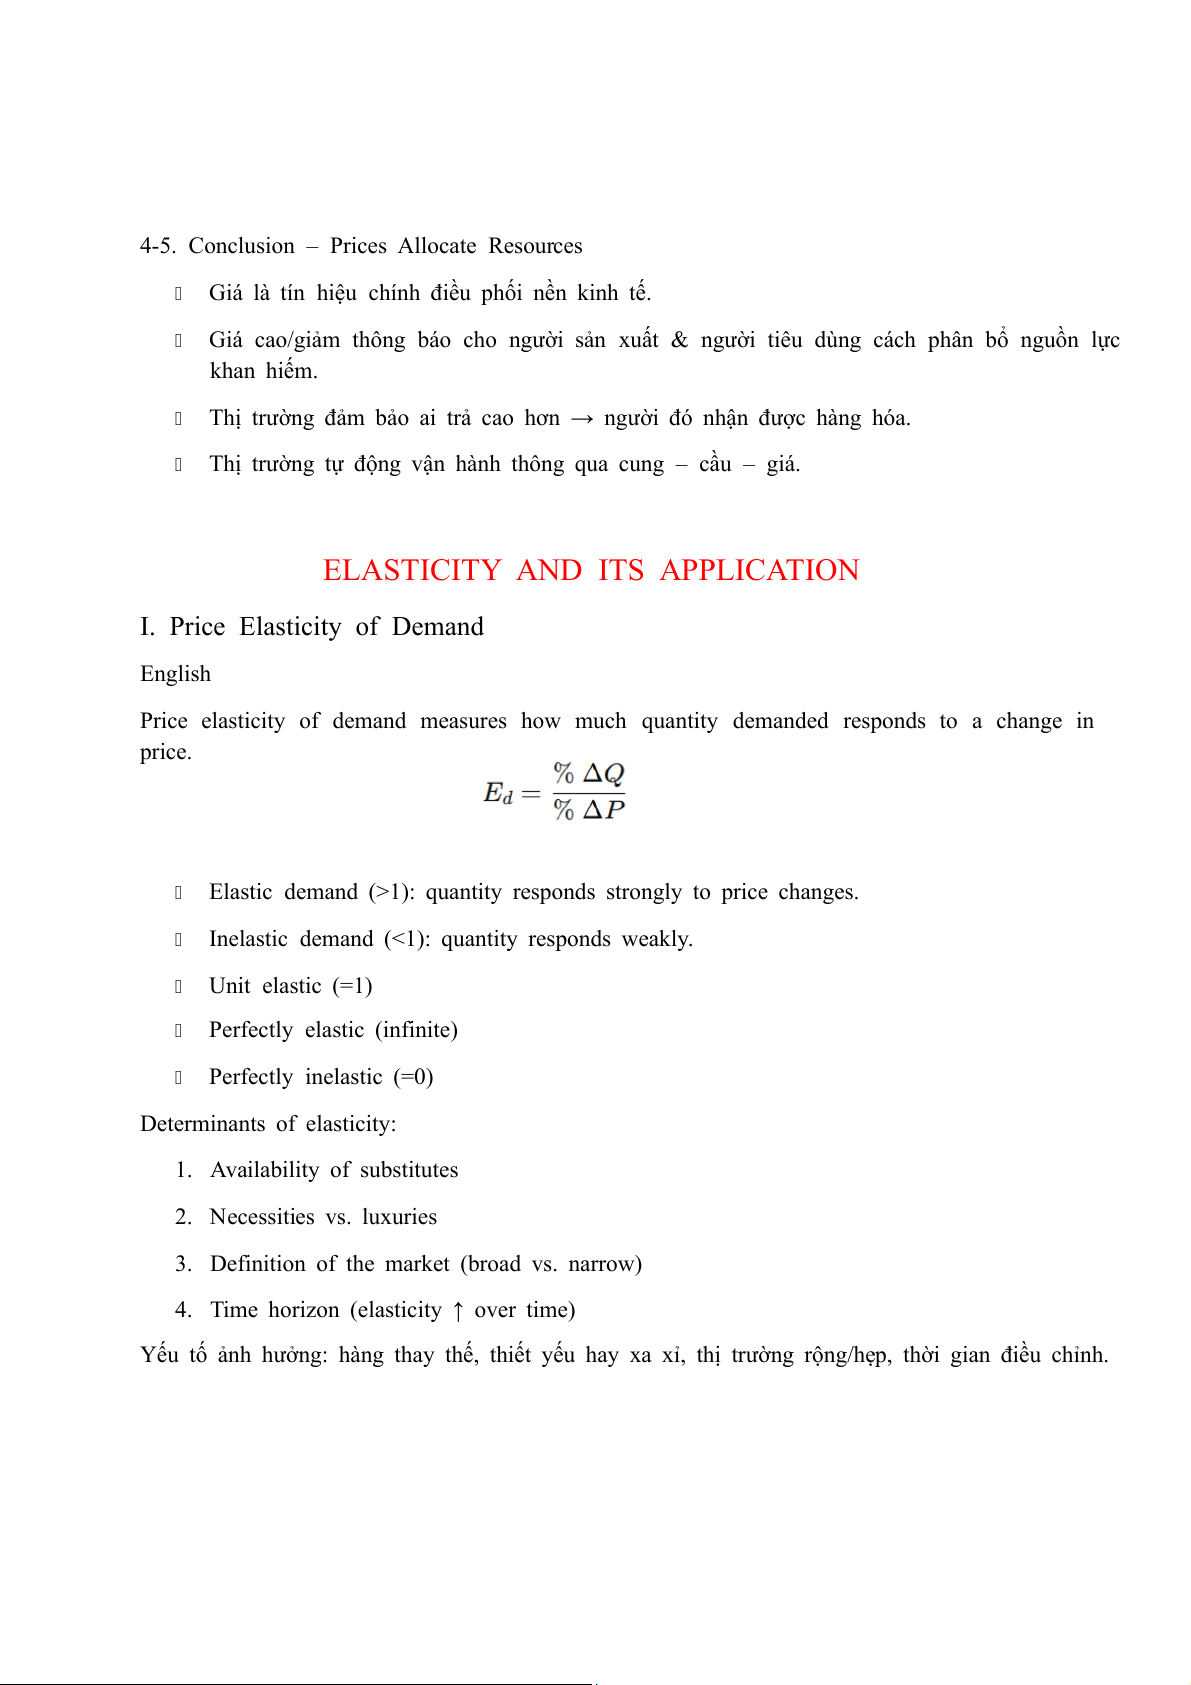
4-5. Conclusion – Prices Allocate Resources
Giá là tín hiệu chính điều phối nền kinh tế.
Giá cao/giảm thông báo cho người sản xuất & người tiêu dùng cách phân bổ nguồn lực khan hiếm.
Thị trường đảm bảo ai trả cao hơn → người đó nhận được hàng hóa.
Thị trường tự động vận hành thông qua cung – cầu – giá.
ELASTICITY AND ITS APPLICATION
I. Price Elasticity of Demand English
Price elasticity of demand measures how much quantity demanded responds to a change in price.
Elastic demand (>1): quantity responds strongly to price changes.
Inelastic demand (<1): quantity responds weakly. Unit elastic (=1)
Perfectly elastic (infinite)
Perfectly inelastic (=0) Determinants of elasticity: 1. Availability of substitutes 2. Necessities vs. luxuries
3. Definition of the market (broad vs. narrow)
4. Time horizon (elasticity ↑ over time)
Yếu tố ảnh hưởng: hàng thay thế, thiết yếu hay xa xỉ, thị trường rộng/hẹp, thời gian điều chỉnh.
II. Total Revenue and Elasticity English Total revenue: TR=P×Q
If demand is elastic: price ↑ → TR ↓ If demand is : inelastic price ↑ → TR ↑
If demand is unit elastic: TR unchanged
III. Income Elasticity of Demand English
Measures how quantity demanded changes with . income
Normal goods: elasticity > 0
Inferior goods: elasticity < 0 ( hàng cấp thấp )
IV. Cross-Price Elasticity of Demand English
Measures how quantity demanded of one good responds to the price change of another good.
Substitutes: elasticity > 0 ( hàng thay thế )
Complements: elasticity < 0 ( hàng bổ sung )
V. Price Elasticity of Supply English
Measures how much quantity supplied responds to price changes.
Supply is more elastic in the long run.
Factors: flexibility of sellers, production capacity, time. Types: Inelastic supply (<1) Elastic supply (>1) Perfectly inelastic (=0) Perfectly elastic (∞)
VI. Applications of Elasticity English
Governments use elasticity to predict effects of ,
taxes subsidies, and price controls.
Elasticity determines who bears tax burden (tax incidence).
Markets with inelastic demand or supply create bigger tax revenue.
⭐ TÓM TẮT NGẮN (SHORT SUMMARY) English
Elasticity measures responsiveness of buyers and sellers to changes in price, income, and other goods’ prices.
Demand elasticity explains how price changes affect total revenue.
Income elasticity distinguishes normal vs. inferior goods.
Cross-price elasticity identifies substitutes and complements.
Supply elasticity shows how easily producers adjust production.
Elasticity is essential for understanding taxes and government policies.
SUPPLY, DEMAND, AND GOVERNMENT POLICIES
I. Price Controls – Kiểm soát giá
Chính phủ can thiệp vào thị trường bằng price ceiling (giá trần) và price floor (giá sàn).
Các chính sách này ngăn thị trường đạt giá cân bằng ⇒ tạo shortage hoặc surplus.
1. Price Ceiling (Giá trần)
Giới hạn giá tối đa người bán được phép thu. ENGLISH A price ceiling is
binding if it is set below equilibrium price → leads to shortages.
Common example: rent control. ( thuê nhà )
Consequences: shortages, long waiting lines, black markets, reduced quality.
2. Price Floor (Giá sàn)
Giới hạn giá tối thiểu người bán được thu. ENGLISH A price floor is
binding if set above equilibrium price → leads to surplus. Example: minimum wage.
Surplus = unemployment (quantity of labor supplied > quantity of labor demanded).
II. Taxes – Thuế
Chính phủ đánh thuế người mua hoặc người bán nhưng gánh nặng thuế phụ thuộc vào độ co giãn.
1. Taxes on Buyers – Thuế đánh lên người mua ENGLISH
Demand curve shifts left (down).
Buyers pay a higher effective price; sellers receive less.
Quantity in the market decreases.
Tax burden shared, depending on elasticities.
2. Taxes on Sellers – Thuế đánh lên người bán ENGLISH Supply curve shifts left (up).
Buyers pay more; sellers receive less after tax. Quantity decreases.
Effect is similar to tax on buyers.
III. Tax Incidence – Gánh nặng thuế ENGLISH
Tax incidence: how the burden of the tax is divided.
The side that is less elastic bears more of the tax burden. o
Inelastic demand → consumers bear more o
Inelastic supply → producers bear more
IV. Consequences of Price Controls & Taxes – Hệ quả của chính sách giá & thuế ENGLISH
Price ceilings → shortages, rationing, black markets, misallocation.
Price floors → surpluses, unemployment, waste of resources.
Taxes reduce quantity traded → make the market less efficient.
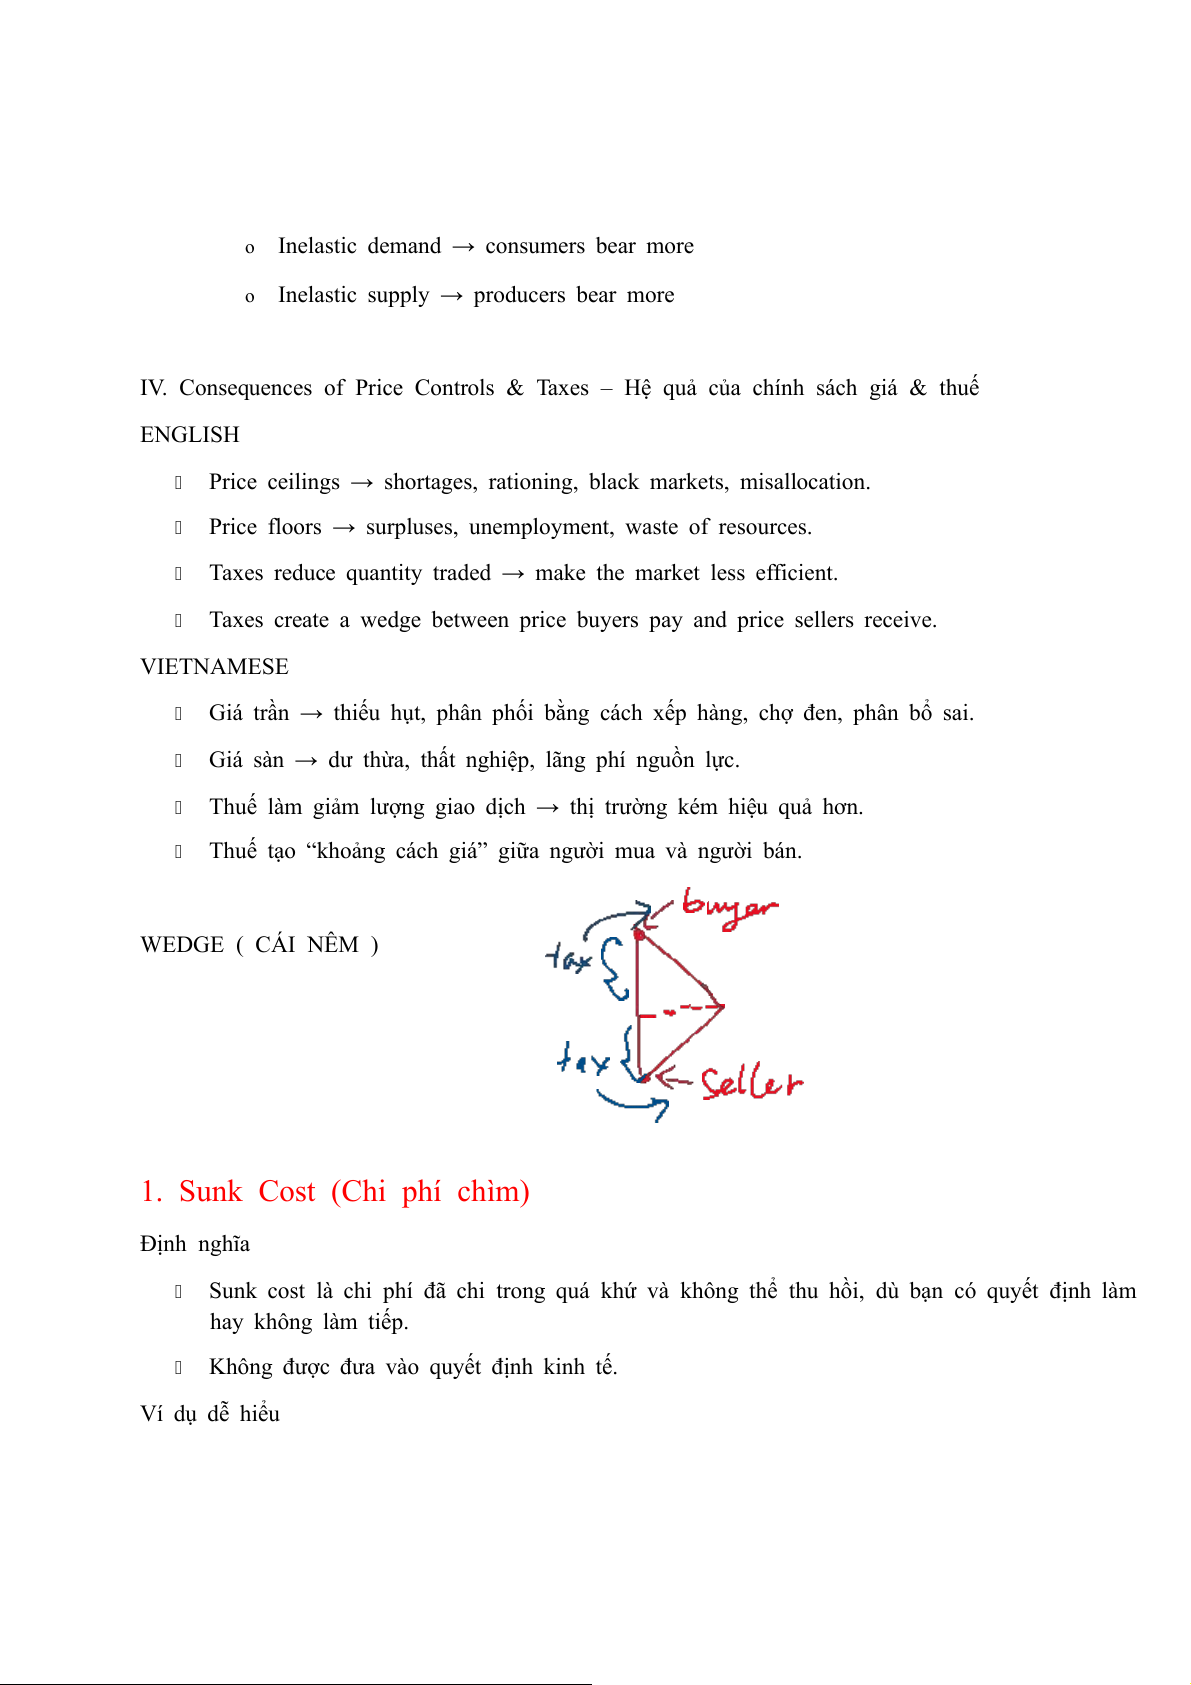
Taxes create a wedge between price buyers pay and price sellers receive. VIETNAMESE
Giá trần → thiếu hụt, phân phối bằng cách xếp hàng, chợ đen, phân bổ sai.
Giá sàn → dư thừa, thất nghiệp, lãng phí nguồn lực.
Thuế làm giảm lượng giao dịch → thị trường kém hiệu quả hơn.
Thuế tạo “khoảng cách giá” giữa người mua và người bán.
WEDGE ( CÁI NÊM )
1. Sunk Cost (Chi phí chìm) Định nghĩa
Sunk cost là chi phí đã chi trong quá khứ và không thể thu hồi, dù bạn có quyết định làm hay không làm tiếp.
Không được đưa vào quyết định kinh tế. Ví dụ dễ hiểu
Bạn mua vé xem phim 100k nhưng xem 10 phút thấy chán → 100k là sunk cost. Quyết
định ở lại hay về là dựa vào lợi ích hiện tại, không phải 100k đã mất. Điểm cần nhớ để thi
“Sunk costs are irrelevant to decision making.”
Không nằm trong MC, AVC, ATC.
2. Short Run Cost (Chi phí ngắn hạn) Định nghĩa
Ngắn hạn: ít nhất một yếu tố đầu vào cố định (thường là vốn – máy móc, nhà xưởng).
Vì có yếu tố cố định → chi phí chia thành Fixed cost (FC) và Variable cost (VC).
Các loại chi phí trong ngắn hạn
Fixed Cost (FC): không đổi theo sản lượng.
Variable Cost (VC): thay đổi theo sản lượng. Total Cost (TC = FC + VC).
Chi phí bình quân & biên AFC = FC/Q AVC = VC/Q ATC = AFC + AVC
MC = ΔTC / ΔQ (chi phí biên)
Hình dạng đường chi phí AVC và ATC dạng chữ U.
MC cắt ATC và AVC tại điểm thấp nhất của chúng. Lý do có chữ U
Do quy luật năng suất biên giảm dần (diminishing marginal returns).
3. Long Run Cost (Chi phí dài hạn) Định nghĩa
Dài hạn: tất cả đầu vào đều thay đổi (không có chi phí cố định).
DN có thể điều chỉnh quy mô: xây nhà xưởng lớn hơn, mua thêm máy móc… Các khái niệm chính
Long-run average cost (LRAC): đường chi phí bình quân dài hạn.
Là đường bao bọc các ATC ngắn hạn → chọn mức vốn tối ưu cho mỗi Q. Hình dạng LRAC
Thường là một đường U dẹt (hoặc “L” hiện đại), gồm 3 vùng:
1. Economies of scale (lợi thế theo quy mô): LRAC giảm o
Do chuyên môn hoá, công nghệ tốt hơn…
2. Constant returns to scale: LRAC không đổi
3. Diseconomies of scale (bất lợi theo quy mô): LRAC tăng o
Do quản lý phức tạp, quan liêu… Điểm cần nhớ
Dài hạn không có FC → chỉ có variable cost.
DN chọn quy mô tối ưu để sản xuất mức Q rẻ nhất.
Tóm tắt cực ngắn cho ôn thi Khái niệm Ý chính Ghi nhớ nhanh Sunk cost
Chi phí đã chi và không thu lại Không liên quan quyết định!
Short run cost Có yếu tố cố định → FC & VC MC cắt ATC/AVC ở đáy
Long run cost Tất cả biến đổi → không FC
LRAC tạo từ ATC ngắn hạn
. Profit là gì?
Profit (π) = Total Revenue (TR) − Total Cost (TC) TR = P × Q TC có thể là: o
Accounting cost → chi phí kế toán o
Economic cost → chi phí kinh tế = chi phí kế toán + chi phí cơ hội
2. Accounting profit vs Economic profit
(1) Accounting profit (Lợi nhuận kế toán)
Tính theo chi phí thực chi (tiền mặt)
Không tính chi phí cơ hội Côngthức:
Accounting profit = TR − Explicit costs
(2) Economic profit (Lợi nhuận kinh tế)
Bị trừ cả explicit cost (chi phí rõ ràng) + implicit cost (chi phí cơ hội)
Cái mà kinh tế vi mô dùng để ra quyết định. Côngthức: Economic profit = TR − (Ex plicit + Implicit costs) Điểm thi hay hỏi
Economic profit ≤ Accounting profit
Economic profit = 0 → Firm earns normal profit ( vẫn nên sản xuất )
3. Normal profit (Lợi nhuận bình thường)
Xảy ra khi Economic profit = 0
DN đủ bù chi phí cơ hội → chủ vẫn muốn ở lại ngành.
Đây là mức lợi nhuận tối thiểu để DN tiếp tục tồn tại.
4. Profit trong ngắn hạn (Short run profit)
DN quyết định: Sảnxuấtnếu: P ≥ AVC
Dừngtạmthời(shutdown)nếu: P < AVC Lý do:
Trong ngắn hạn FC là sunk → chỉ cần xem có đủ trả VC hay không.
5. Profit trong dài hạn (Long run profit)
DN tự do ra/vào thị trường Cạnh tranh hoàn hảo → dài hạn sẽ:
Economic profit = 0 (normal profit)
Giá thị trường = chi phí bình quân tối thiểu: P = min(LRAC)
6. Công thức tính nhanh profit (1) Total profit
π = TR − TC
π = Q × (P − ATC)
(2) Profit per unit
Profit per unit = P − ATC
(3) Maximizing profit (MQ): DN tối đa hoá lợi nhuận khi: MR = MC
Trong cạnh tranh hoàn hảo: MR = P
7. Tóm tắt ôn thi Khái niệm Ý chính Ghi nhớ nhanh
Accounting profit không tính chi phí cơ hội cao hơn economic profit
Economic profit có tính chi phí cơ hội
dùng để ra quyết định Khái niệm Ý chính Ghi nhớ nhanh Normal profit
economic profit = 0
DN vẫn sản xuất Short run
sản xuất nếu P ≥ AVC
shut down nếu P < AVC Long run
free entry/exit → π = 0 P = min(LRAC) Profit max MR = MC
cạnh tranh hoàn hảo → MR=P
CONSUMERS, PRODUCERS, AND THE EFFICIENCY OF MARKETS
I. Consumer Surplus (Thặng dư của người tiêu dùng)
Consumer surplus (CS) = the benefit buyers receive from participating in a market.
CS = Willingness to pay – actual price.
Graphically, it is the area below the demand curve and above the price.
When price falls → consumer surplus increases.
II. Producer Surplus (Thặng dư của người sản xuất)
Producer surplus (PS) = the benefit sellers receive when the market price is higher than their cost.
PS = Price – willingness to sell
Graphically → area above the supply curve and below the price.
Price rise → producer surplus increases.
III. Market Efficiency – Hiệu quả thị trường
Total surplus (TS) = CS + PS. = Net social benefit ( NSB )
TS measures the total economic welfare of buyers and sellers.
A market outcome is efficient when it maximizes total surplus. At equilibrium: o CS is maximized o PS is maximized o TS is maximized
→ This shows free markets are efficient. ( thị trường tự do hiệu quả )
IV. Benevolent Social Planner (Nhà hoạch định phúc lợi)
A hypothetical planner who wants to maximize
total social welfare.
He would choose the equilibrium outcome because it maximizes total surplus. Vietnamese
Một nhà hoạch định lý tưởng muốn tối đa hóa phúc lợi xã hội.
Điểm cân bằng thị trường là lựa chọn tối ưu vì tối đa hóa tổng thặng dư.
V. Market Failures – Khi thị trường không hiệu quả
Markets are not always efficient. Failures occur when:
1. Market power (monopolies, oligopolies)
2. Externalities (pollution, spillovers)
These distort supply or demand away from the social optimum. Vietnamese
Thị trường không phải lúc nào cũng hiệu quả. Thất bại xảy ra khi:
1. Quyền lực thị trường (độc quyền)
2. Ngoại ứng (ô nhiễm, tác động lan tỏa)
→ Khi đó, giá thị trường không phản ánh toàn bộ chi phí/lợi ích xã hội.
VI. Why Free Markets Are Good at Efficiency English
1. Markets allocate supply to buyers who value the good . most
2. Markets allocate demand to sellers who produce at lowest cost.
3. Equilibrium maximizes total surplus. Vietnamese
1. Thị trường giao hàng hóa cho người mua coi trọng hàng hóa nhất.
2. Thị trường chọn nhà sản xuất có chi phí thấp . nhất
3. Cân bằng thị trường tối đa hóa tổng thặng dư.
THE COSTS OF TAXATION
I. How Taxes Affect Market Participants – Thuế ảnh hưởng thế nào đến thị trường ENGLISH
A tax drives a wedge between the price buyers pay and the price sellers receive.
→Quantity,traded,falls.,→ Buyers pay more, sellers receive less.
The burden of tax (tax incidence) depends on elasticity:
More inelastic → bears more burden.
II. THE DEADWEIGHT LOSS OF TAXATION
1. Definition – Định nghĩa -
Deadweight loss (DWL) is the fall in total surplus resulting from a tax.
A tax eliminates some mutually beneficial trades. -
Tổn thất vô ích (DWL) là phần thặng dư bị mất do thuế gây ra.
Thuế làm biến mất các giao dịch có lợi cho cả người mua & người bán.
2. Why DWL Occurs – Tại sao có tổn thất vô ích?
- Because tax raises the price buyers pay and lowers the price sellers receive: →quantity falls below the socially efficient level.
Some buyers whose willingness to pay > sellers’ cost still do not trade because tax makes the deal impossible.
3. How to See DWL on the Graph – DWL trên đồ thị
- On a supply–demand graph:
- DWL is the triangle between the supply and demand curves
- located between equilibrium quantity and quantity after tax
=> Có những người mua sẵn sàng trả hơn chi phí sản xuất → nhưng thuế khiến giao dịch không xảy ra.
→ phúc lợi xã hội giảm.
III. Determinants of Deadweight Loss – Yếu tố quyết định tổn thất vô ích ENGLISH
1. Elasticity of supply o
More elastic supply → larger DWL
2. Elasticity of demand o
More elastic demand → larger DWL
3. Size of the tax o Larger tax → disproportionately larger DWL
(DWL grows more than proportionally to tax size → roughly quadratic) o
Thuế càng lớn → DWL tăng mạnh hơn tỷ lệ thuận (tăng theo dạng bình phương)
( thuế tăng 2 thì DWL tăng 3,4 lần )
IV. The Laffer Curve – Đường cong Laffer ENGLISH
The Laffer curve shows the relationship between tax rate and tax revenue. Key idea:
When tax is too high, increasing tax rate actually reduces tax revenue.
At low tax levels → increasing tax raises revenue
At high tax levels → increasing tax lowers revenue (people stop working/trading)
V. How Tax Revenue Changes with Tax Size – Doanh thu thuế và kích thước thuế
When tax increases from small to moderate → revenue increases.
When tax becomes very large → quantity traded falls sharply → revenue drops.
Governments must consider the trade-off between revenue and economic distortion.
Tài liệu liên quan:
-

Microeconomics Syllabus | Microeconomics | Trường Đại học Quốc tế, Đại học Quốc gia Thành phố Hồ Chí Minh
0 0 -

Microeconomics Course Syllabus & Assessment Details | Microeconomics | Trường Đại học Quốc tế, Đại học Quốc gia Thành phố Hồ Chí Minh
0 0 -

Assignment 3 - Elasticity MCQs and Key Concepts | Microeconomics | Trường Đại học Quốc tế, Đại học Quốc gia Thành phố Hồ Chí Minh
0 0 -

Assignment 2 - Economic Equilibrium Analysis of Fridges and Motorcycles | Microeconomics | Trường Đại học Quốc tế, Đại học Quốc gia Thành phố Hồ Chí Minh
0 0 -
Assignment 4_ Analyzing Elasticity and Luxury Tax Implications | Microeconomics | Trường Đại học Quốc tế, Đại học Quốc gia Thành phố Hồ Chí Minh
0 0