Production Possibilities Analysis | Microeconomics | Trường Đại học Quốc tế, Đại học Quốc gia Thành phố Hồ Chí Minh
If the economy is currently at point C: - What is the cost of one million more cars? o Point C : There are 4 million cars and 21 thousand guided missiles. o From point C to D : The number of cars is 2 million more and the number of missiles is 9 thousand less => So the opportunity cost of one million more cars is about 9 2 thousand guided missiles. - What is the cost of one thousand more guided missiles? o From point C to B : Increased in the number of guided missiles is 6 thousand and the decreased in the number of cars is 2 million. o => The opportunity cost for the production of 1 thousand more guided missiles is 1/3 million of cars. Tài liệu được sưu tầm và soạn thảo dưới dạng file PDF để gửi tới các bạn cùng tham khảo, ôn tập đầy đủ kiến thức, chuẩn bị cho các buổi học thật tốt. Mời bạn đọc đón xem!
Môn: Microeconomics 613 tài liệu
Trường: Trường Đại học Quốc tế, Đại học Quốc gia Thành phố Hồ Chí Minh 1.9 K tài liệu
Tác giả:

Preview text:
Group assignment presentation 1
Full name: Bùi Minh Huyền Student ID: 11222845
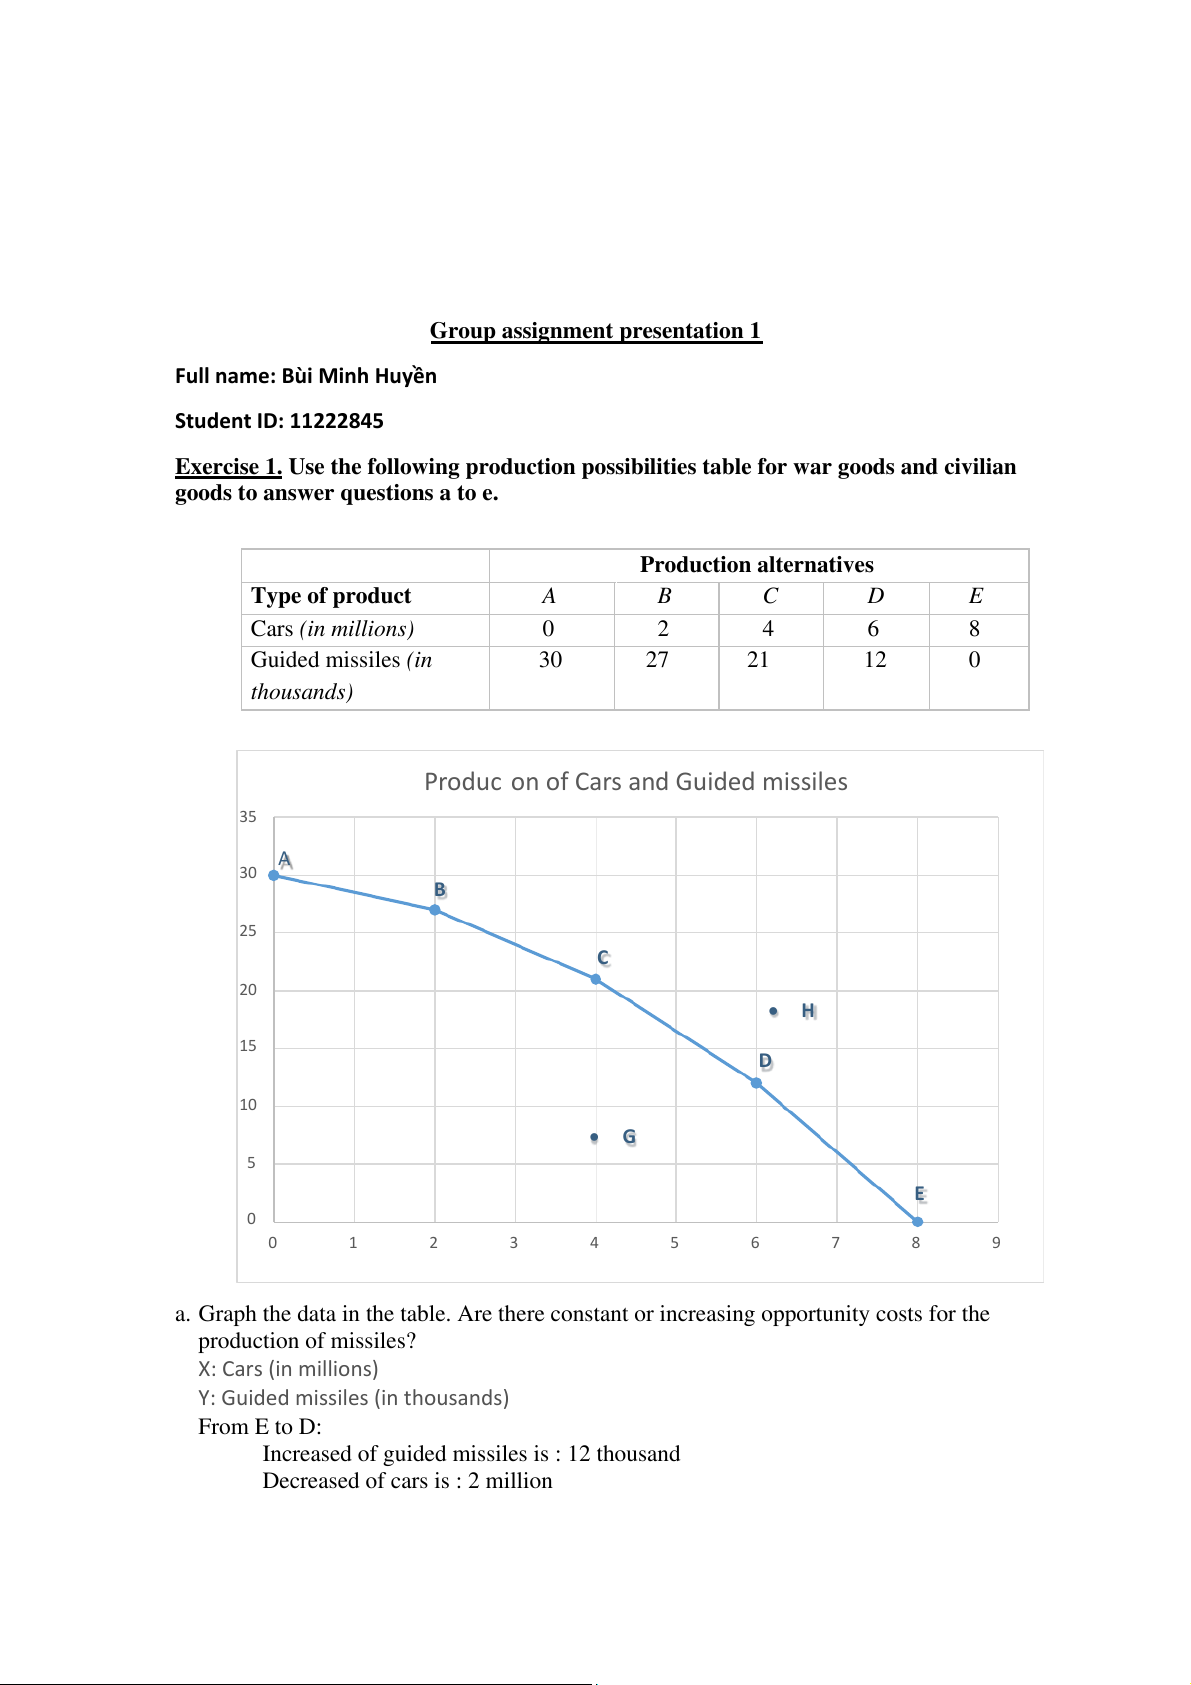
Exercise 1. Use the following production possibilities table for war goods and civilian
goods to answer questions a to e.
Production alternatives Type of product A B C D E Cars (in millions) 0 2 4 6 8 Guided missiles (in 30 27 21 12 0 thousands)
Production of Cars and Guided missiles 35 A 30 B 25 C 20 H 15 D 10 G 5 E 0 0 1 2 3 4 5 6 7 8 9
a. Graph the data in the table. Are there constant or increasing opportunity costs for the production of missiles? X: Cars (in millions)
Y: Guided missiles (in thousands) From E to D:
Increased of guided missiles is : 12 thousand
Decreased of cars is : 2 million
The opportunities cost for the production is : 2/12 = 1/6 million cars
Similar: +) From D to C is : 2/9 million cars
+) From C to B is : 2/6 = 1/3 million cars
+) From B to A is : 2/3 million cars
So there are an increasing opportunity costs for the production of guided missiles (in thousands)
b. If the economy is currently at point C:
- What is the cost of one million more cars?
o Point C : There are 4 million cars and 21 thousand guided missiles.
o From point C to D : The number of cars is 2 million more and the number of missiles is 9 thousand less
=> So the opportunity cost of one million more cars is about 9 thousand guided 2 missiles.
- What is the cost of one thousand more guided missiles?
o From point C to B : Increased in the number of guided missiles is 6
thousand and the decreased in the number of cars is 2 million.
o => The opportunity cost for the production of 1 thousand more guided
missiles is 1/3 million of cars.
c. Label a point G inside the curve of the graph. What does it indicate?
o Point G means that business is inefficient. Goods are produced but not
using maximum potential. None of the products use the full workforce ability.
d. Label a point H that lies outside the PPF curve. -
What does this point indicate?
o This point means that business do not have the ability to manage that
amount of goods while trying to ensure economic efficiency. -
What must occur before the economy can attain the level of
production indicated by point H?
o There must be more workers, land, labor, factories,… to attain
the level of production indicated by point H.
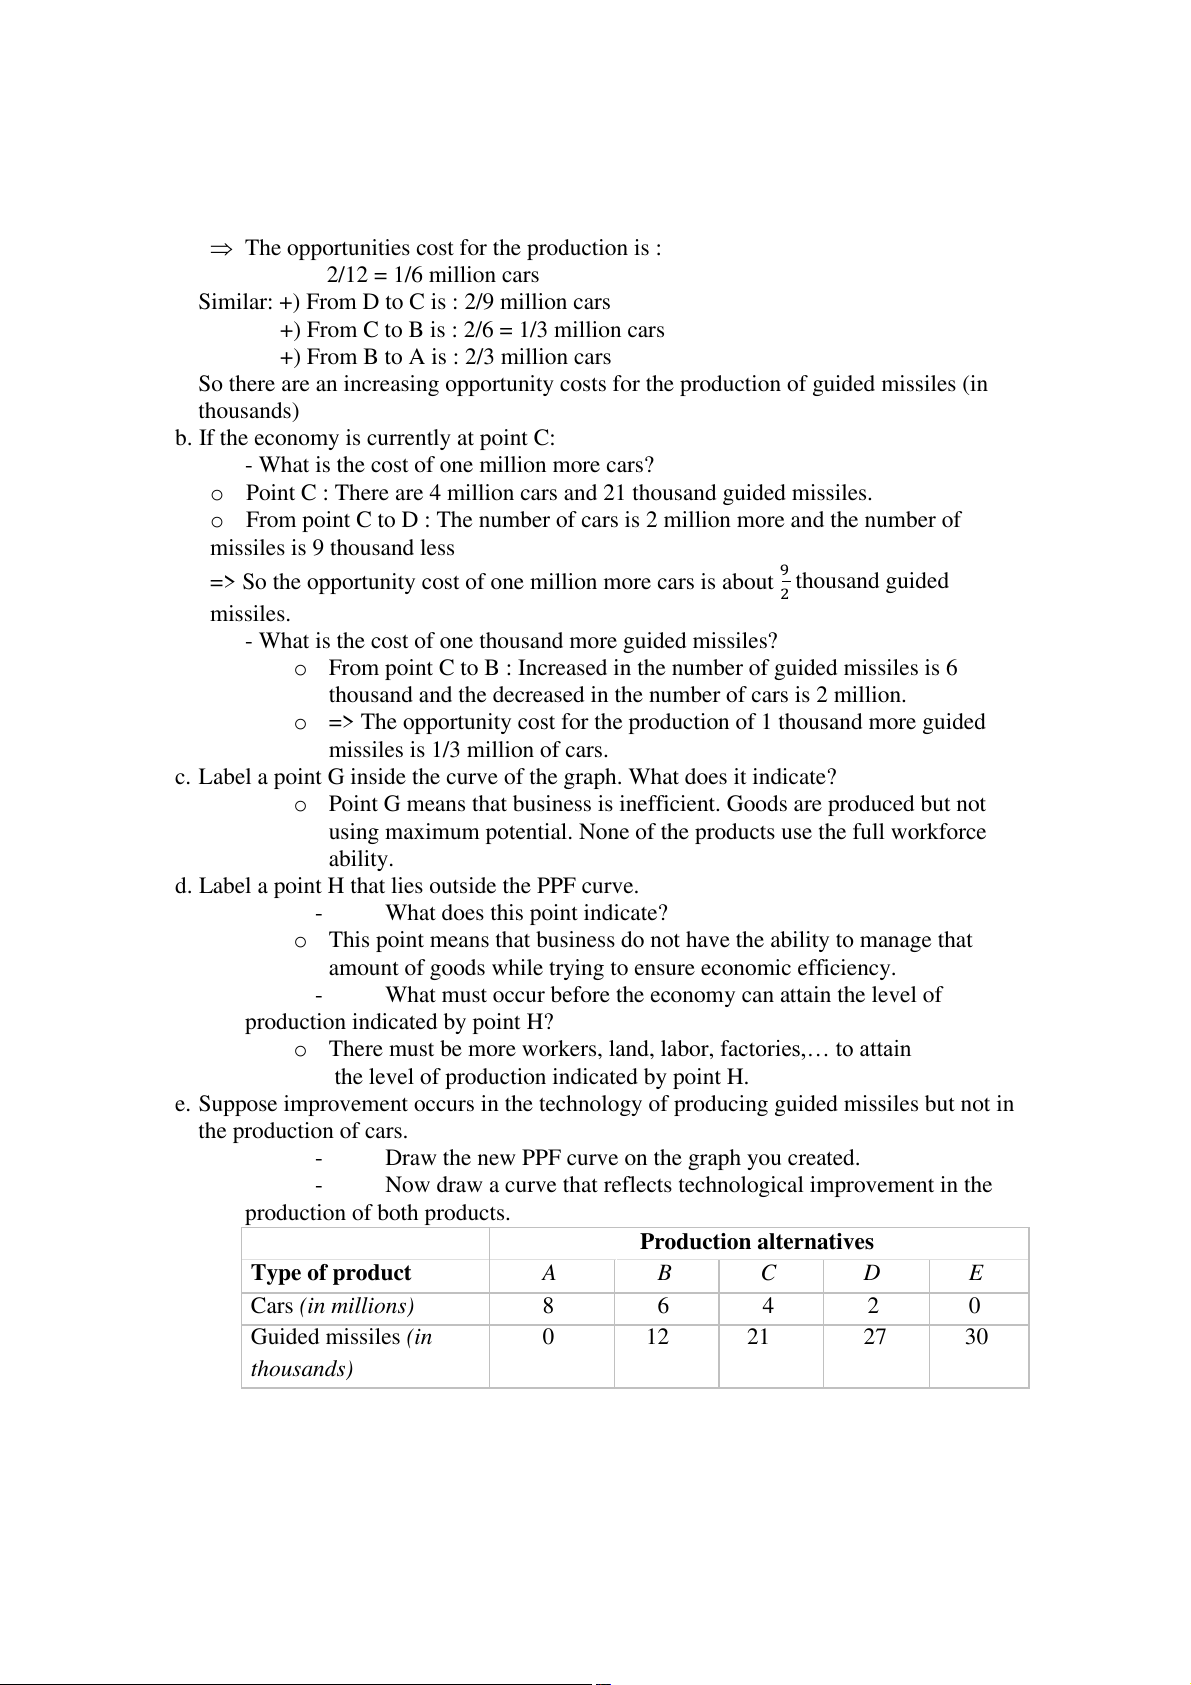
e. Suppose improvement occurs in the technology of producing guided missiles but not in the production of cars. -
Draw the new PPF curve on the graph you created. -
Now draw a curve that reflects technological improvement in the production of both products.
Production alternatives Type of product A B C D E Cars (in millions) 8 6 4 2 0 Guided missiles (in 0 12 21 27 30 thousands)
Production of Cars and Guided missiles 10 A 8 B 6 C 4 D 2 E 0 0 5 10 15 20 25 30 35 X: Guided missiles Y: Cars
Exercise 2. Assume that a simple economy has 2 industries which produce wheat and
cloths. Resources to produce these products are scarce and used effectively. The
following table represents the possible combinations of output between wheat and
cloths that this economy produces in a given year. Alternatives Output of wheat (tons)
Output of cloths (1000 set) A 25 0 B 20 4 C 15 7 D 9 9 E 0 10
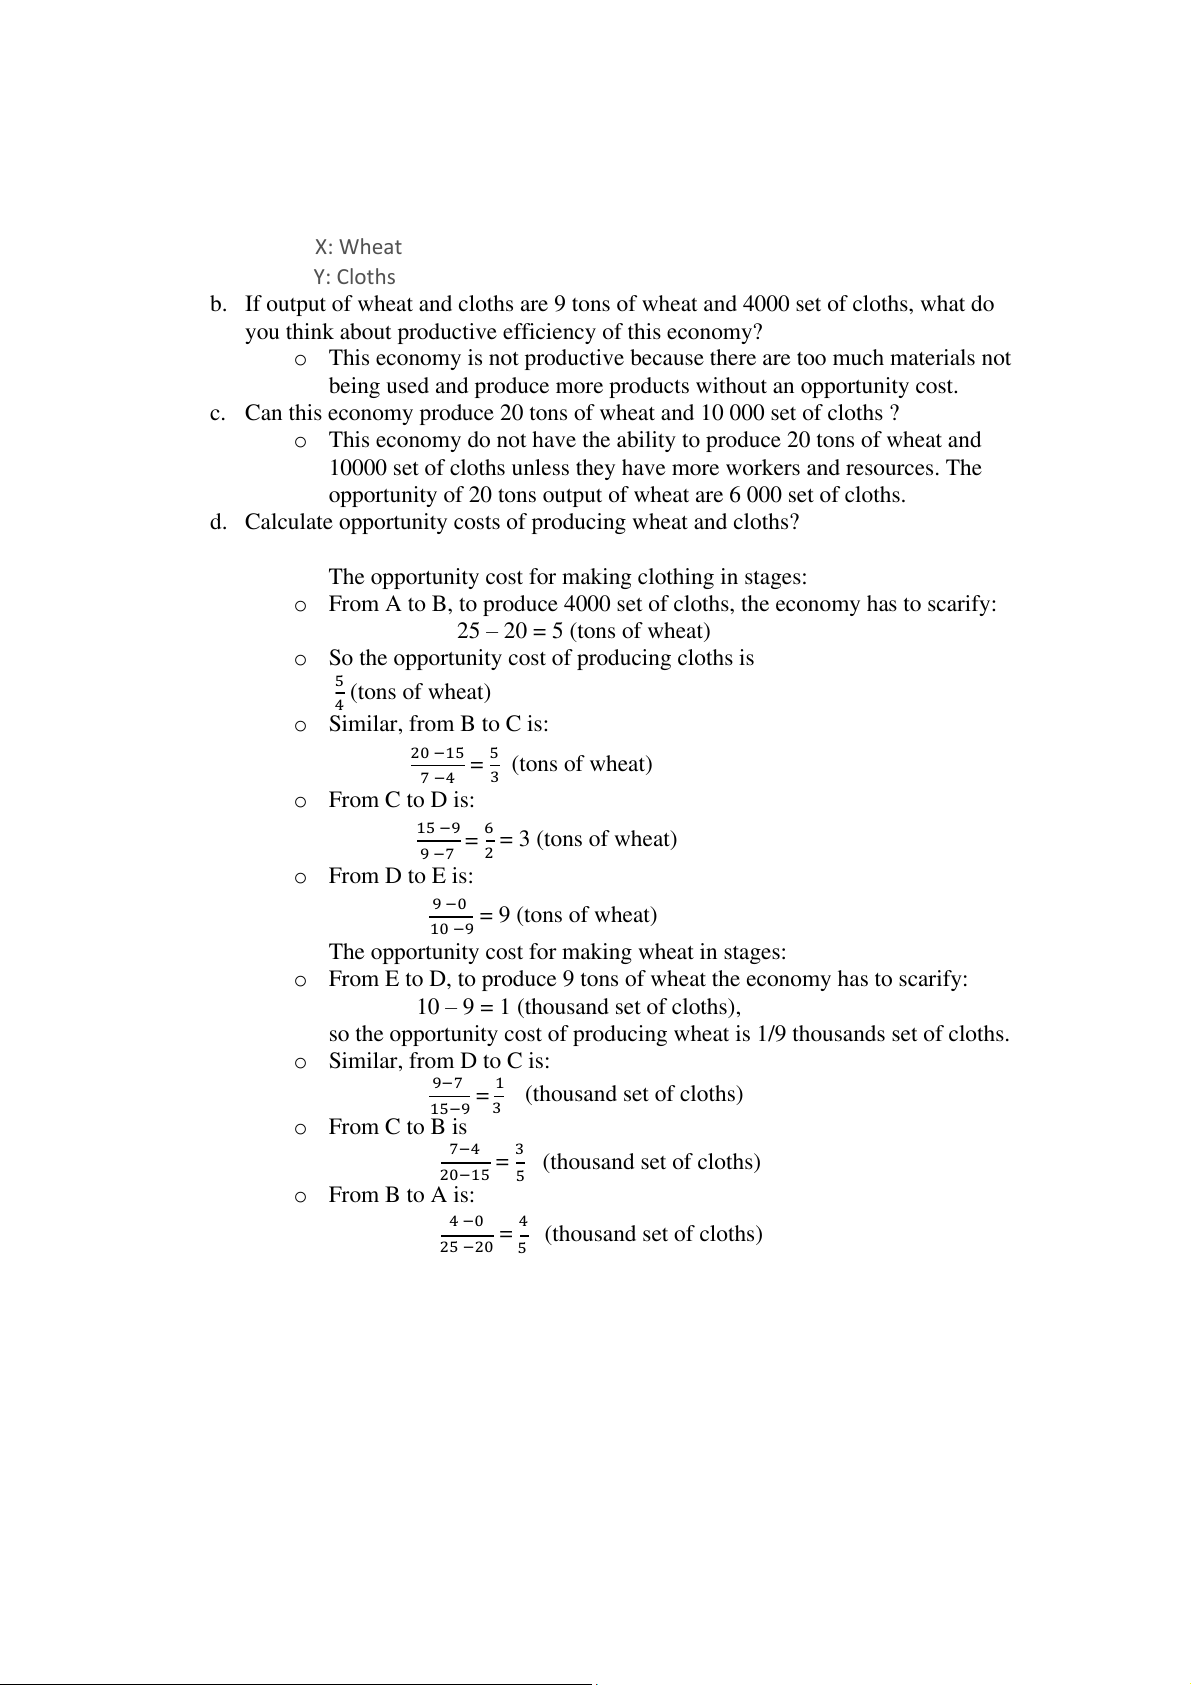
a. Draw the production possibility frontier (PPF) curve for this economy Output of wheat and cloths 12 A 10 B 8 C 6 D 4 2 E 0 0 5 10 15 20 25 30 X: Wheat Y: Cloths
b. If output of wheat and cloths are 9 tons of wheat and 4000 set of cloths, what do
you think about productive efficiency of this economy?
o This economy is not productive because there are too much materials not
being used and produce more products without an opportunity cost.
c. Can this economy produce 20 tons of wheat and 10 000 set of cloths ?
o This economy do not have the ability to produce 20 tons of wheat and
10000 set of cloths unless they have more workers and resources. The
opportunity of 20 tons output of wheat are 6 000 set of cloths.
d. Calculate opportunity costs of producing wheat and cloths?
The opportunity cost for making clothing in stages:
o From A to B, to produce 4000 set of cloths, the economy has to scarify: 25 20 = – 5 (tons of wheat)
o So the opportunity cost of producing cloths is 5 (tons of wheat) 4 o Similar, from B to C is: 20 −15 = 5 (tons of wheat) 7 −4 3 o From C to D is:
15 −9 = 6 = 3 (tons of wheat) 9 −7 2 o From D to E is: 9 −0 = 9 (tons of wheat) 10 −9
The opportunity cost for making wheat in stages:
o From E to D, to produce 9 tons of wheat the economy has to scarify: 10 9 = – 1 (thousand set of cloths),
so the opportunity cost of producing wheat is 1/9 thousands set of cloths. o Similar, from D to C is:
9−7 = 1 (thousand set of cloths) 15−9 3 o From C to B is
7−4 = 3 (thousand set of cloths) 20−15 5 o From B to A is: 4 −0 = 4 (thousand set of cloths) 25 20 − 5
Tài liệu liên quan:
-
Tự Luận Vimo: Phân Tích Cung, Cầu và Thị Trường Cạnh Tranh| Microeconomics | Trường Đại học Quốc tế, Đại học Quốc gia Thành phố Hồ Chí Minh
5 3 -
Review Questions: Thinking Like an Economist | Microeconomics | Trường Đại học Quốc tế, Đại học Quốc gia Thành phố Hồ Chí Minh
5 3 -
Final Exam Quizlet Questions & Answers | Microeconomics | Trường Đại học Quốc tế, Đại học Quốc gia Thành phố Hồ Chí Minh
5 3 -
Đề thi giữa kỳ II | Microeconomics | Trường Đại học Quốc tế, Đại học Quốc gia Thành phố Hồ Chí Minh
5 3 -
Final Group Project_ The Beer Industry | Microeconomics | Trường Đại học Quốc tế, Đại học Quốc gia Thành phố Hồ Chí Minh
4 2