Review: Final Exam Notes on Location, Layout & Supply Chain | Môn Production and Operations Management - Trường Đại học Quốc tế, Đại học Quốc gia Thành phố Hồ Chí Minh
Country decision là một quyết định dành cho những công ty đa quốc gia, ví dụ những sản phẩm đó mình có thể mang bán ra ở bên nước ngoài được. Tài liệu được sưu tầm gồm 30 trang, giúp bạn ôn tập tốt hơn. Mời các bạn đón xem.
Môn: Production and Operations Management 10 tài liệu
Trường: Trường Đại học Quốc tế, Đại học Quốc gia Thành phố Hồ Chí Minh 1.9 K tài liệu
Tác giả:


Preview text:
lOMoAR cPSD| 58097008 REVIEW POM FINAL
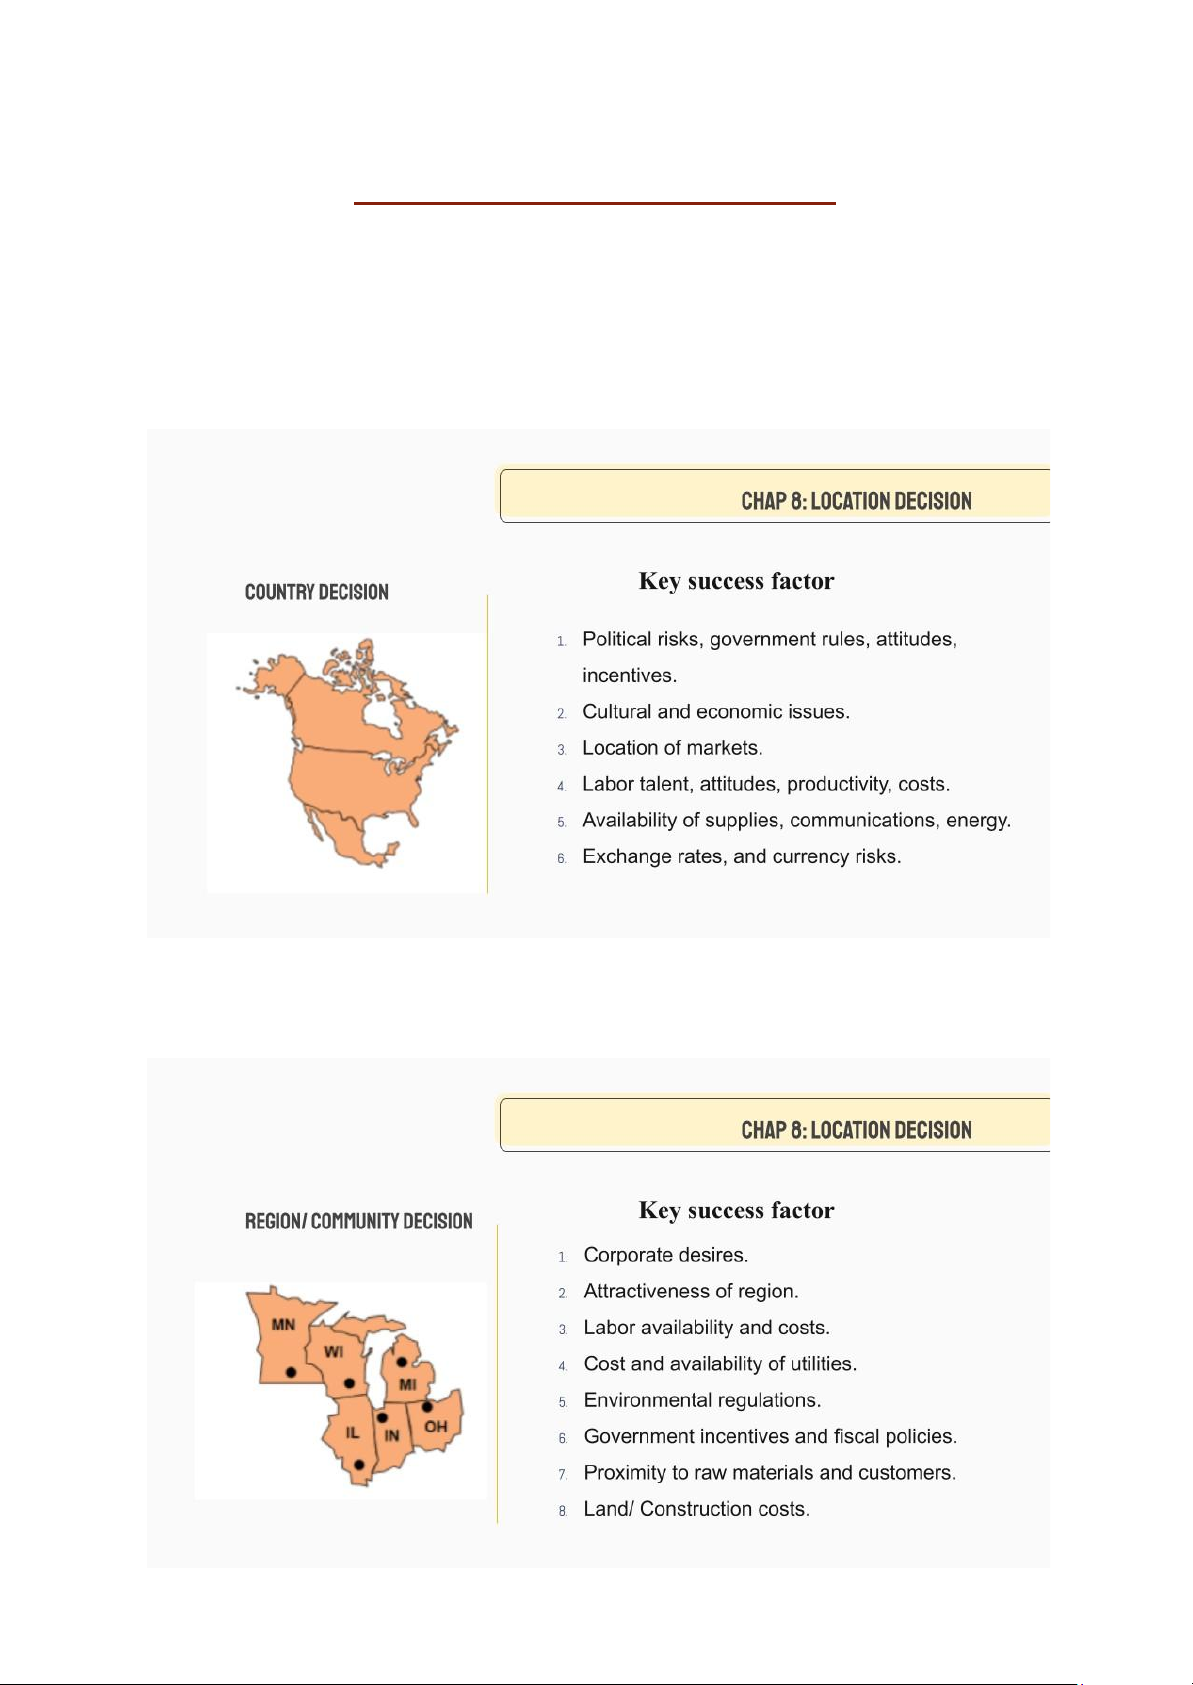
CHAP 8: LOCATION DECISION
Country decision: Là một quyết định dành cho những công ty đa quốc
gia, ví dụ những sản phẩm đó mình có thể mang bán ra ở bên nước ngoài được.
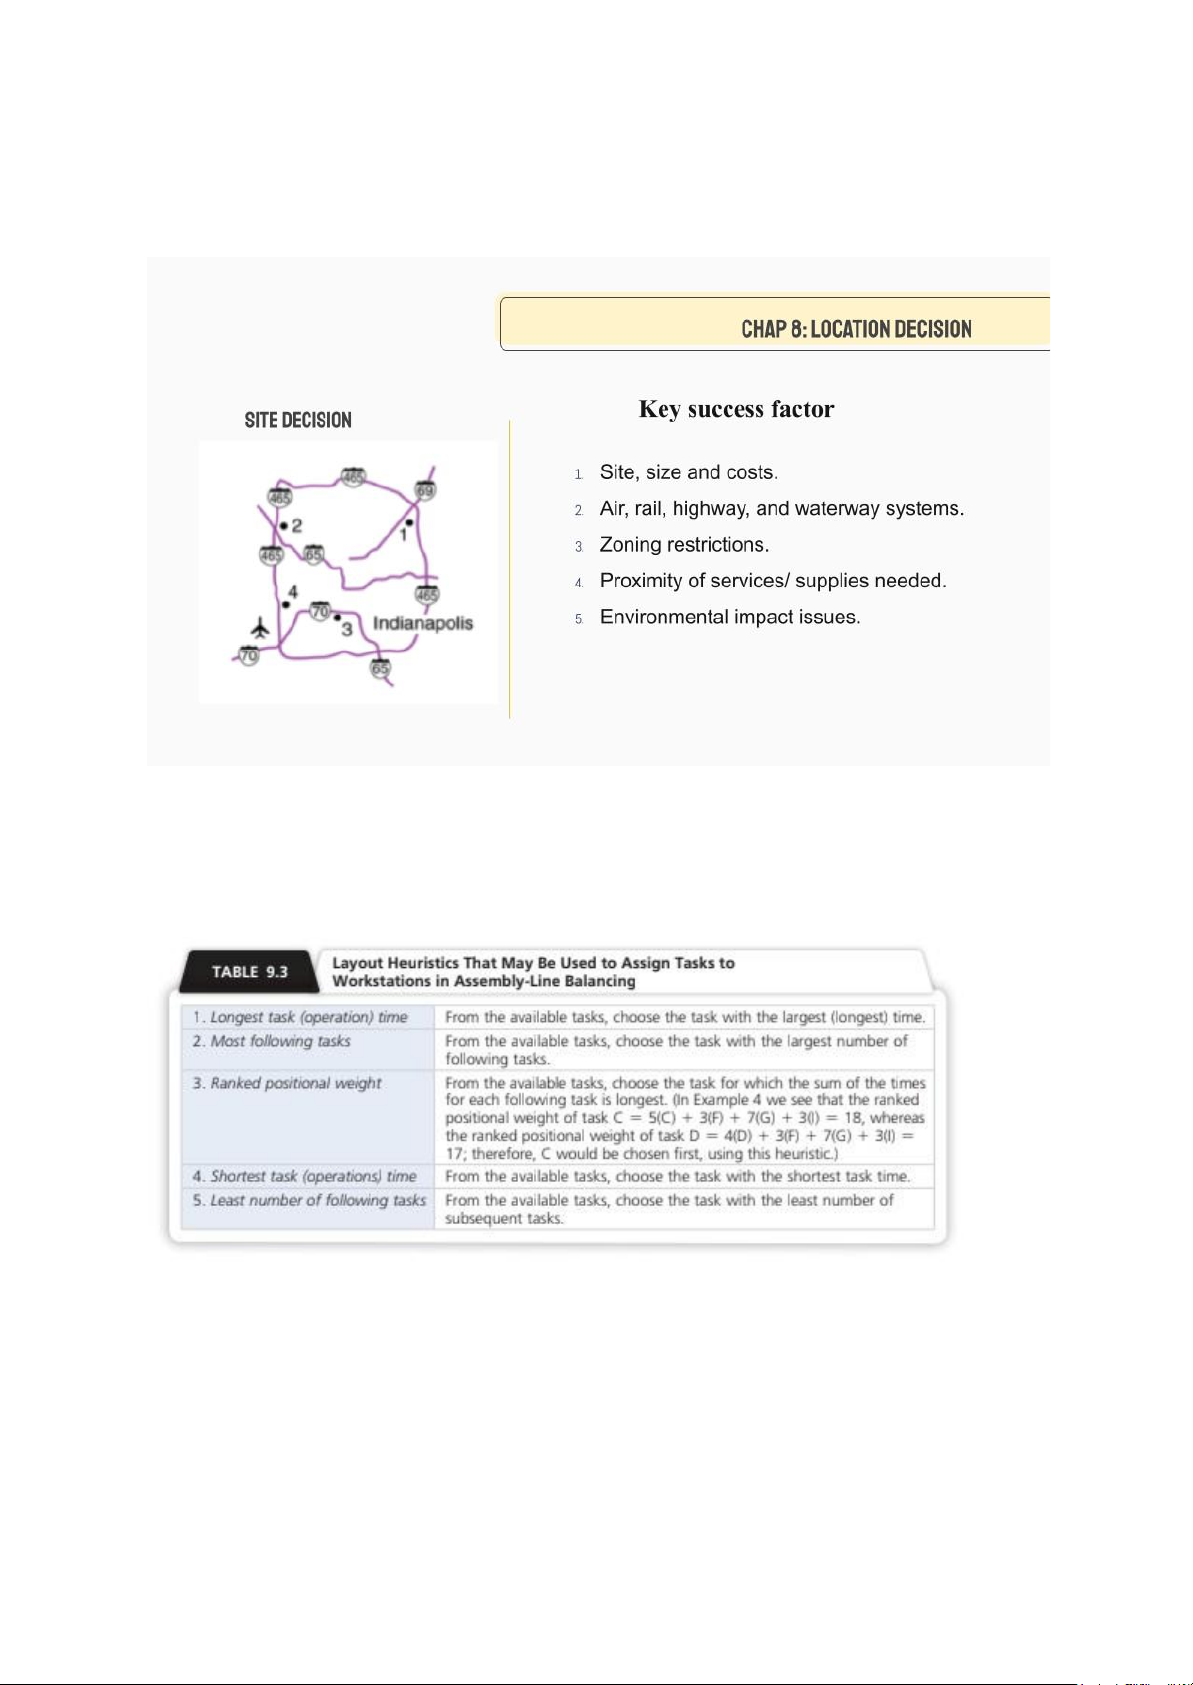
Region/ Community decision: Trong cùng một đất nước nhưng khác thành
phố —> sản phẩm vùng miền. lOMoAR cPSD| 58097008
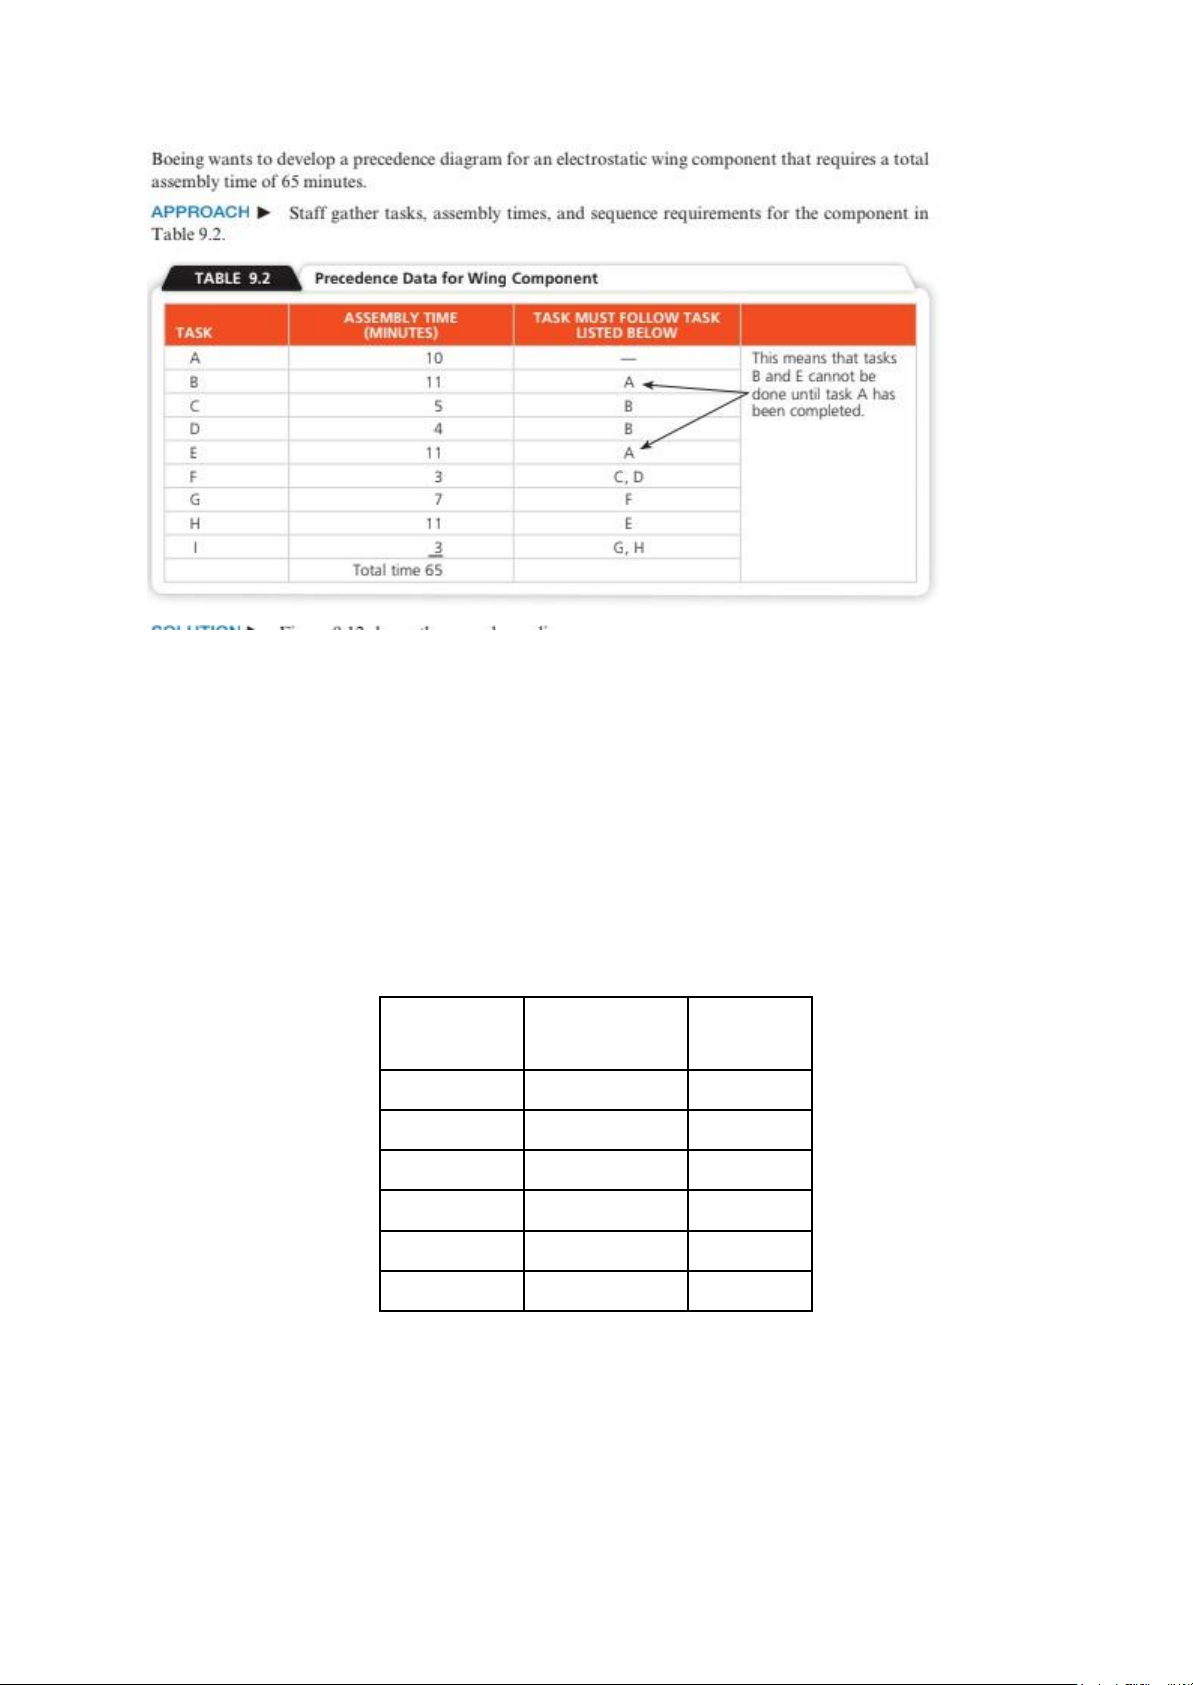
Site decision: Chung một thành phố nhưng khác quận với nhau, khác địa điểm
trong một quận, cùng một thành phố nhưng khác địa điểm với nhau. —> sản
phẩm trong một thành phố. CHAP 9: LAYOUT DECISION
PRECEDENCE DIAGRAM - LINE BALANCING
Lưu ý: phải đổi các đơn vị thời gian cho đồng nhất với nhau
Cycle time: thời gian tối đa trong một trạm, khi gộp trạm thì total time trong trạm
không vượt quá cycle time.
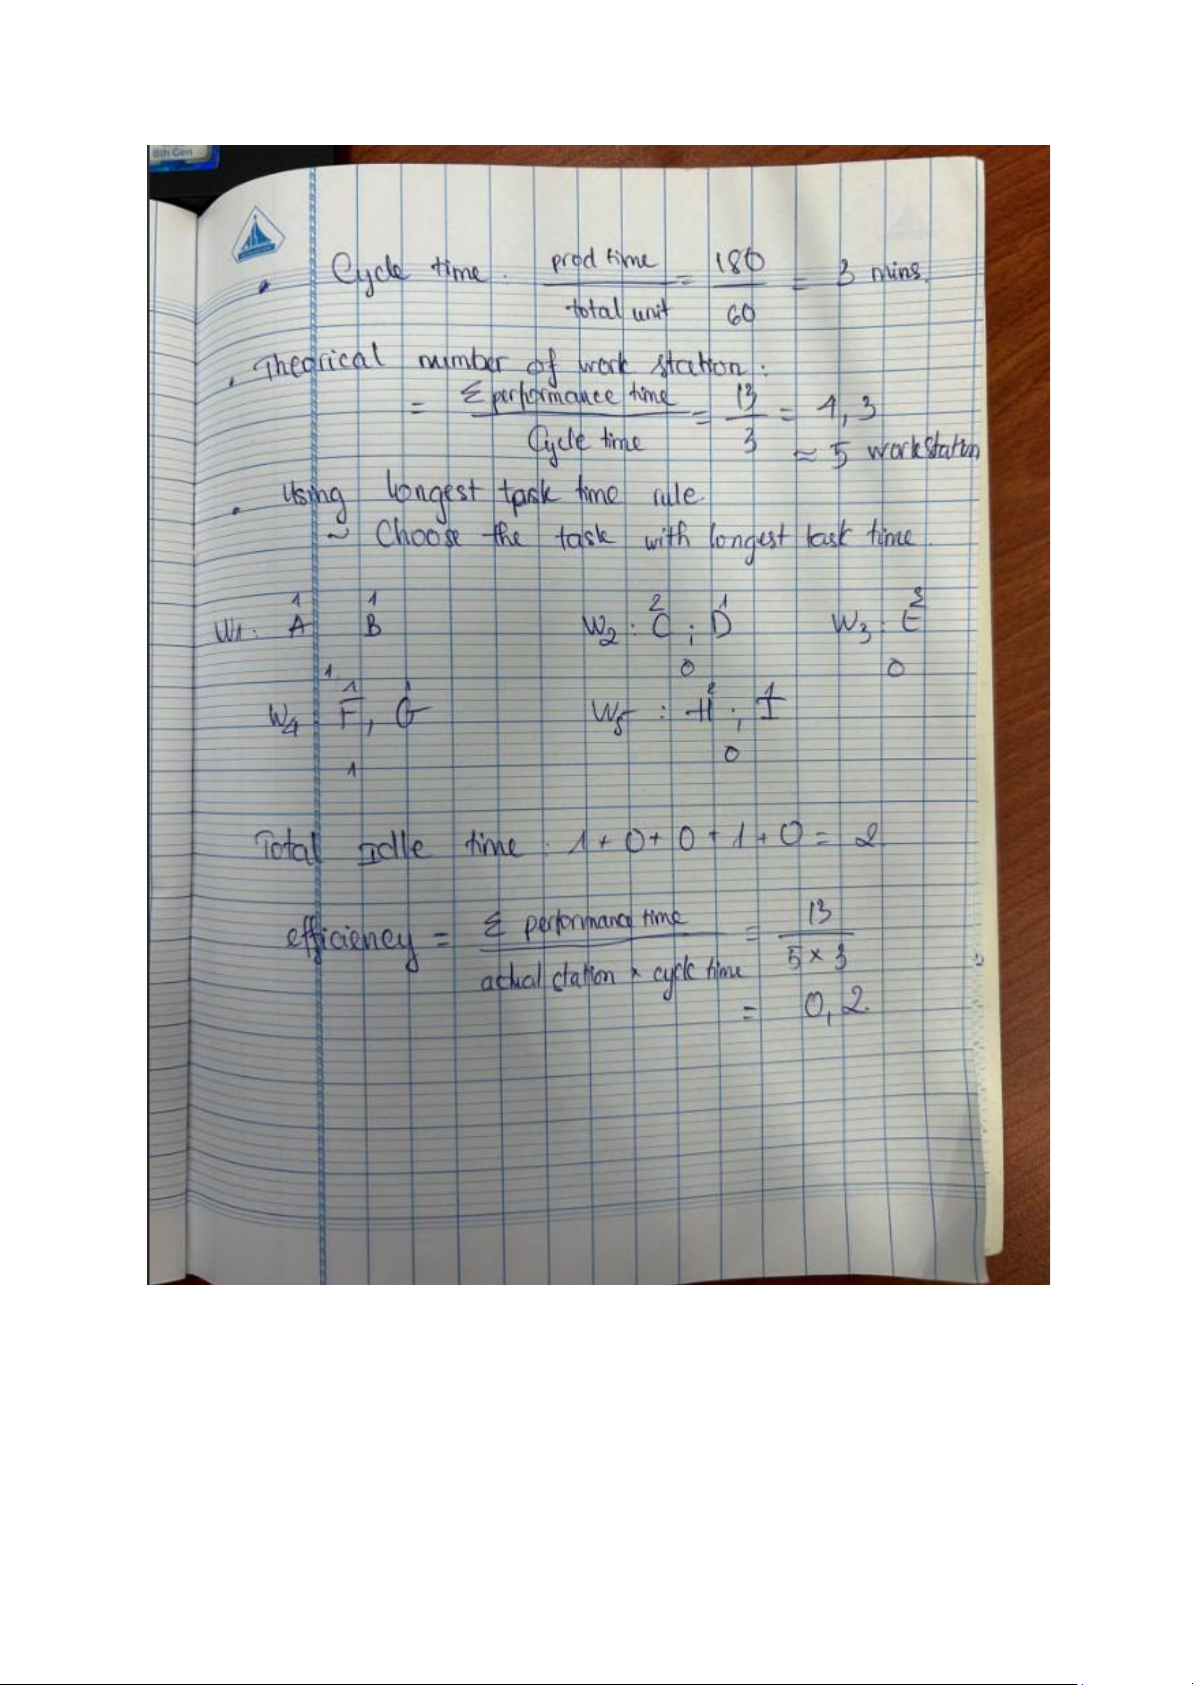
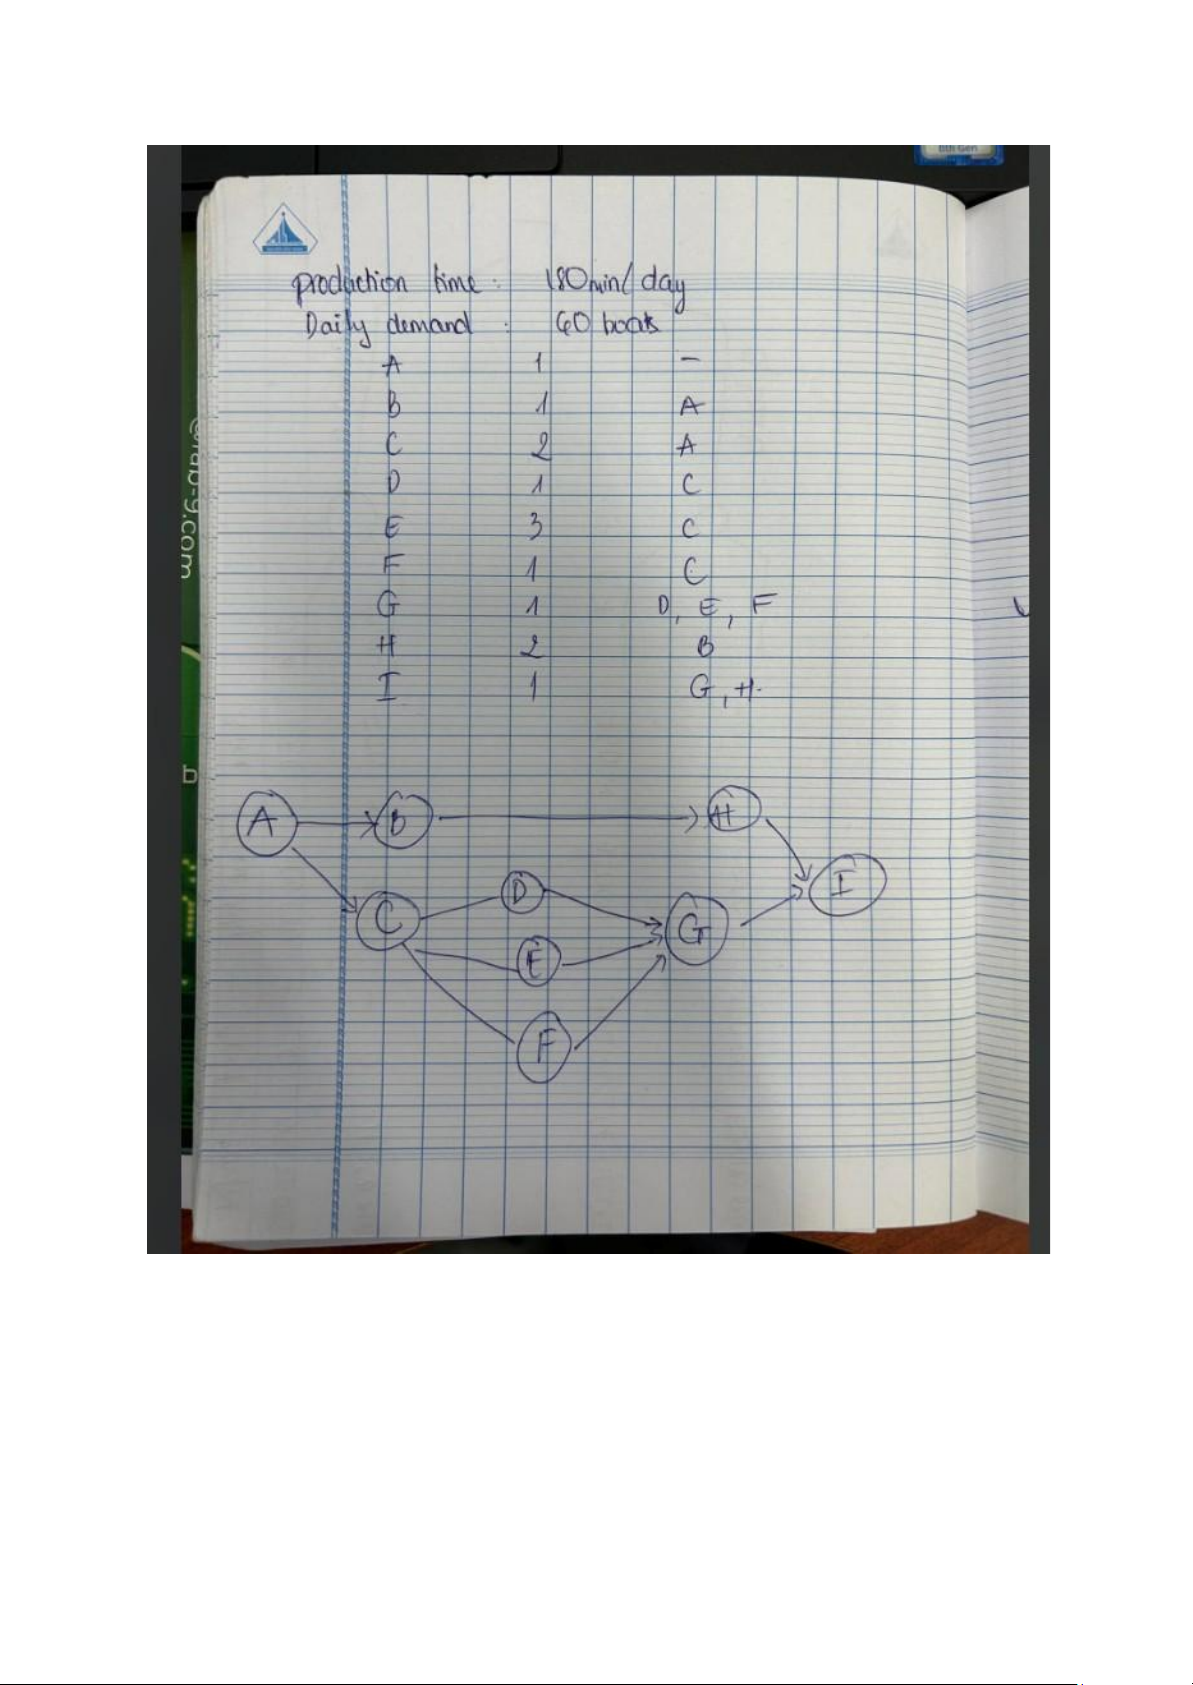
Production time: thời gian hoạt động của công ty Example: 1. lOMoAR cPSD| 58097008
On the basis of the precedence diagram and activity times given in Example 3,
Boeing determines that there are 480 productive minutes of work available per
day. Furthermore, the production schedule requires that 40 units of the wing
component be completed as output from the assembly line each day. It now
wants to group the tasks into workstations. What is the efficiency ?
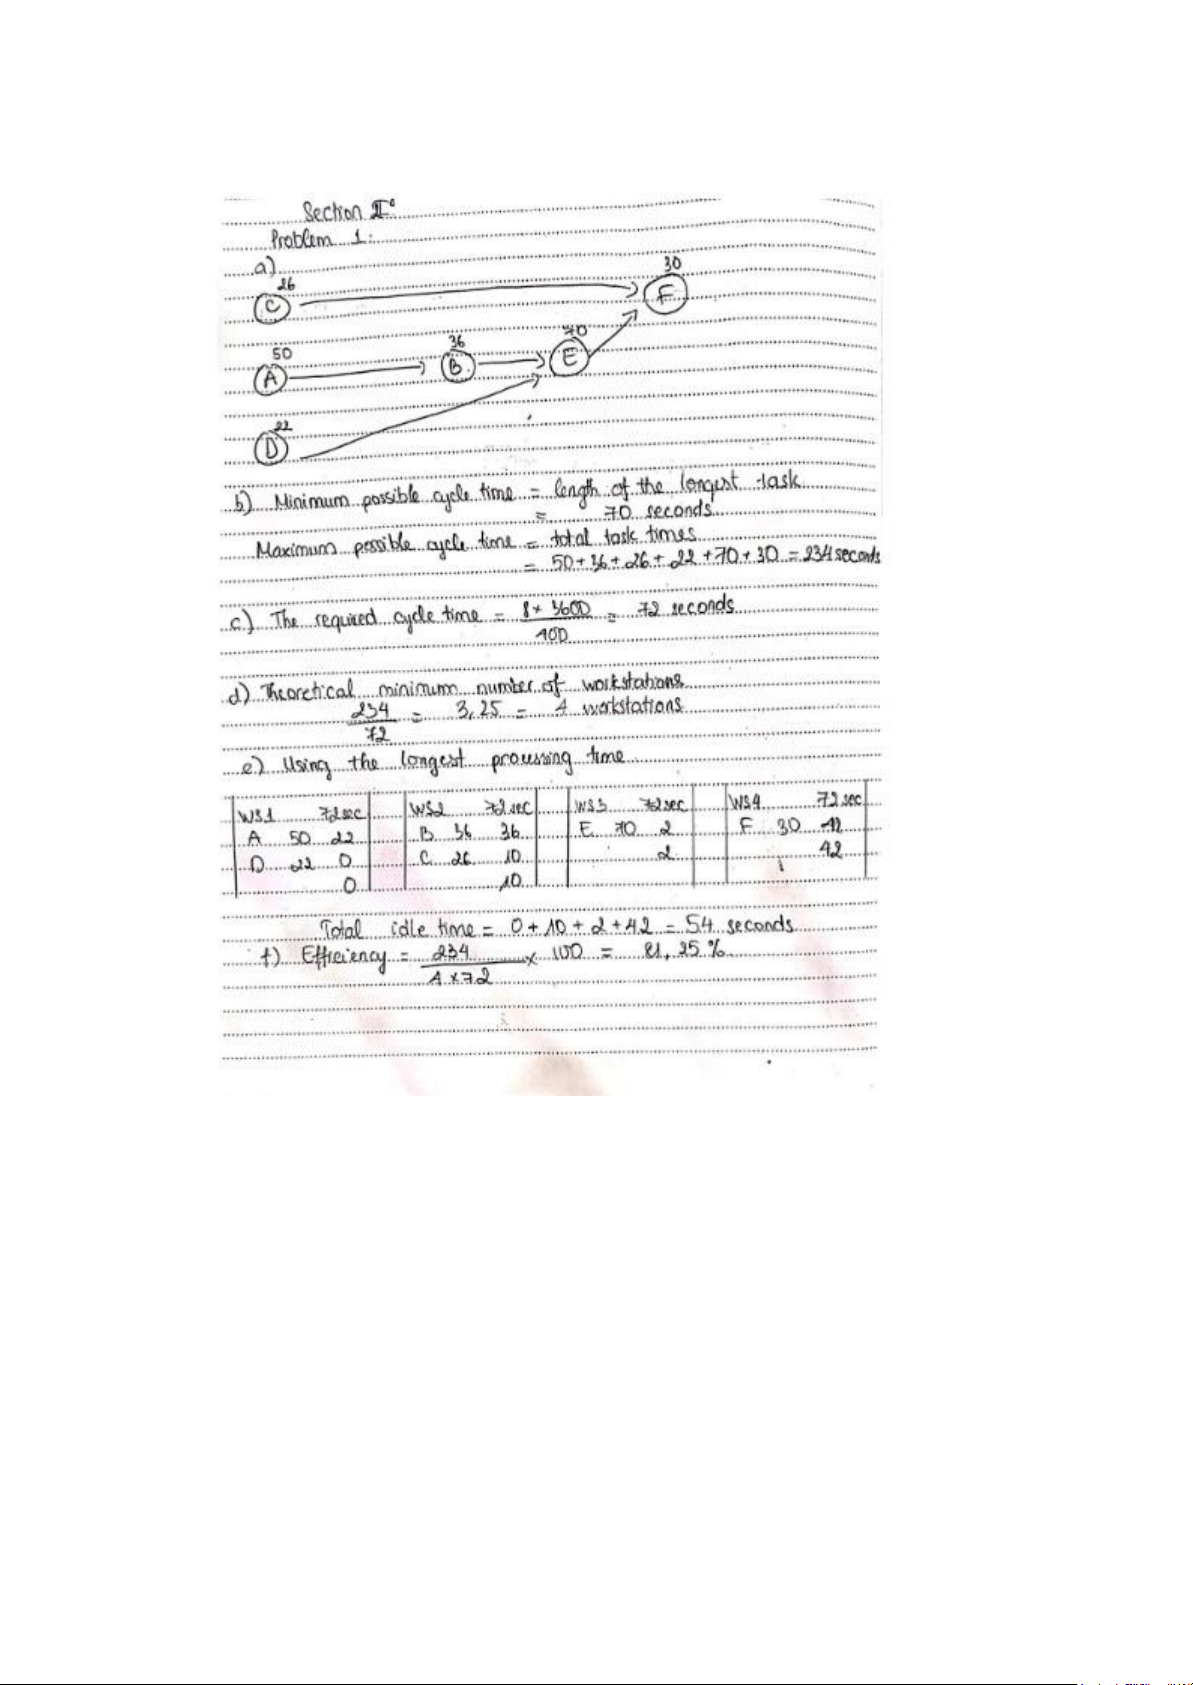
2. A furniture company is designing a product layout for a new product. It plans
to use this production line eight hours a day in order to meet a schedule of 400
units per day. The tasks necessary to produce this product are detailed in the table below: Task Predecessor Time (seconds) A - 50 B A 36 C - 26 D - 22 E B, D 70 F C, E 30
a) Draw the network described in the table.
b) Without regard to a production schedule, what is the minimum possible
cycle time (in seconds) for this situation; what is the maximum?
c) What is the required cycle time (in seconds) in order to meet the schedule?
d) What is the theoretical minimum number of workstations needed to meet the schedule?
e) Balance this line using the longest processing time.
f) What is the efficiency of the balance obtained in part e?
**minimum possible cycle time = length of the longest task lOMoAR cPSD| 58097008
**maximum possible cycle time = total task time lOMoAR cPSD| 58097008
CHAP 11: SUPPLY CHAIN MANAGEMENT
Phải nêu định nghĩa trong sách, nhớ paraphrase
Khi một công ty được mở ra, chuỗi cung ứng của nó sẽ quyết định một lĩnh
vực, một vấn đề hoặc một công việc nào đó mình có nên outsource cho người
khác hay không (có nên thuê người khác làm giúp mình hay mình sẽ tự làm công việc đó).
- Đây là 6 cách để công ty cảm thấy cái nào phù hợp cho mình.
- Many suppliers: dành cho những công ty bán nhu yếu phẩm như chai, lọ,
thùng giấy, v.v —> có rất nhiều nhà cung cấp. Ví dụ cho công ty A sản xuất
hộp giấy, đồng thời cũng xuất hiện nhà cung cấp B, C cùng sản xuất như A,
cho nên sự cạnh tranh rất lớn lOMoAR cPSD| 58097008
(vì ai cũng mong muốn khách hàng sẽ hài lòng với sản phẩm của mình). Vậy
nên mặt hàng của các suppliers này đối với công ty của chúng ta có giá trị rất
cao khi lựa chọn. Thì mình sẽ cân nhắc lựa chọn suppliers phù hợp bằng cách
lựa chọn giá thành rẻ, đàm phán tốt, mặt lợi và hại khi lựa chọn supplier này,
v.v. —> Nhiệm vụ của các suppliers ở đây là (1) Cung cấp hàng hoá, (2) Nghiên
cứu thị trường, tức là công ty của mình có thích sản phẩm của họ hay không,
họ sẽ cố gắng hoàn thiện cho sản phẩm của họ phù hợp với thị hiếu từ công
ty mình. —> Có rất nhiều nhà cung cấp, và công ty của mình cũng có nhiều
options để lựa chọn nhà cung cấp phù hợp.
- Few suppliers: chỉ có một số nhà cung cấp chủ chốt mà thôi. Thay vì đánh
vào chi phí như Many suppliers thì mình sẽ đánh vào mối quan tâm, mối quan
hệ giữa các suppliers với nhau. Vì nhà cung cấp sẽ tạo điều kiện cho công ty
mình phát triển (ví dụ như công ty Coca-Cola, nhà cung cấp chai lọ có mẫu
mã thiết kế càng đẹp —> bán càng nhiều sản phẩm), và mối quan hệ cũng
rất quan trọng, phải hợp tác với nhau để cùng phát triển công ty. Vậy nên nếu
thay đổi một trong các nhà cung cấp chủ chốt ở đây, giá thành sẽ tăng cao,
bởi rủi ro về chi phí cũng như offer từ nhà cung cấp mới với nhà cung cấp cũ
là rất lớn, không thể kiểm soát được. Mức độ phụ thuộc là 100%.
- Vertical integration: không đòi hỏi mình phụ thuộc vào một nhà cung cấp
nào hết, mình sẽ tự tạo ra đại lý của riêng mình, tự sản xuất, tự cung cấp và
tự bán ra. —> Tự thân vận động là chính, vừa backward vừa forward. (Ví dụ:
Zara). Bất lợi ở chỗ là thiếu ý tưởng, như Zara chỉ độc quyền một ý tưởng thì
rất khó để phát triển công nghệ may mặc trong công ty —> chuyển qua strategy 4.
- Joint ventures: liên doanh hợp tác với nhau, nghĩa là công ty mình sẽ hợp
tác với supplier của mình. Ví dụ tại Zara, nhân viên trong công ty có ý tưởng
và hợp tác với retailer, retailer cũng nảy ra ý tưởng mới —> tạo ra sự phong
phú, đa dạng cho công ty Zara.
- Keiretsu networks: là sự kết hợp giữa Few suppliers và Vertical integration,
mình sẽ đánh vào mối quan hệ chủ chốt với một số nhà cung cấp và cùng
hợp tác với nhau —> hai bên đều tin tưởng lẫn nhau, chia sẻ qua lại với nhau
về chuyên môn (ví dụ A có bí kíp may đồ, B có ý tưởng hay thì A và B sẽ hợp
tác với nhau), vì có mối liên hệ hợp tác chặt chẽ nên quy định cũng rất chặt
chẽ (về thời gian giao hàng, chi phí từ nhà cung cấp, v.v) lOMoAR cPSD| 58097008
- Virtual companies: demand for service là chủ yếu (ví dụ A đồng ý cung cấp
cho B dịch vụ về thiết kế, kiểm tra sản phẩm, v.v) 2 strategy :
- Supply chain strategy : thay đổi cost of supply chain
- Sale strategy: thay đổi phương pháp sale => thay đổi tất cả các chi phí như đề cho
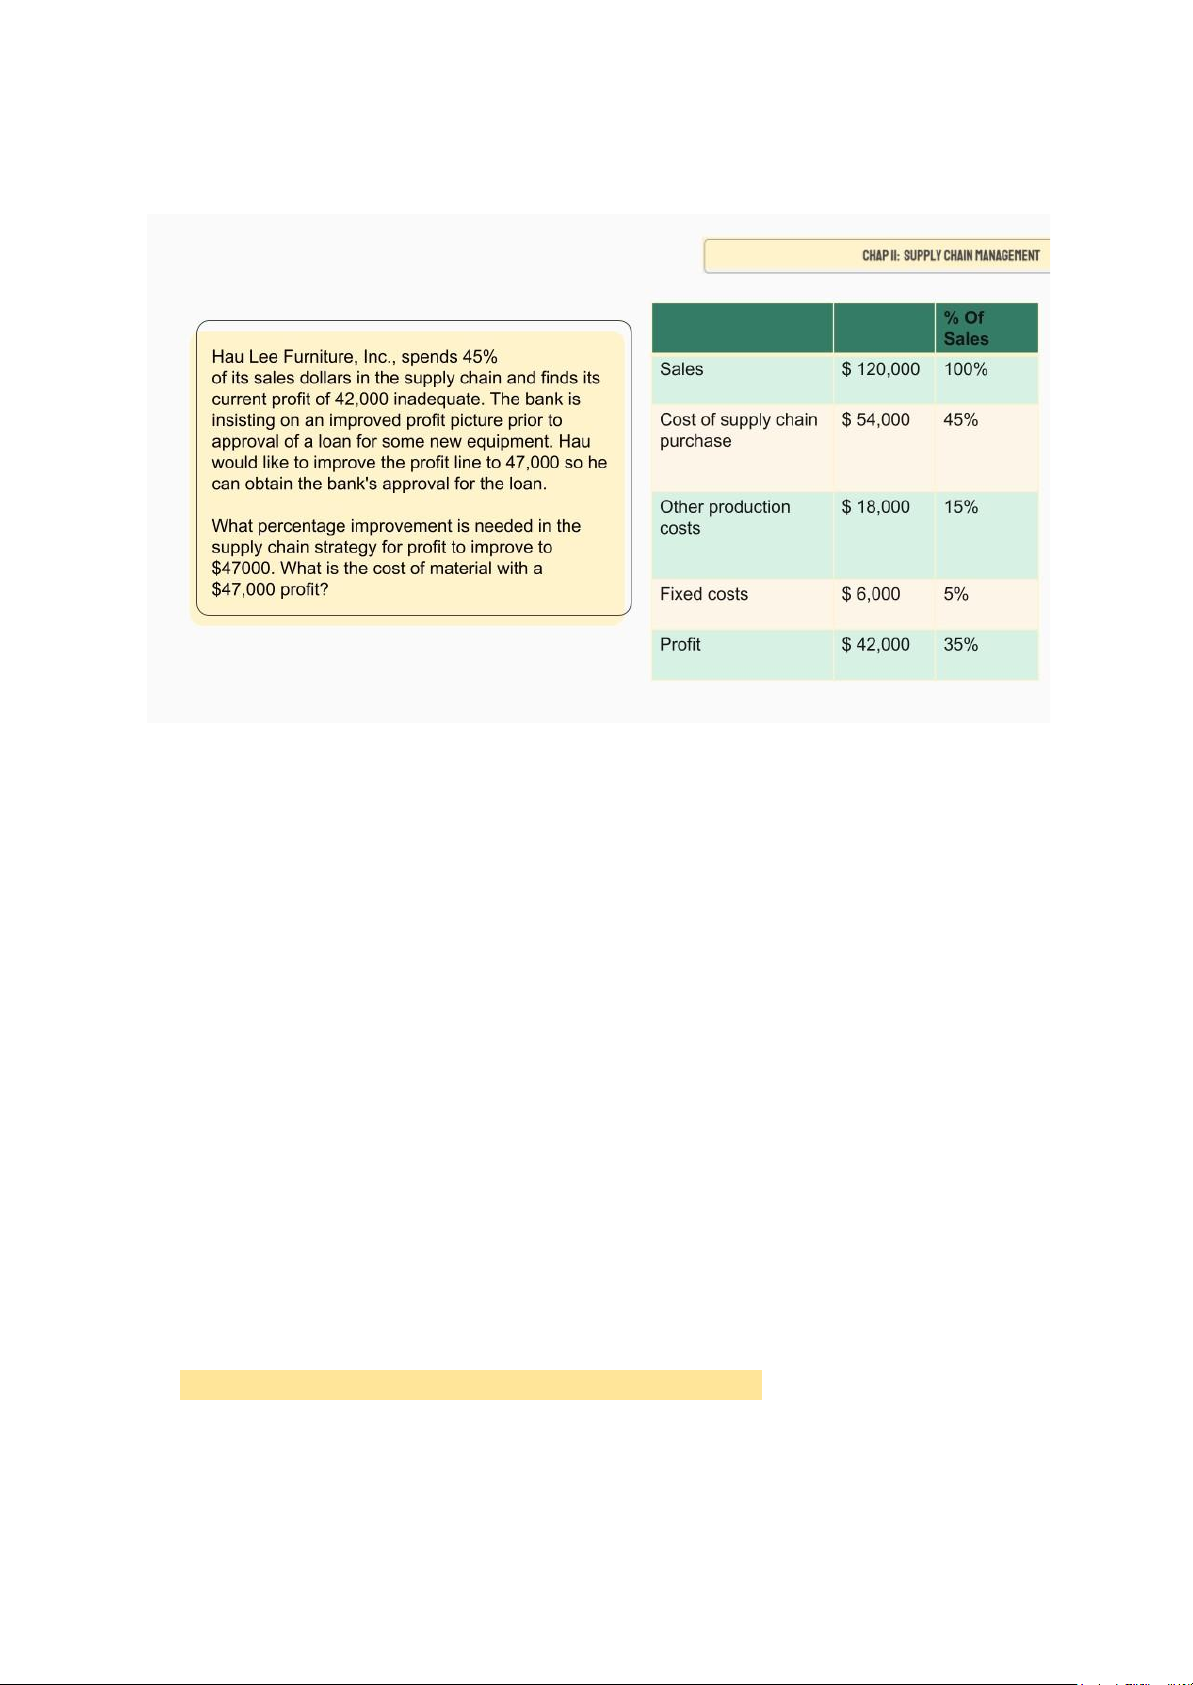
● Áp dụng supply chain strategy:
Profit = Sales – (COSC Purchase + Production Cost + Fixed Cost)
47,000 = 120,000 - ( X + 18,000 + 6,000) => X= 49,000$
% change = (COSCP mới - COSCP cũ / COSCP cũ )= - 9,3 % If
we use SC strategy, Cost of SCP will be decreased 9,3%. ● Sale strategy: - Let X denote for Sales
Profit = Sales – (COSC Purchase + Production Cost + Fixed Cost)
47,000 = X - ( 45%X + 15%X + 6,000) => X = 132,500$ CHAP 12: INVENTORY
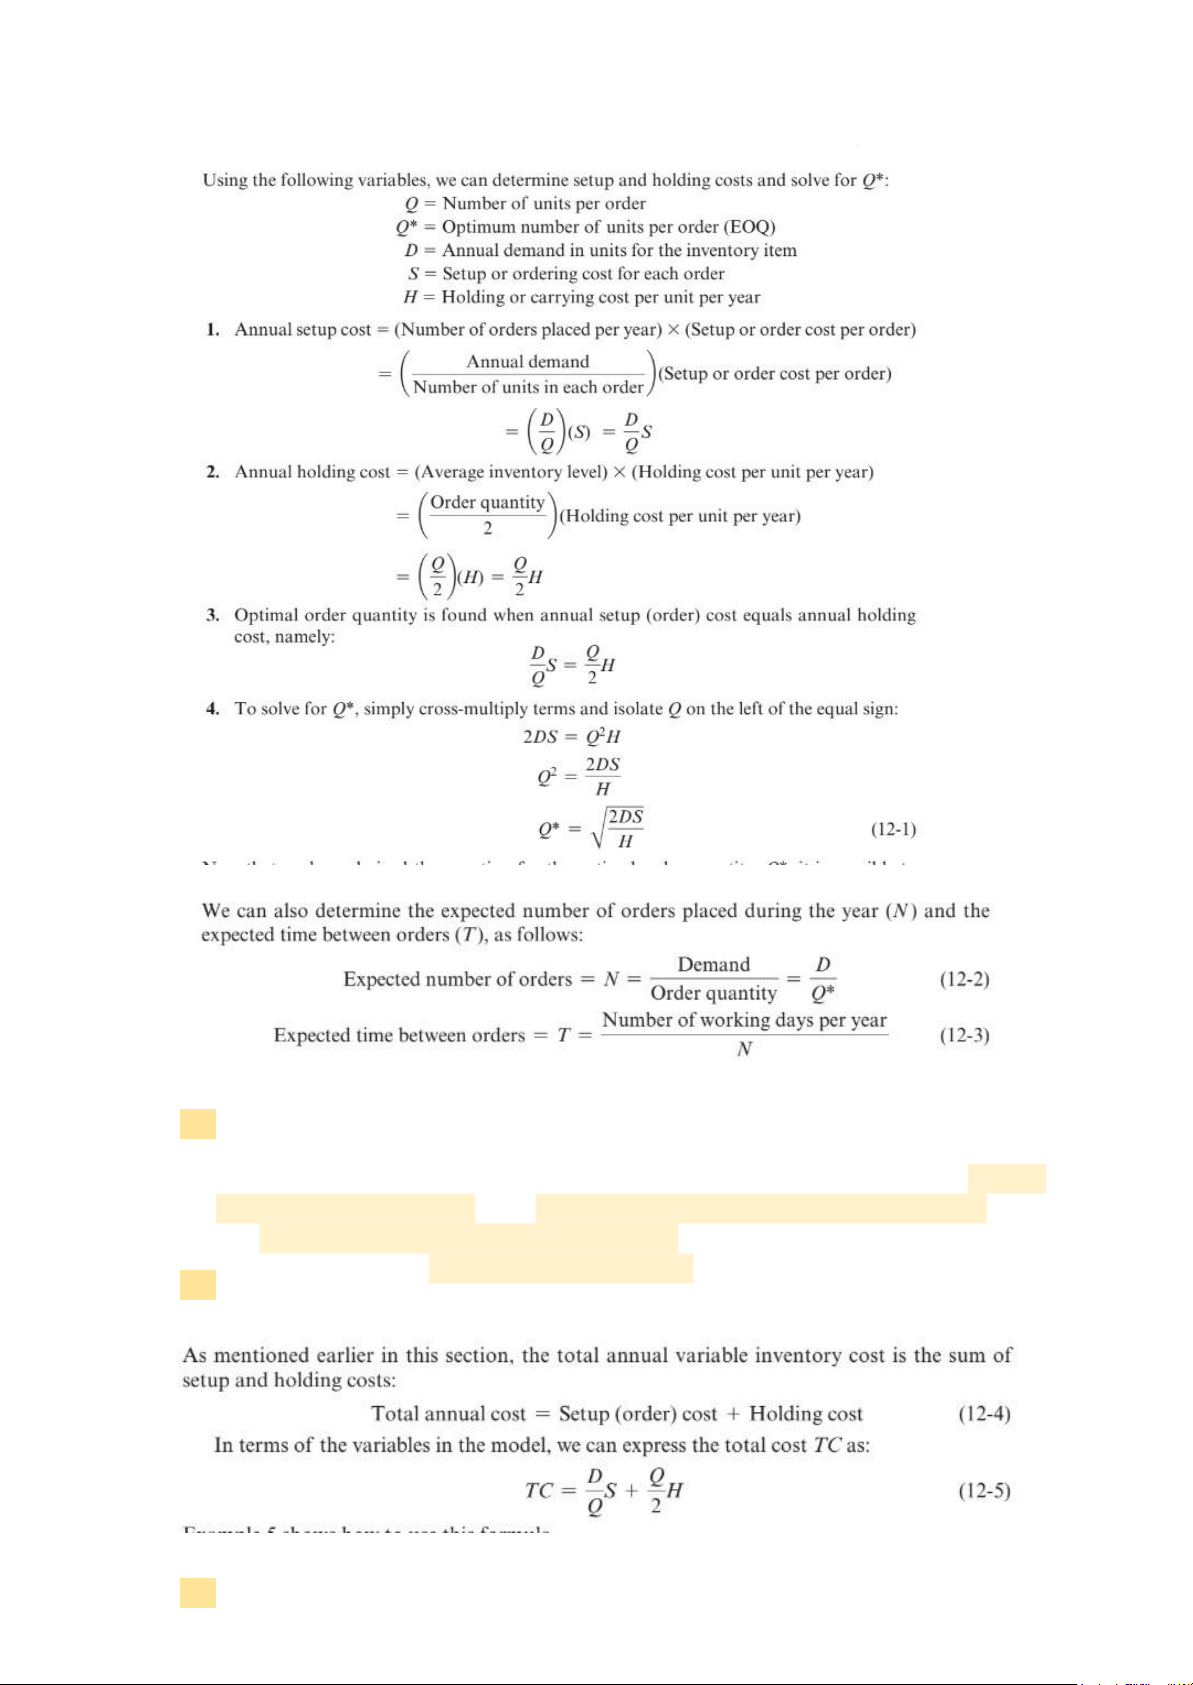
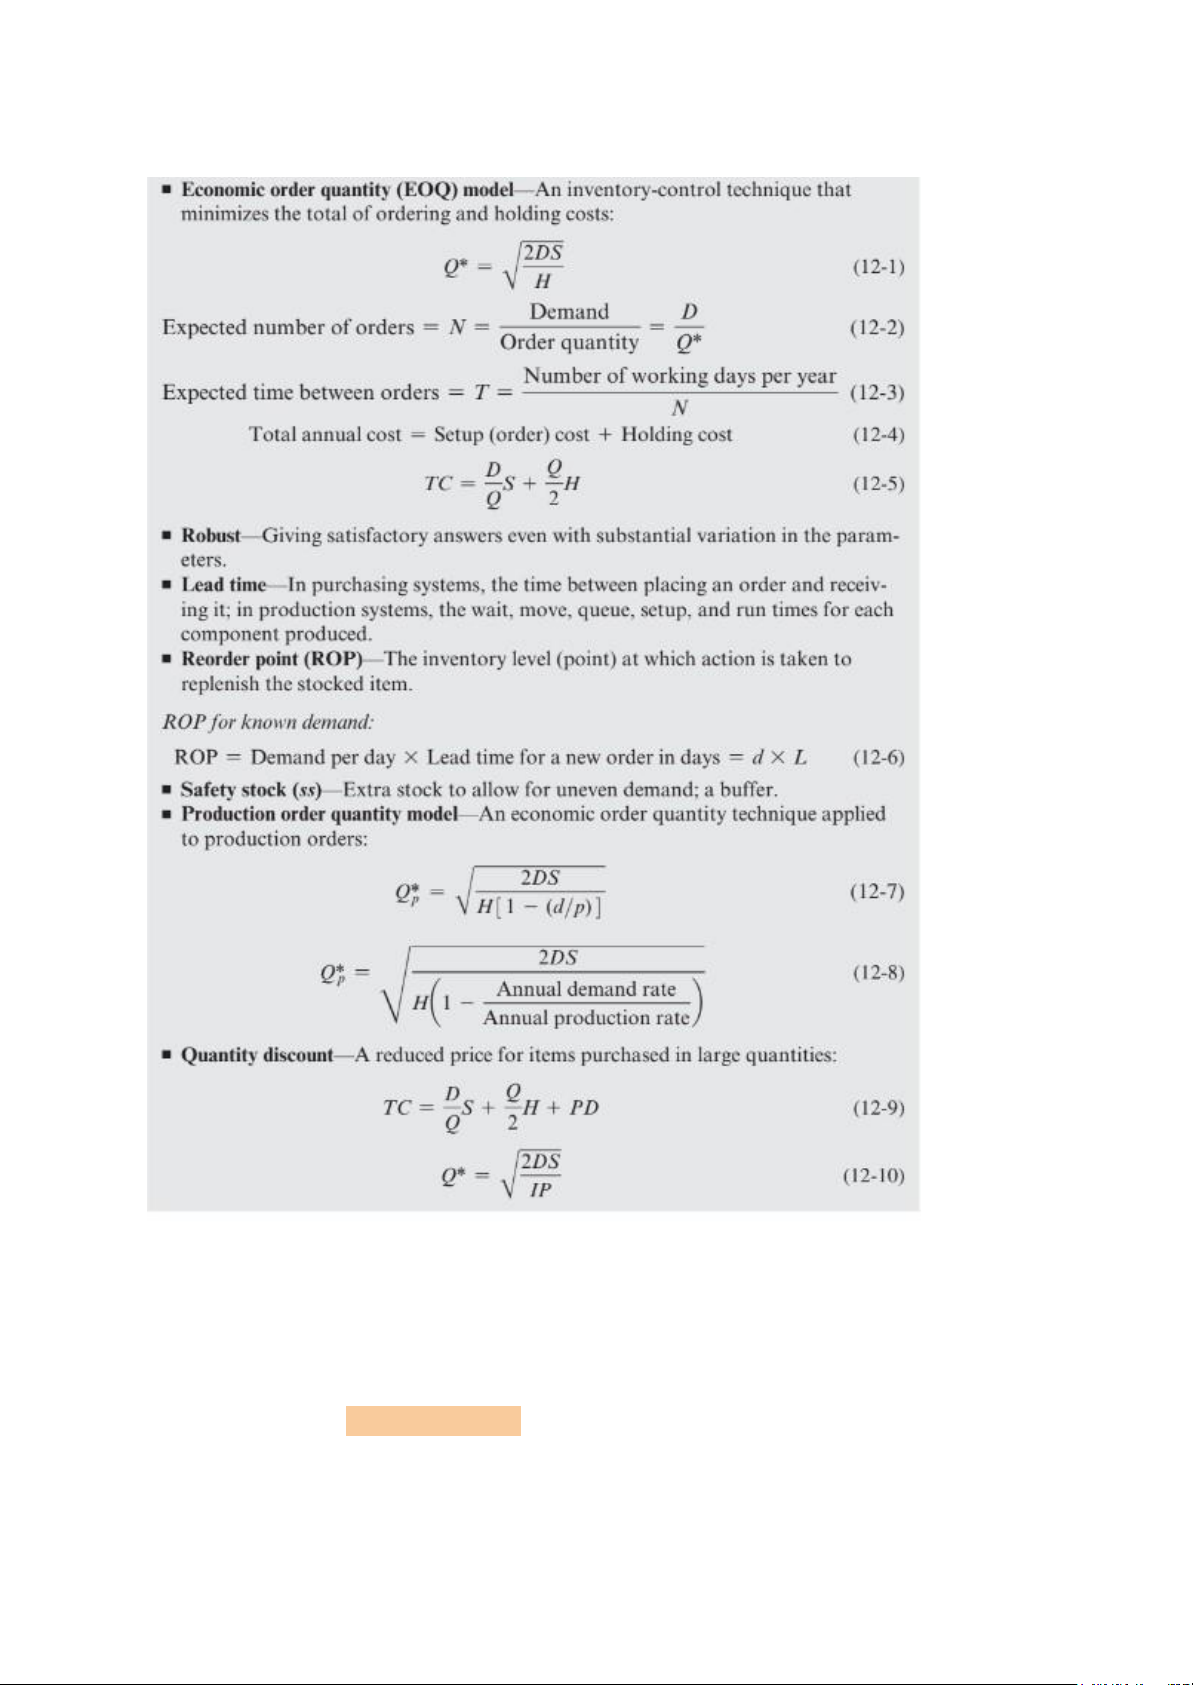
- Basic economic order quantity model (EOQ) lOMoAR cPSD| 58097008 Example:
- Sharp, Inc., a company that markets painless hypodermic needles to
hospitals, would like to reduce its inventory cost by determining the
optimal number of hypodermic needles to obtain per order. The annual
demand is 1,000 units; the setup or ordering cost is $10 per order; and
the holding cost per unit per year is $.50.
- Sharp, Inc., has a 250-day working year and wants to find the number of
orders (N) and the expected time between orders (T).
Sharp, Inc. wants to determine the combined annual ordering and holding costs. - TC = lOMoAR cPSD| 58097008 Reorder point
ROP = Demand per day * Lead time for a new order in days = d * L
ROP = Expected demand during lead time + Safety stock
The demand per day, d, is found by dividing the annual demand, D, by
the number of working days in a year: d = D/ Number of working days in a year
Lead Time: the time between placement and receipt of an order Example:
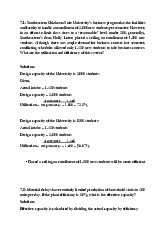
An Apple store has a demand (D) for 8,000 iPods per year. The firm operates a
250-day working year. On average, delivery of an order takes 3 working days,
but has been known to take as long as 4 days. The store wants to calculate the
reorder point without a safety stock
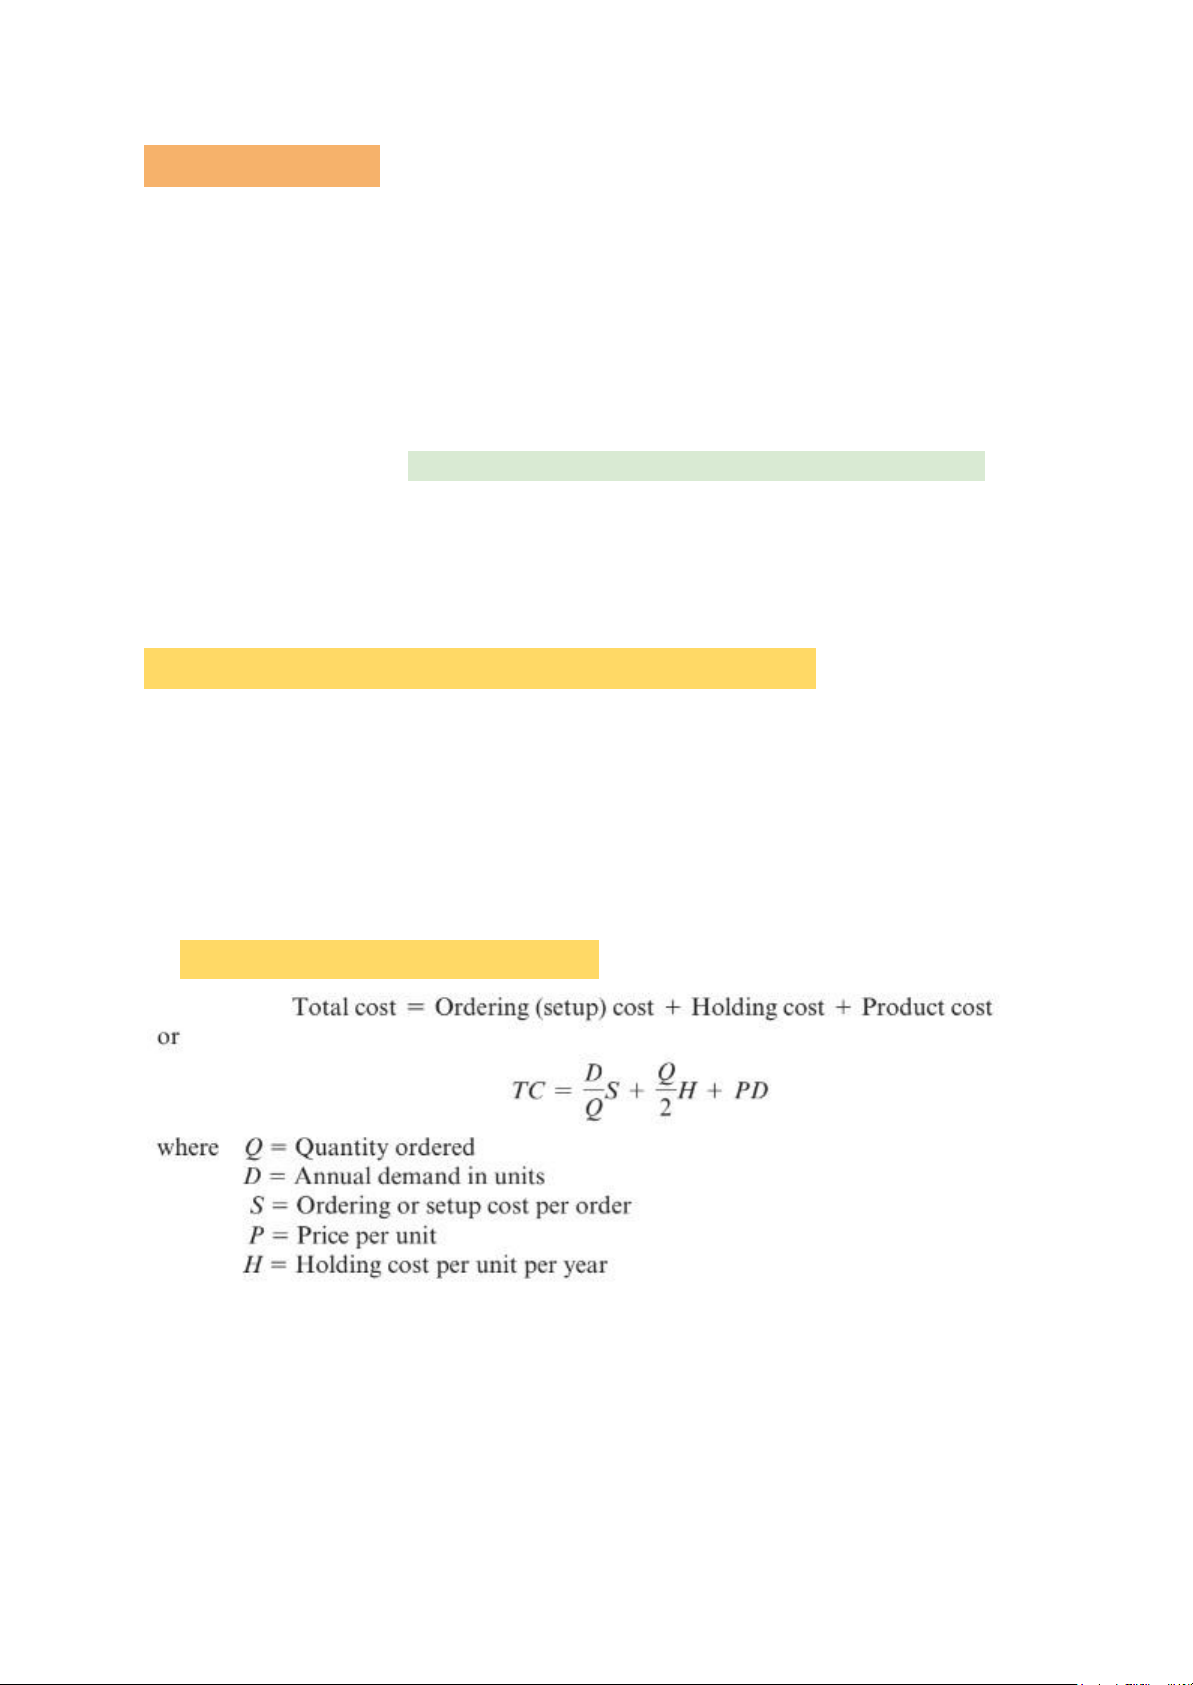
Production order quantity model (POQ) Example:
Nathan Manufacturing, Inc., makes and sells specialty hubcaps for the retail
automobile aftermarket. Nathan’s forecast for its wire-wheel hubcap is 1,000
units next year, with an average daily demand of 4 units. However, the
production process is most efficient at 8 units per day. So the company
produces 8 per day but uses only 4 per day. The company wants to solve for
the optimum number of units per order.
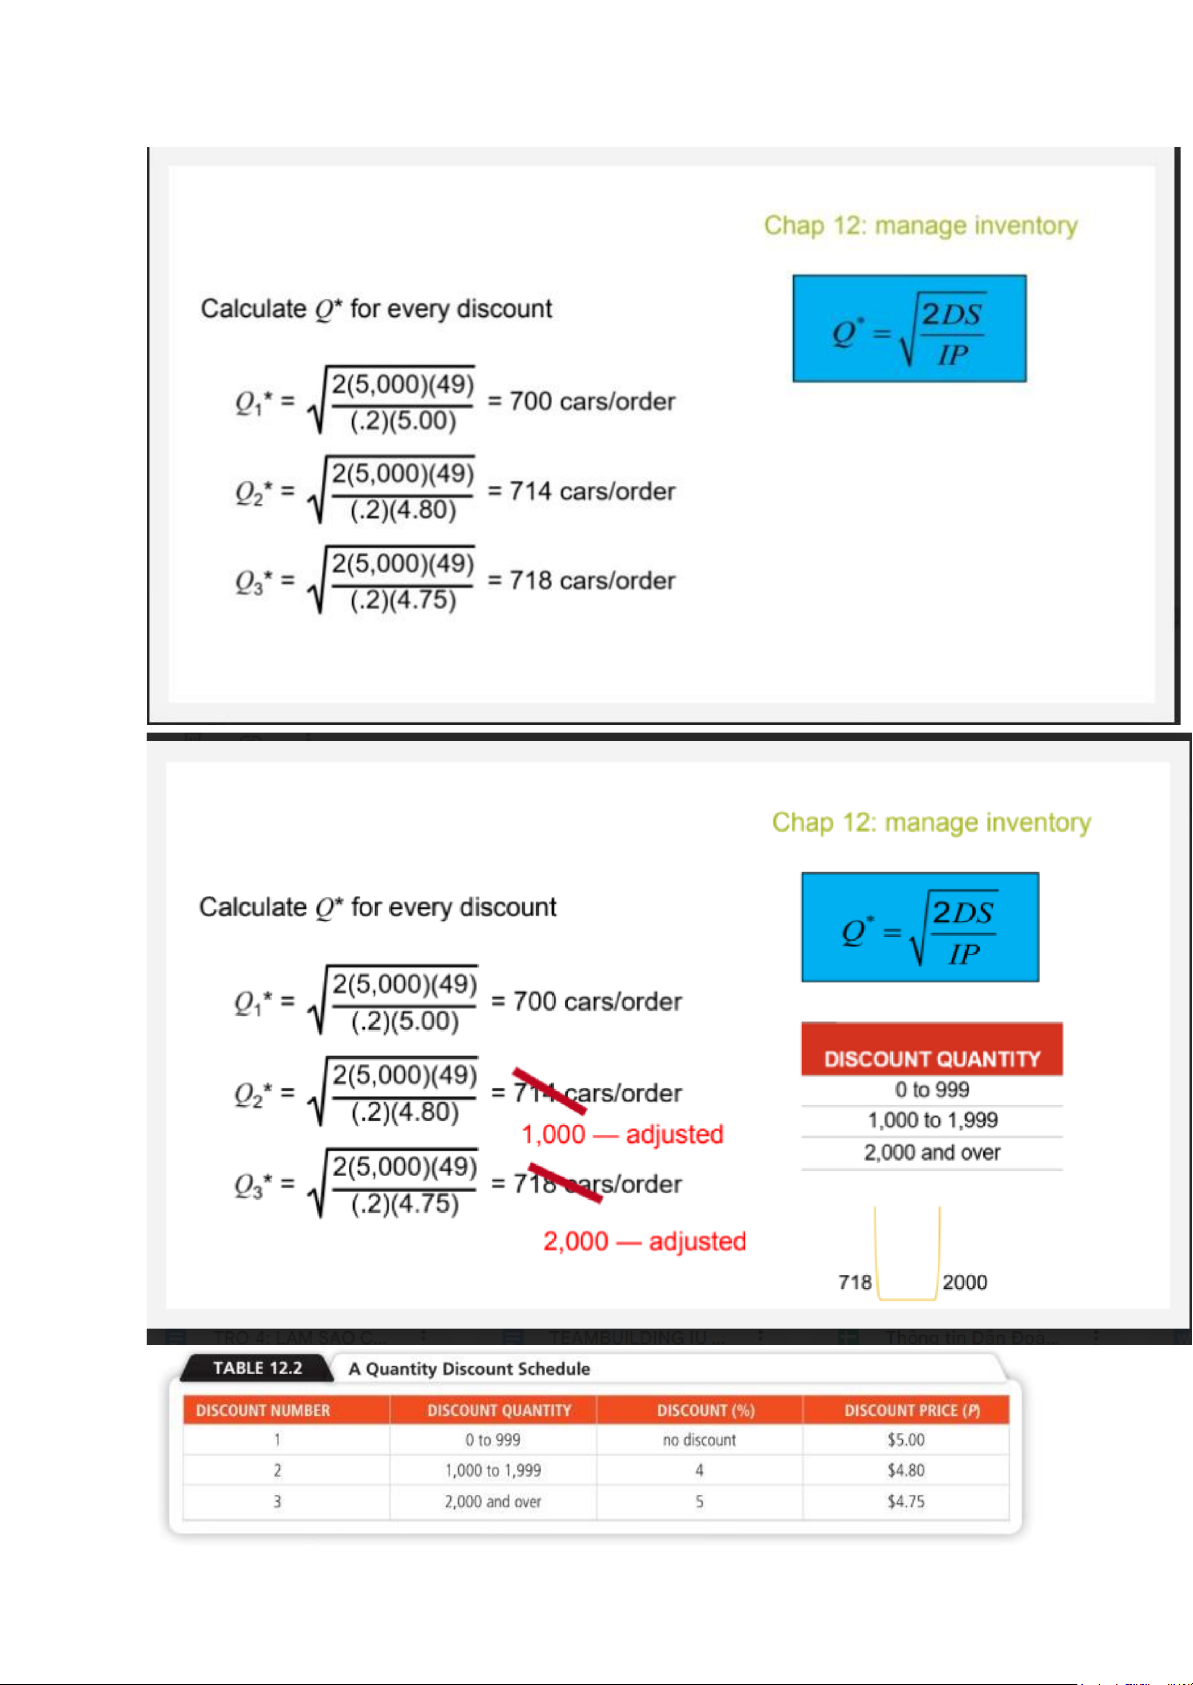
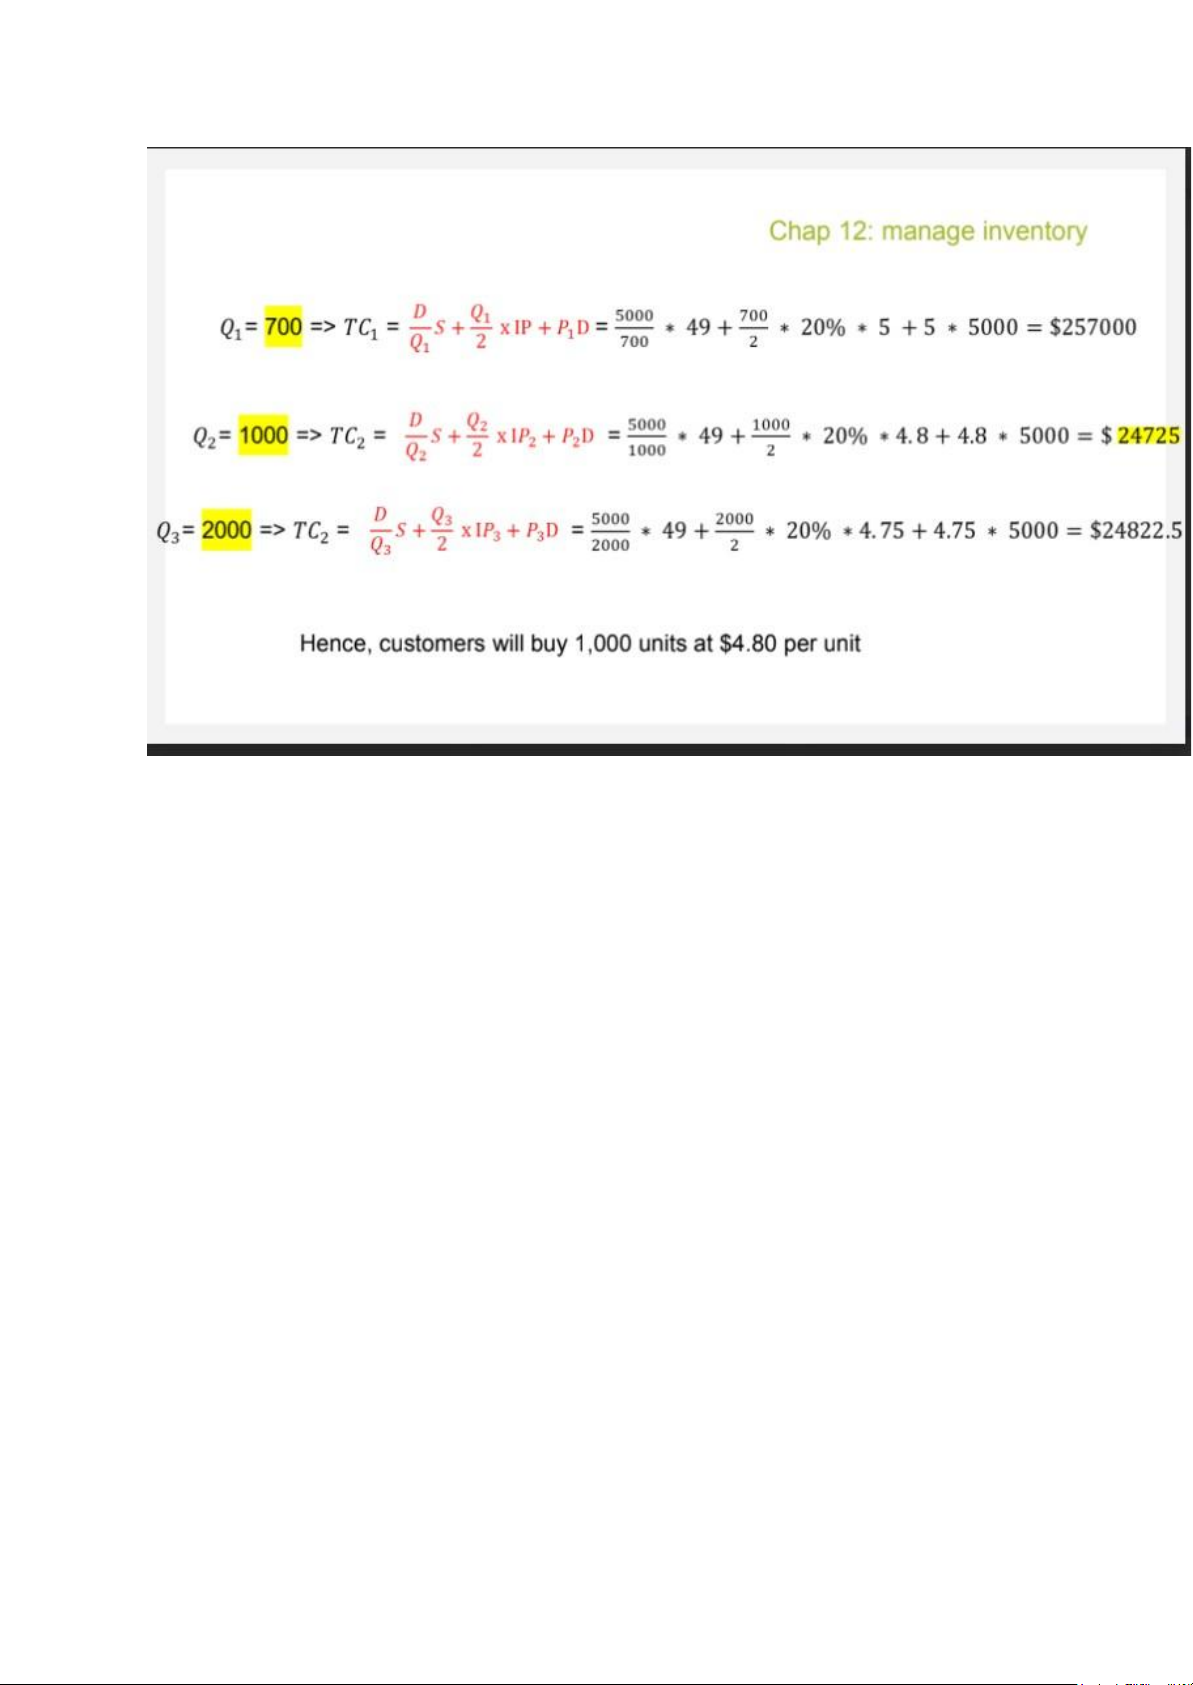
- Quantity discount model Example:
Wohl’s Discount Store stocks toy race cars. Recently, the store has been given
a quantity discount schedule for these cars. This quantity schedule was shown
in Table 12.2. Thus, the normal cost for the toy race cars is $5.00. For orders
between 1,000 and 1,999 units, the unit cost drops to $4.80; for orders of 2,000
or more units, the unit cost is only $4.75. Furthermore, ordering cost is $49.00
per order, annual demand is 5,000 race cars, and inventory carrying charge, as
a percent of cost, I, is 20%, or .2. What order quantity will minimize the total inventory cost? lOMoAR cPSD| 58097008 lOMoAR cPSD| 58097008 lOMoAR cPSD| 58097008 ● Summary:
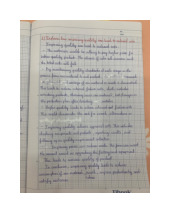
Example: Loving Money Inc. is a company doing business about frozen fish.
They are now running inventory. Each year, the average demand is 8,000 units
of fish (each unit is like a 20-ft-container). Ordering cost is $800; holding cost is $100 per unit per year.
a. Calculate: minimum units to minimize the total cost
b. Due to bad condition, holding cost is now $120 (not $100), and demand
is now at 6,000 units; calculate the optimal quantity per each order. a) EOQ or Q* = 358 units.
b) New holding cost = 120 ; new demand = 6000 units. EOQ new = 283 units. lOMoAR cPSD| 58097008 CHAP 14: MRP MRP:
+ Lot for lot: thiếu/ cần bao nhiêu order bấy nhiêu
+ Lot size ordering / EOQ lot size: order theo khuôn. Nếu đề cho EOQ đầu
tiên phải tính Q* theo công thức của chap 12. Đề cho average usage thì
phải tính ra annual demand. Ví dụ: đề cho “ Average weekly gross
requirements = 27” thì Annual demand = D = 27*52 ( 1 years have 52 weeks ) Example:
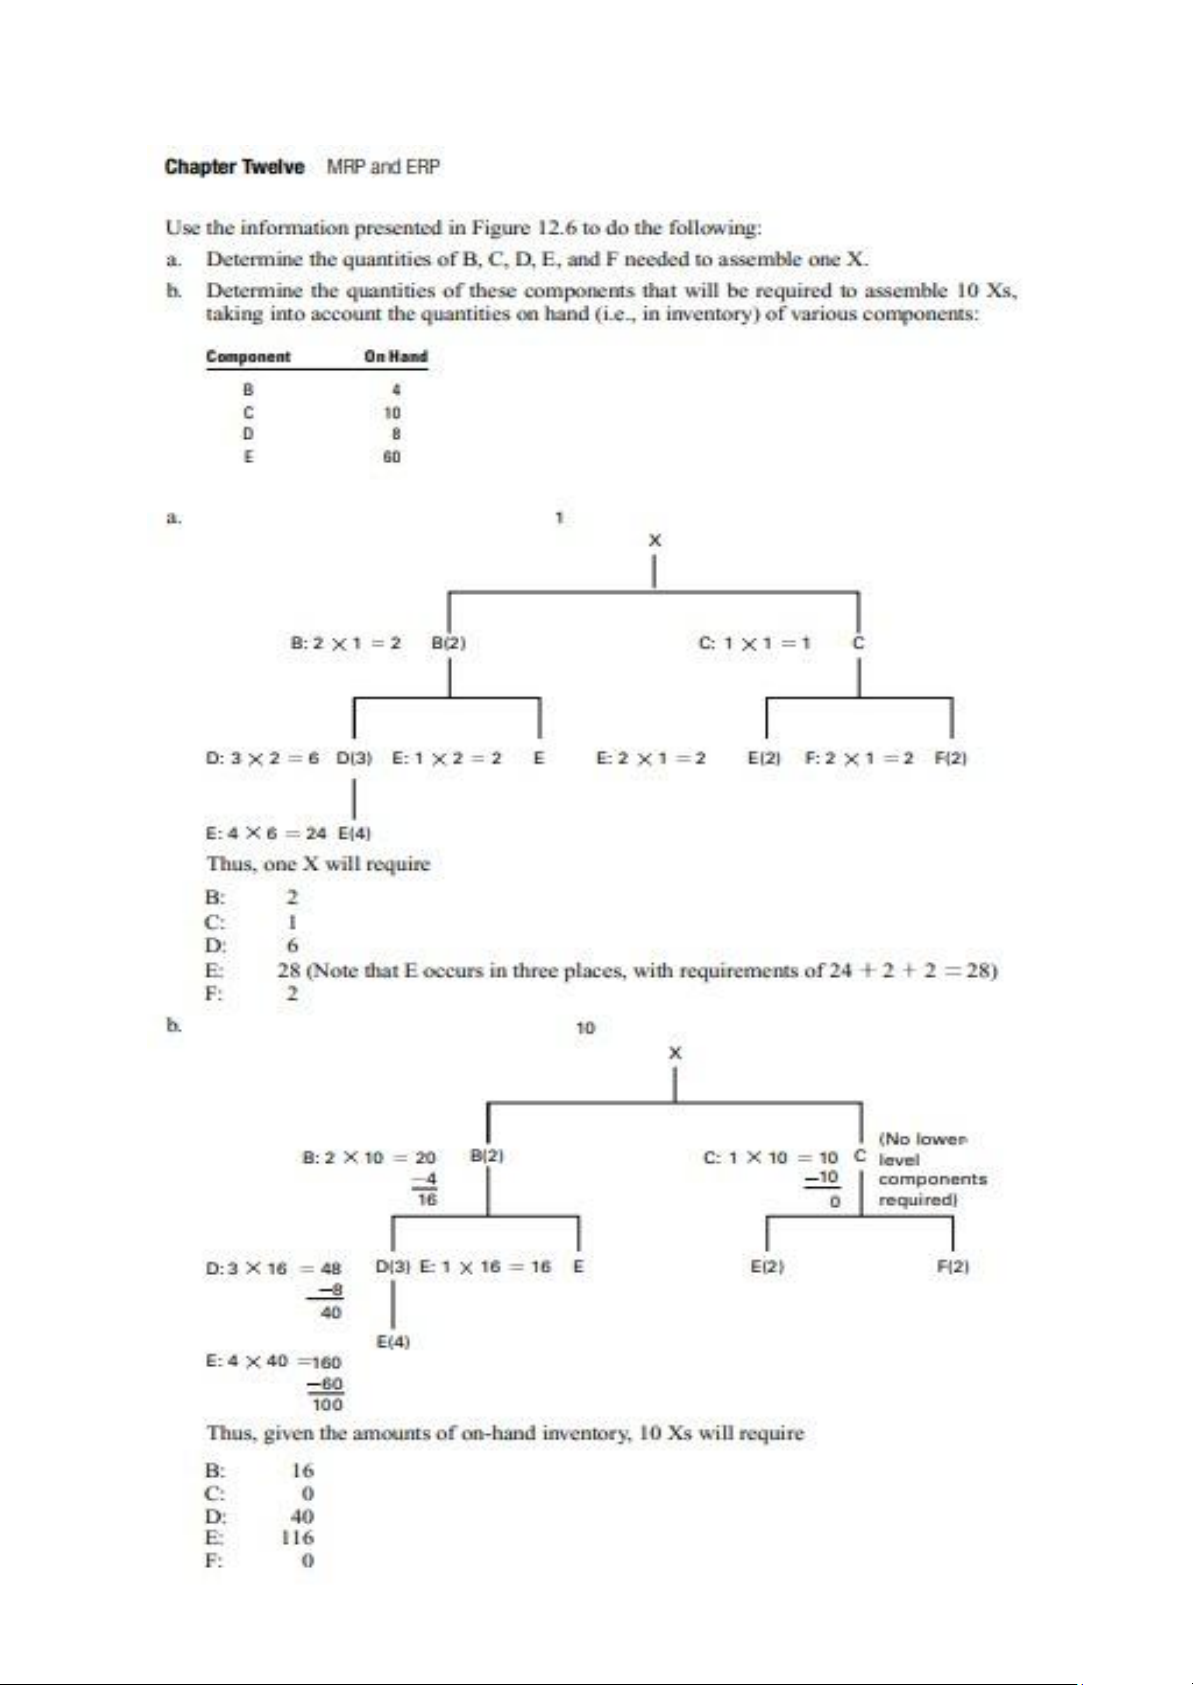
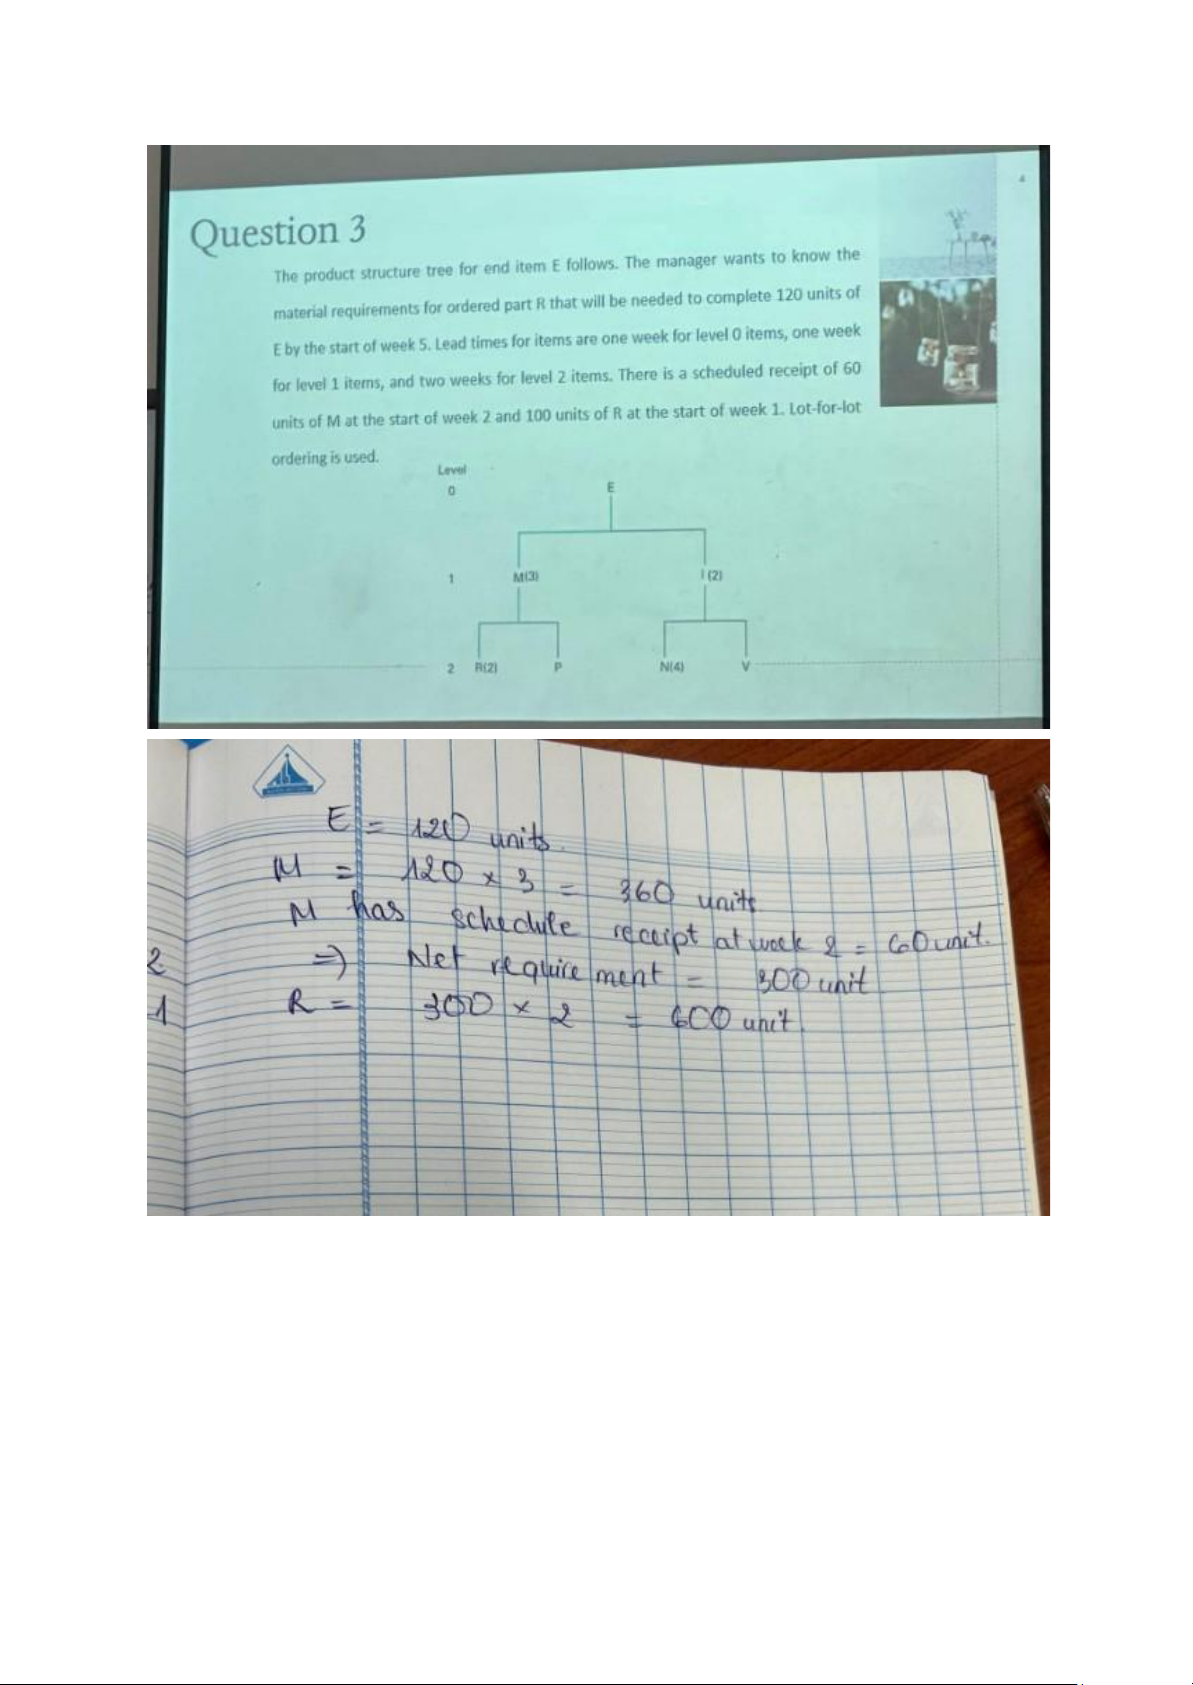
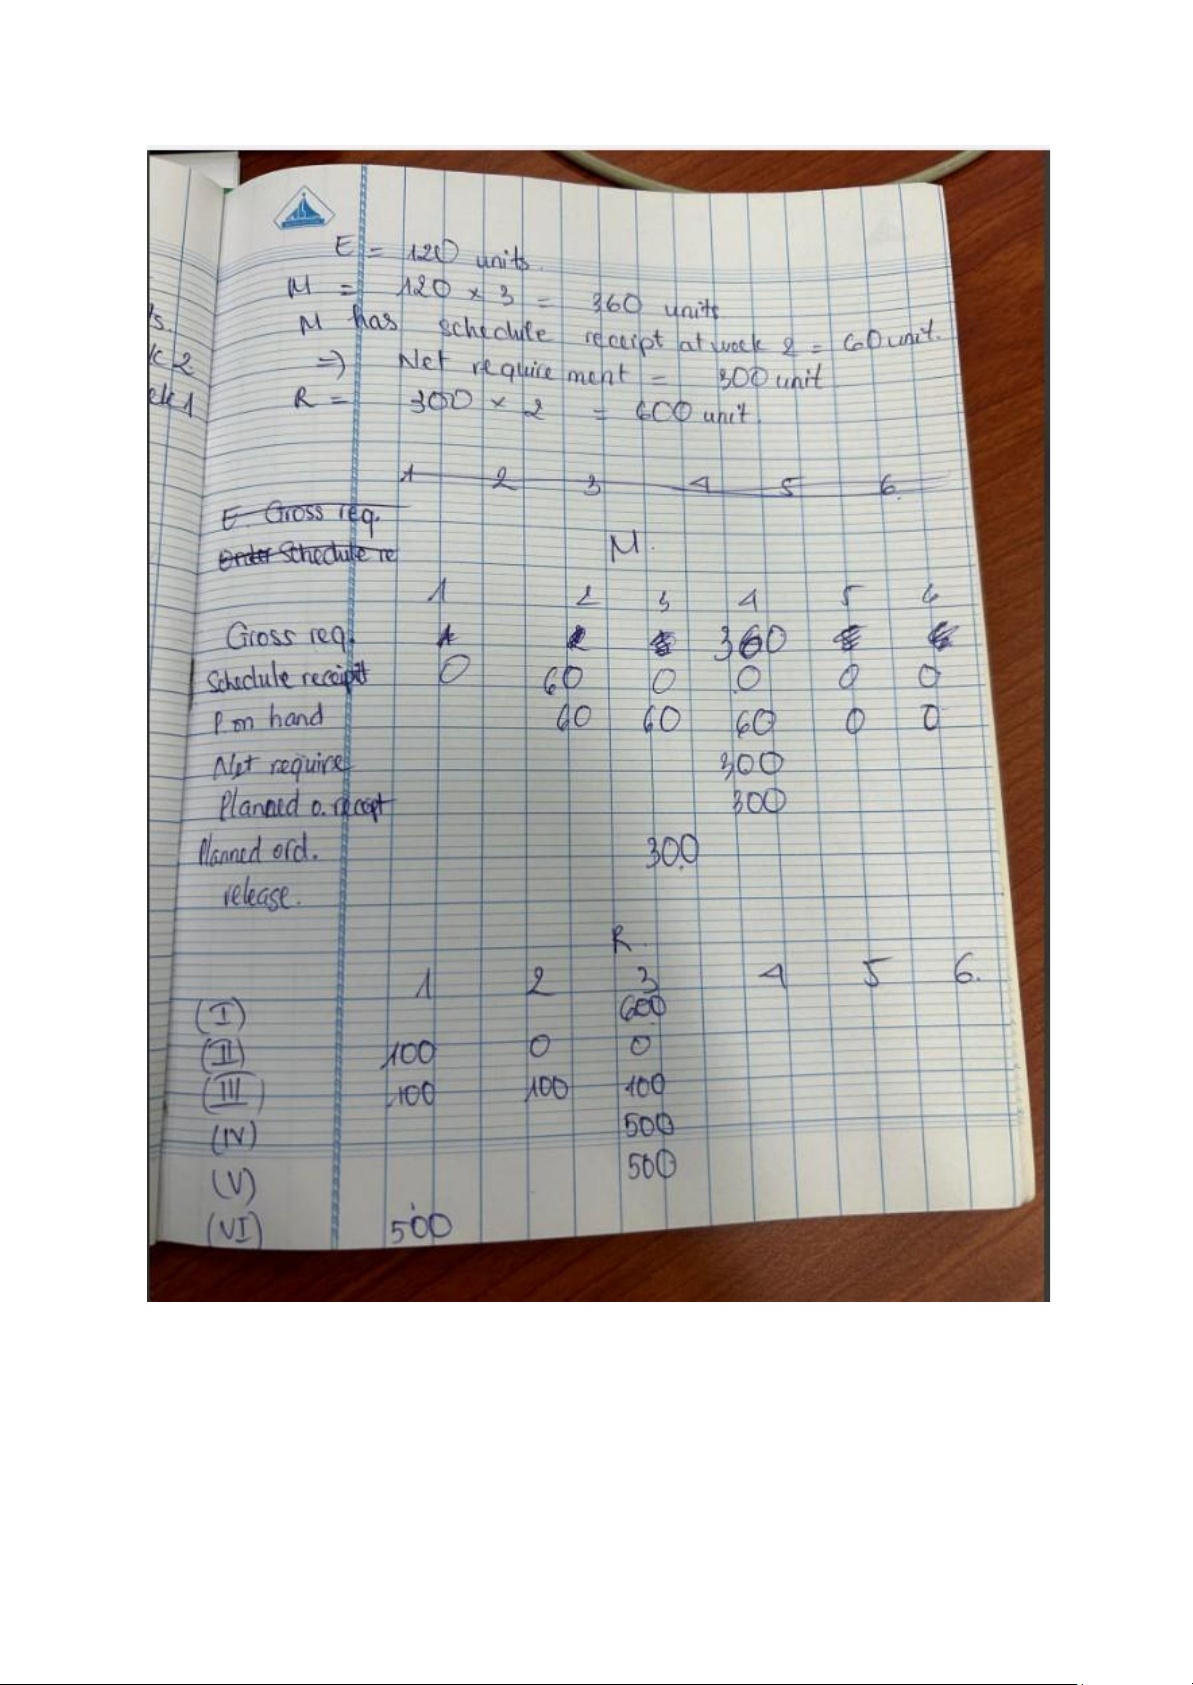
Consider the bill of material for Product J and the data given in the following
table. The gross requirements for J are 200 units in week 6 and 250 units in
week 8 with setup cost is $400 per order and holding cost $1.
Develop the MRP tables for each item for a 9-week planning period.
Average usage= (200+450)/9 = 50
Annual demand = D = 50*52 = 2600 Annual holding cost = 1*52 = Q* = Item
Lead Time Quantity on Scheduled Lot size rule Hand receipts J 1 50 EOQ K 2 20 30 in week 5 Lot-for-lot L 2 300 100 in week 3 Lot-for-lot M 1 50 200 in week 5 Lot-for-lot lOMoAR cPSD| 58097008 lOMoAR cPSD| 58097008 CHAP 15: SCHEDULING Minimizing Johnson’s Rule
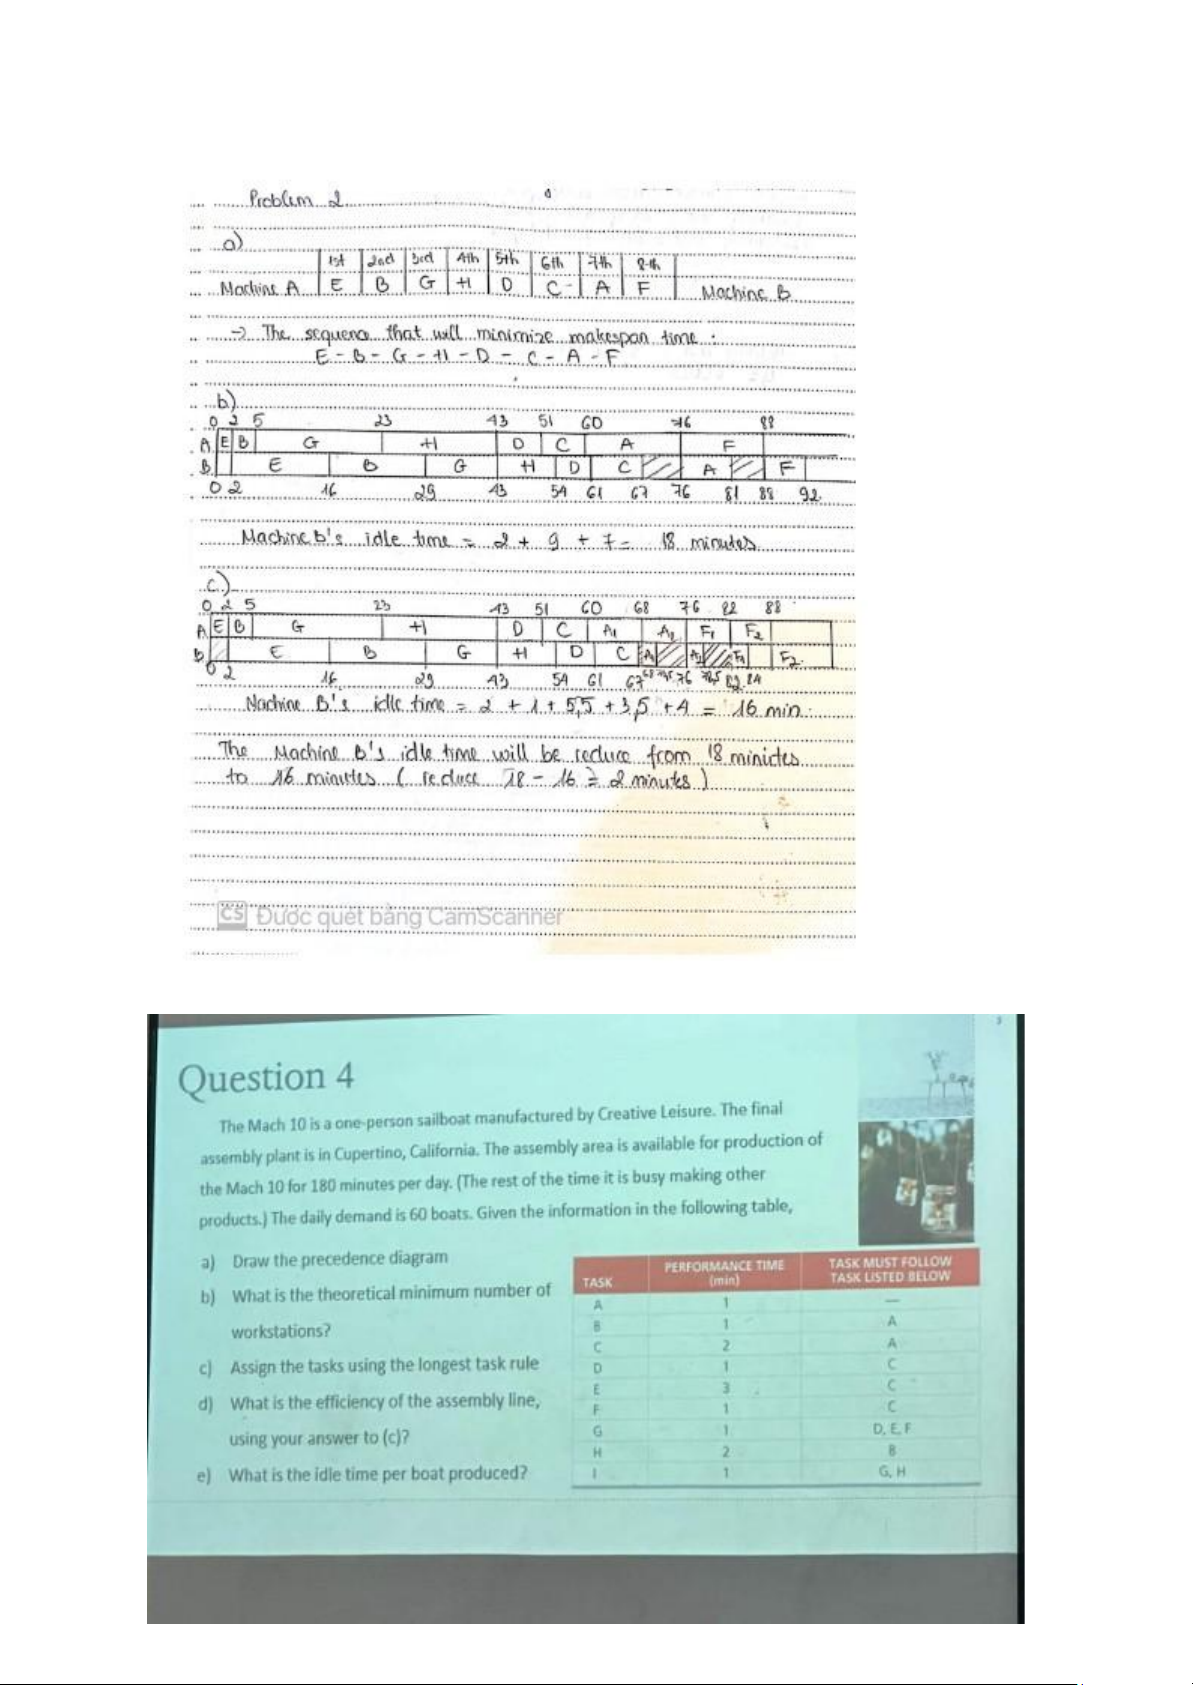
The times required to complete each of eight jobs in a two-machine flow shop
are shown in the table that follows. Each job must follow the same sequence,
beginning with machine A and moving to machine B (A to B).
- Determine a sequence that will minimize makespan time.
- Construct a chart of the resulting sequence, and find the machine B’s idle time.
- For the same sequence determined in part a, how much would machine
B’s idle time be reduced by splitting the last two jobs in half?
Hint: splitting means divide the time to 2; e.g., splitting activity e means in
Machine A: e1 =; e2=1 and in Machine B: e1=7; e2=7) Job Machine A Machine B (minutes) (minutes) a 16 5 b 3 13 c 9 6 d 8 7 e 2 14 f 12 4 g 18 14 h 20 11 lOMoAR cPSD| 58097008 lOMoAR cPSD| 58097008 lOMoAR cPSD| 58097008 lOMoAR cPSD| 58097008 lOMoAR cPSD| 58097008
Tài liệu liên quan:
-
Assignment: Total Revenue and Cost Analysis Notes | Môn Production and Operations Management - Trường Đại học Quốc tế, Đại học Quốc gia Thành phố Hồ Chí Minh
95 48 -
Revision for final | Môn Production and Operations Management - Trường Đại học Quốc tế, Đại học Quốc gia Thành phố Hồ Chí Minh
85 43 -
Chương 1 & 2 - Quản lý Hoạt động và Chiến lược doanh nghiệp | Môn Production and Operations Management - Trường Đại học Quốc tế, Đại học Quốc gia Thành phố Hồ Chí Minh
82 41 -
Homework chap 7 | Môn Production and Operations Management - Trường Đại học Quốc tế, Đại học Quốc gia Thành phố Hồ Chí Minh
102 51 -
Homework chap 4 | Môn Production and Operations Management - Trường Đại học Quốc tế, Đại học Quốc gia Thành phố Hồ Chí Minh
81 41