Thống Kê Kinh Tế và Tác Động Đến Lựa Chọn Tài Trợ | Thống kê cho khoa học xã hội | Trường Đại học Khoa học Tự nhiên, Đại học Quốc gia Hà Nội
The role of information asymmetry in corporate financing has become one of the basic tenets of capital structure theory. The most enduring version is the popularly known pecking order (PO) hypothesis posited by Myers and Majluf (1984). The model predicts that information asymmetry between managers and investors leads to adverse selection costs, creating a hierarchy of financing preference based on the information sensitivity of the security. Tài liệu được sưu tầm và soạn thảo dưới dạng file PDF để gửi tới các bạn cùng tham khảo, ôn tập đầy đủ kiến thức, chuẩn bị cho các buổi học thật tốt. Mời bạn đọc đón xem!
Môn: Thống kê cho khoa học xã hội (tk) 10 tài liệu
Trường: Trường Đại học Khoa học tự nhiên, Đại học Quốc gia Hà Nội 1.1 K tài liệu
Tác giả:


Preview text:
Journal of Business Finance & Accounting
Journal of Business Finance & Accounting, 42(7) & (8), 947–964, September/October 2015, 0306-686X doi: 10.1111/jbfa.12128
Information Asymmetry about Investment Risk and Financing Choice
MUFADDAL BAXAMUSA, SUNIL MOHANTY AND RAMESH P. RAO∗ Abstract:
Though it is generally accepted that information asymmetry has an impact on
capital structure policy, the nature of the information asymmetry is not well understood. Recent
theoretical work and empirical evidence suggests that financing choice depends upon the
information asymmetry associated with the investment risk of the particular use of proceeds.
Consistent with this view, using the sources and uses of funds framework, we find that equity
is used to fund projects with greater information asymmetry about their risk such as research
and development expenditure, while debt is used to fund investments with lower information
asymmetry about their risk such as liquidity enhancement.
Keywords: firm investment, capital structure, information asymmetry 1. INTRODUCTION
The role of information asymmetry in corporate financing has become one of the
basic tenets of capital structure theory. The most enduring version is the popularly
known pecking order (PO) hypothesis posited by Myers and Majluf (1984). The model
predicts that information asymmetry between managers and investors leads to adverse
selection costs, creating a hierarchy of financing preference based on the information
sensitivity of the security. In this scheme, retained earnings are the least information
sensitive, followed by debt, and then external equity. Thus, firms are inclined to fund
their financing deficit first by retained earnings, then by debt issuance, and only as a
last resort by external equity issuance. The intensity of research in this area is only
matched by the lack of empirical consensus for the PO theory.1 For example, the
∗The first author is at Department of Finance, Opus College of Business, University of Saint Thomas, St
Paul, MN. The second author is at Department of Finance, Brooklyn College, City University of New York,
Brooklyn, NY. The third author is at Department of Finance, Spears School of Business, Oklahoma State
University, Stillwater, OK. We would like to thank Rajesh Aggarwal, Alice Bonaime, Richard S. Warr, Abu
Jalal, Sheridan Titman, Puneet Jaiprakash, Hafez Hussain and Jack Wolf for their comments. We also thank
seminar participants at the 2010 Financial Management Association, 2011 Eastern Finance Association, 2012
Financial Management Association-Europe, and 2012 Asian Finance Association meetings for providing
useful comments on earlier drafts. We would like to thank Subbu Iyer for his research assistance. (Paper
received December 2014, revised version accepted July 2015).
Address for correspondence: Ramesh P. Rao, Department of Finance, Oklahoma State University, Stillwater, OK, USA. e-mail: ramesh.rao@okstate.edu
1 Shyam-Sunder and Myers (1999) find some support for the PO theory while Frank and Goyal (2003),
Fama and French (2002, 2005), Wu and Wang (2005) and Leary and Roberts (2010) find significant evidence against it.
C 2015 John Wiley & Sons Ltd 947 948 BAXAMUSA, MOHANTY AND RAO
PO theory cannot explain why young, small and non-dividend paying firms that face
large asymmetric information problems, issue equity securities (e.g., Ambarish et al.,
1987; Fama and French, 2002; and Wu and Wang, 2005). Survey findings of Graham
and Harvey (2001) also suggest that small and non-dividend paying firms’ financing
decisions are not consistent with PO theory.
Though evidence in favor of PO is mixed, Leary and Roberts (2010) suggest
that measures of information asymmetry may be systematically related to financing
behavior, albeit not necessarily in sync with the predictions of the PO model.
Specifically, some of the observed patterns with respect to small firms, age, and asset
tangibility suggest that information asymmetry relating to future investments may play an
important role. Recent theoretical work by Fulghieri and Lukin (2001), Wu and Wang
(2005), Halov et al. (2011) and Halov and Heider (2012) provides support for such
a view. These models predict a preference for equity over debt when there is greater
information asymmetry between the firm and outsiders about future investment risk
(i.e., project risk to which the funds are directed). Wu and Wang (2005) also show that
announcement returns associated with issuance of equity are more likely to be positive
when the asymmetric information about firm value arises mainly from growth (future
investment) rather than assets-in-place.
In this paper, we provide empirical evidence to support the notion that the
information asymmetry of the underlying project risk (e.g., relative success of a new
product such as a new drug or the growth potential from a plant expansion) is
what drives financing choice. For testing purposes, we classify investments into a
hierarchy based on their underlying risk information asymmetry: liquidity investments
(lowest risk), capital expenditures (moderate risk) and R&D investments (highest
risk). We argue that liquidity-enhancing investments (e.g., building up cash or working
capital) are associated with fairly low information asymmetry about their risk while,
at the other extreme, investments in R&D are expected to be associated with the
greatest information asymmetry about their project risk. On the other hand, as capital
expenditures tend to be focused on investments in fixed assets, they are assumed to
hold an intermediate position between liquidity-enhancing investments and intangible
investments (i.e., R&D expenditures). Thus, we expect debt financing to be associated
with subsequent low risk information asymmetry liquidity-enhancing investments while
equity financing should be more closely related with high underlying risk information
asymmetry investments such as R&D.
For our empirical methodology we employ the sources and uses of funds framework
used in several studies (e.g., Gatchev et al., 2010; Chang et al., 2014) based on the
accounting identity that the total funds used by the firm should equal internal cash
flows in addition to debt and equity raised by the firm. The primary uses of funds
we consider are research and development expenditure (R&D), capital expenditure,
working capital changes, changes in cash holdings and cash dividends.2 We find that
per dollar of equity issued 22 cents is used for R&D, while only 1 cent per dollar of debt
goes toward R&D financing. With respect to capital expenditures, 11 cents of every
dollar of debt financing is devoted to this expenditure in contrast to only 5 cents in the
case of equity financing. A similar pattern is evident for working capital expenditures
where 9 cents of every dollar of debt financing ends up but only 3 cents in the case of
2 Though our focus is on investment related uses of funds, we include dividends to meet the cash flow identity requirement.
C 2015 John Wiley & Sons Ltd
INVESTMENT RISK ASYMMETRY AND FINANCING CHOICE 949
equity. In the case of cash, we find that 77 cents of every dollar of debt goes towards
building up cash while the equivalent for equity is 68 cents. Thus, we can conclude that
investments with high information asymmetry about their risk (e.g., R&D) are funded
primarily by equity and not debt, while investments with low information asymmetry
about their risk exhibit an affinity for debt financing.
Our investigation builds on the prior works of Kim and Weisbach (2008), Gatchev
et al. (2009), DeAngelo et al. (2010) and Halov and Heider (2012). Kim and Weisbach
(2008) and DeAngelo et al. (2010) link equity issuance proceeds to how they are
subsequently utilized. However, their choice of methodology and the focus on equity
issuances exclusively makes it difficult to draw any causal inferences between sources
of financing and the particular use of funds. Specifically, it is difficult to infer that
an equity issuance in the current period is used for a particular investment in the
following period, if other sources of financing are not controlled for in the current
and subsequent period. That is, it is possible that next period’s capital expenditure may
be more closely associated with next period’s debt financing and not necessarily with
this period’s equity issuance. Additionally, these studies are not focused specifically
on linking sources of financing to investments differentiated on the basis of their
risk information asymmetry. Rather, the studies are more broadly focused on how
equity issuances are deployed. Further, in the case of DeAngelo et al. (2010) they don’t
consider R&D as a possible use of funds.
Similar to our study, Gatchev et al. (2009) use the accounting identity framework
to relate financing decisions to changes in investments. Among other things, they
find R&D and advertising expenses (classified together) and net working capital
investments are primarily financed by equity while fixed asset investments, e.g., capital
expenditures, are largely financed by debt. Gatchev et al. (2009) do not separate
R&D from advertising expenses arguing that as both are intangible in nature their
information asymmetry will be high. Though intangible in nature, our view is that
advertising expenses are primarily about promoting current products and services
and protecting current market share (e.g., Coke), as such they should be closely
associated with the firm’s current and past investment in tangible assets. Consequently,
the information asymmetry surrounding advertising expenditures should be much
less than that associated with R&D. By combining both expenditures together, we are
unable to determine to what extent Gatchev et al.’s (2009) findings are driven by R&D and by advertising expenses.
Additionally, in our study we conduct robustness tests to ensure that the R&D results
are due to information asymmetry about investment risk rather than to the inherently
greater risk associated with R&D investments. Our study also adds to the evidence
in Halov and Heider (2012) for their theoretical model that information asymmetry
about project risk drives security preference. They use recent firm asset volatility as a
proxy for project risk asymmetry and find that greater asset volatility is associated with
preference for equity issuance. By linking the capital raised to where it is deployed,
we are able to provide additional evidence in support of Halov and Heider’s (2012)
theoretical argument and empirical evidence.
Overall, our contributions may be summarized as follows: (1) We provide empir-
ical support for recent theoretical work that links financing choice to information
asymmetry about the risk of future investments. Consistent with Wu and Wang (2005),
Gatchev et al. (2009) and Halov and Heider (2012), we provide evidence that equity
C 2015 John Wiley & Sons Ltd 950 BAXAMUSA, MOHANTY AND RAO
is predominantly used to finance R&D projects where information asymmetry about
investment risk and debt contracting costs (agency cost of debt) are likely to be high.
In contrast, debt is predominantly used to finance capital expenditures and liquidity
needs where risk information asymmetry and debt contracting costs (agency cost of
debt) are likely to be low. (2) We provide this empirical support in a comprehensive
framework that considers both debt and equity financing and on the investment side
differentiates investments by their underlying degree of risk information asymmetry.
Previous studies either ignored one of the sources of financing or did not delineate
investments by their risk information asymmetry. (3) Our methodology is based on a
framework of joint determination of sources and uses of funds, allowing us to better
establish causality between financing choice and how those funds are deployed, and
mitigate the problem of omitted variables.
The rest of the paper is organized as follows. The next section develops the hy-
potheses. In section 3, we discuss our empirical design and sample. Section 4 presents
the results, and section 5 concludes. 2. HYPOTHESES DEVELOPMENT
Recent work by Fulghieri and Lukin (2001) and Halov and Heider (2012) suggests
that the nature of the investment may dictate financing preference. Halov and Heider
(2012) argue that the traditional PO model ignores investment risk. Specifically, the
traditional Myers and Majluf (1984) PO model assumes that the adverse selection costs
vary across securities but that investment risk is constant. Halov and Heider (2012, p. 2)
argue that “debt dominates equity financing only if there is no asymmetric information
about the risk of a firm’s future investments.” More importantly, they demonstrate that
at the other extreme equity dominates debt financing when “there is only asymmetric
information about the risk of the firms’ future investments”. (Halov and Heider, 2012,
p. 2). Their model shows that firms prefer equity over debt when there is greater infor-
mation asymmetry between the firm and outsiders about future investment risk, i.e.,
adverse selection cost of debt increases with information asymmetry about investment
risk. They note that their theory is consistent with observed patterns that the debt-
financing deficit relationship is weakest for small and young firms (e.g., Fama and
French, 2002; Frank and Goyal, 2003; and Lemmon and Zender, 2010), precisely the
firms that are deemed to be most affected by adverse selection costs in the traditional
PO model. Halov and Heider (2012) note that small and young firms are the ones most
likely to be associated with greater information asymmetry about the risk of their future
investments. Similarly, Fulghieri and Lukin, (2001, p. 5) find that “the likelihood that
a firm will issue equity increases with the value of the project relative to the amount
of external funds raised and with the extent of the informational asymmetry between
insiders and outsiders.” Cooney and Kalay (1993) refine Myers and Majluf’s (1984)
model and show that if the market anticipates a valuable project for the firm and the
uncertainty surrounding the NPV of the new project is sufficiently large relative to
assets-in-place, then stock price reaction would be positive in response to an equity
issue announcement. This in turn implies a preference for equity financing. Cooney
and Kalay (1993) suggest that high market-to-book value firms are likely to have greater
uncertainty about the value of their investment opportunities than about the value of
their assets-in-place, and hence are more likely to experience positive announcement
effects. Wu and Wang (2005) show that taking into account the private benefits of
C 2015 John Wiley & Sons Ltd
INVESTMENT RISK ASYMMETRY AND FINANCING CHOICE 951
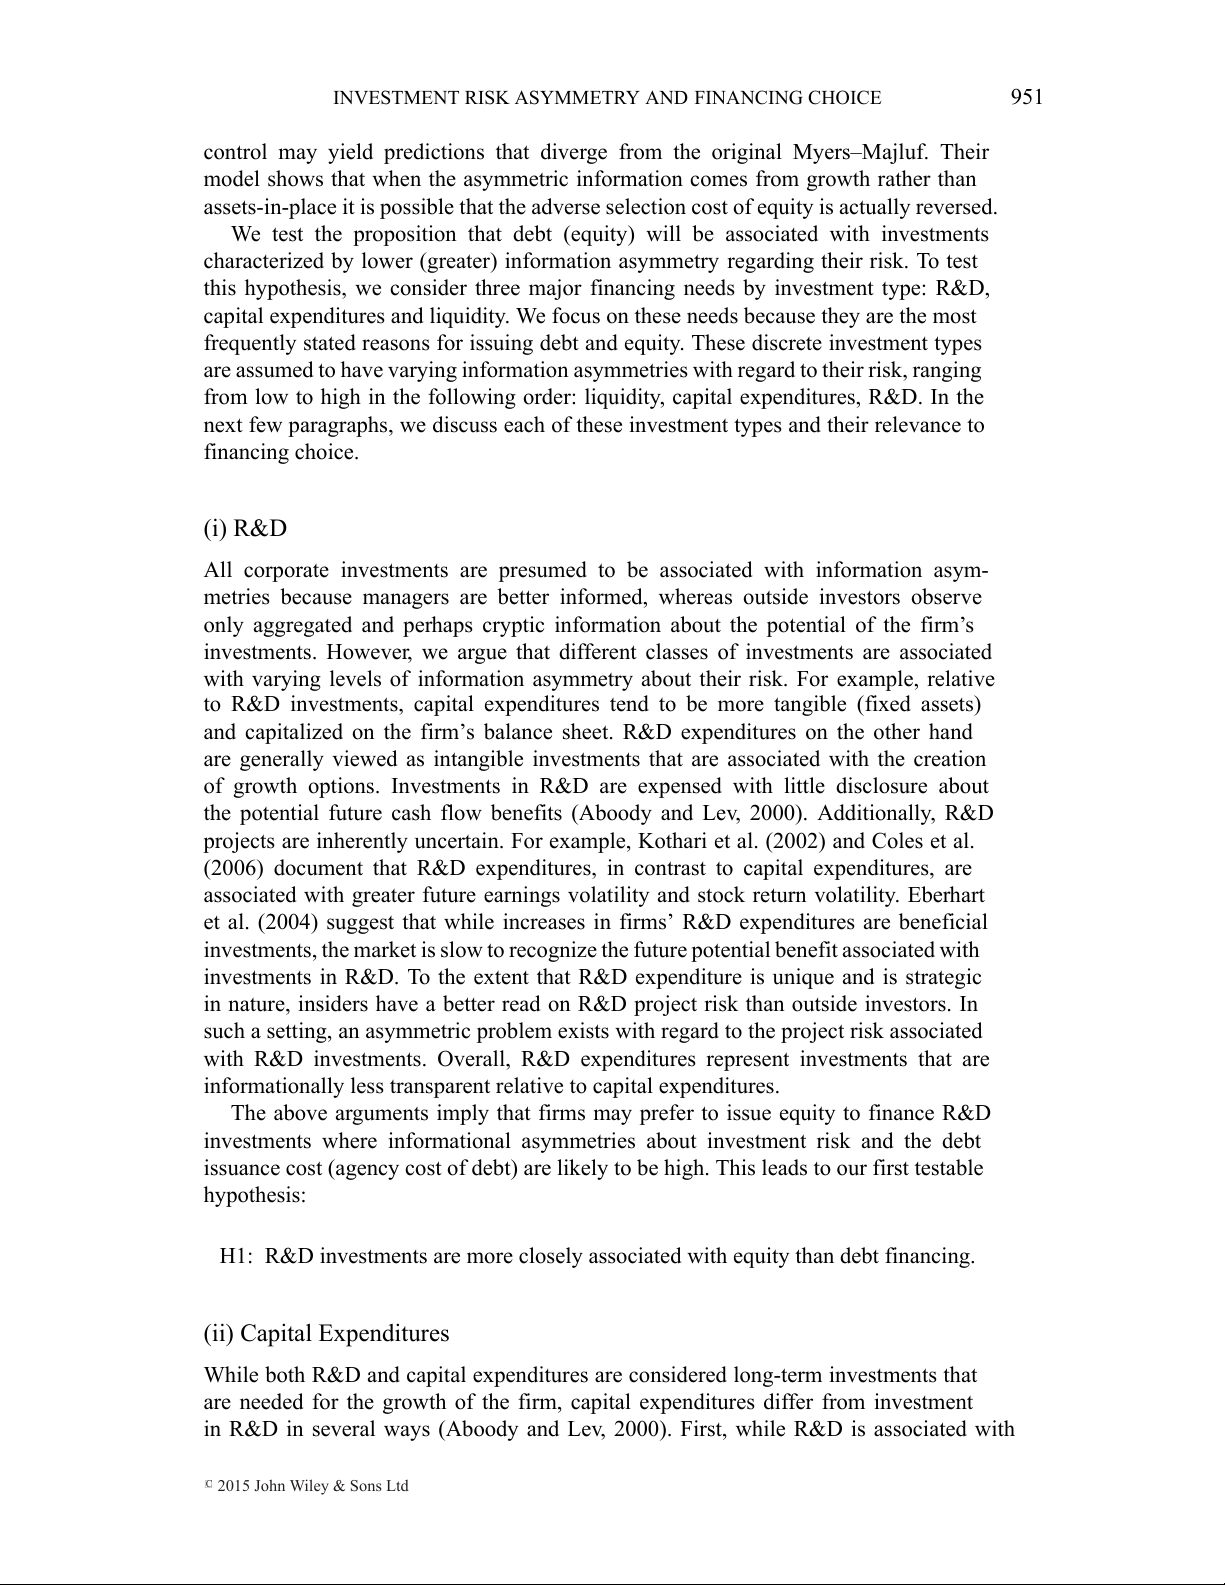
control may yield predictions that diverge from the original Myers–Majluf. Their
model shows that when the asymmetric information comes from growth rather than
assets-in-place it is possible that the adverse selection cost of equity is actually reversed.
We test the proposition that debt (equity) will be associated with investments
characterized by lower (greater) information asymmetry regarding their risk. To test
this hypothesis, we consider three major financing needs by investment type: R&D,
capital expenditures and liquidity. We focus on these needs because they are the most
frequently stated reasons for issuing debt and equity. These discrete investment types
are assumed to have varying information asymmetries with regard to their risk, ranging
from low to high in the following order: liquidity, capital expenditures, R&D. In the
next few paragraphs, we discuss each of these investment types and their relevance to financing choice. (i) R&D
All corporate investments are presumed to be associated with information asym-
metries because managers are better informed, whereas outside investors observe
only aggregated and perhaps cryptic information about the potential of the firm’s
investments. However, we argue that different classes of investments are associated
with varying levels of information asymmetry about their risk. For example, relative
to R&D investments, capital expenditures tend to be more tangible (fixed assets)
and capitalized on the firm’s balance sheet. R&D expenditures on the other hand
are generally viewed as intangible investments that are associated with the creation
of growth options. Investments in R&D are expensed with little disclosure about
the potential future cash flow benefits (Aboody and Lev, 2000). Additionally, R&D
projects are inherently uncertain. For example, Kothari et al. (2002) and Coles et al.
(2006) document that R&D expenditures, in contrast to capital expenditures, are
associated with greater future earnings volatility and stock return volatility. Eberhart
et al. (2004) suggest that while increases in firms’ R&D expenditures are beneficial
investments, the market is slow to recognize the future potential benefit associated with
investments in R&D. To the extent that R&D expenditure is unique and is strategic
in nature, insiders have a better read on R&D project risk than outside investors. In
such a setting, an asymmetric problem exists with regard to the project risk associated
with R&D investments. Overall, R&D expenditures represent investments that are
informationally less transparent relative to capital expenditures.
The above arguments imply that firms may prefer to issue equity to finance R&D
investments where informational asymmetries about investment risk and the debt
issuance cost (agency cost of debt) are likely to be high. This leads to our first testable hypothesis:
H1: R&D investments are more closely associated with equity than debt financing. (ii) Capital Expenditures
While both R&D and capital expenditures are considered long-term investments that
are needed for the growth of the firm, capital expenditures differ from investment
in R&D in several ways (Aboody and Lev, 2000). First, while R&D is associated with
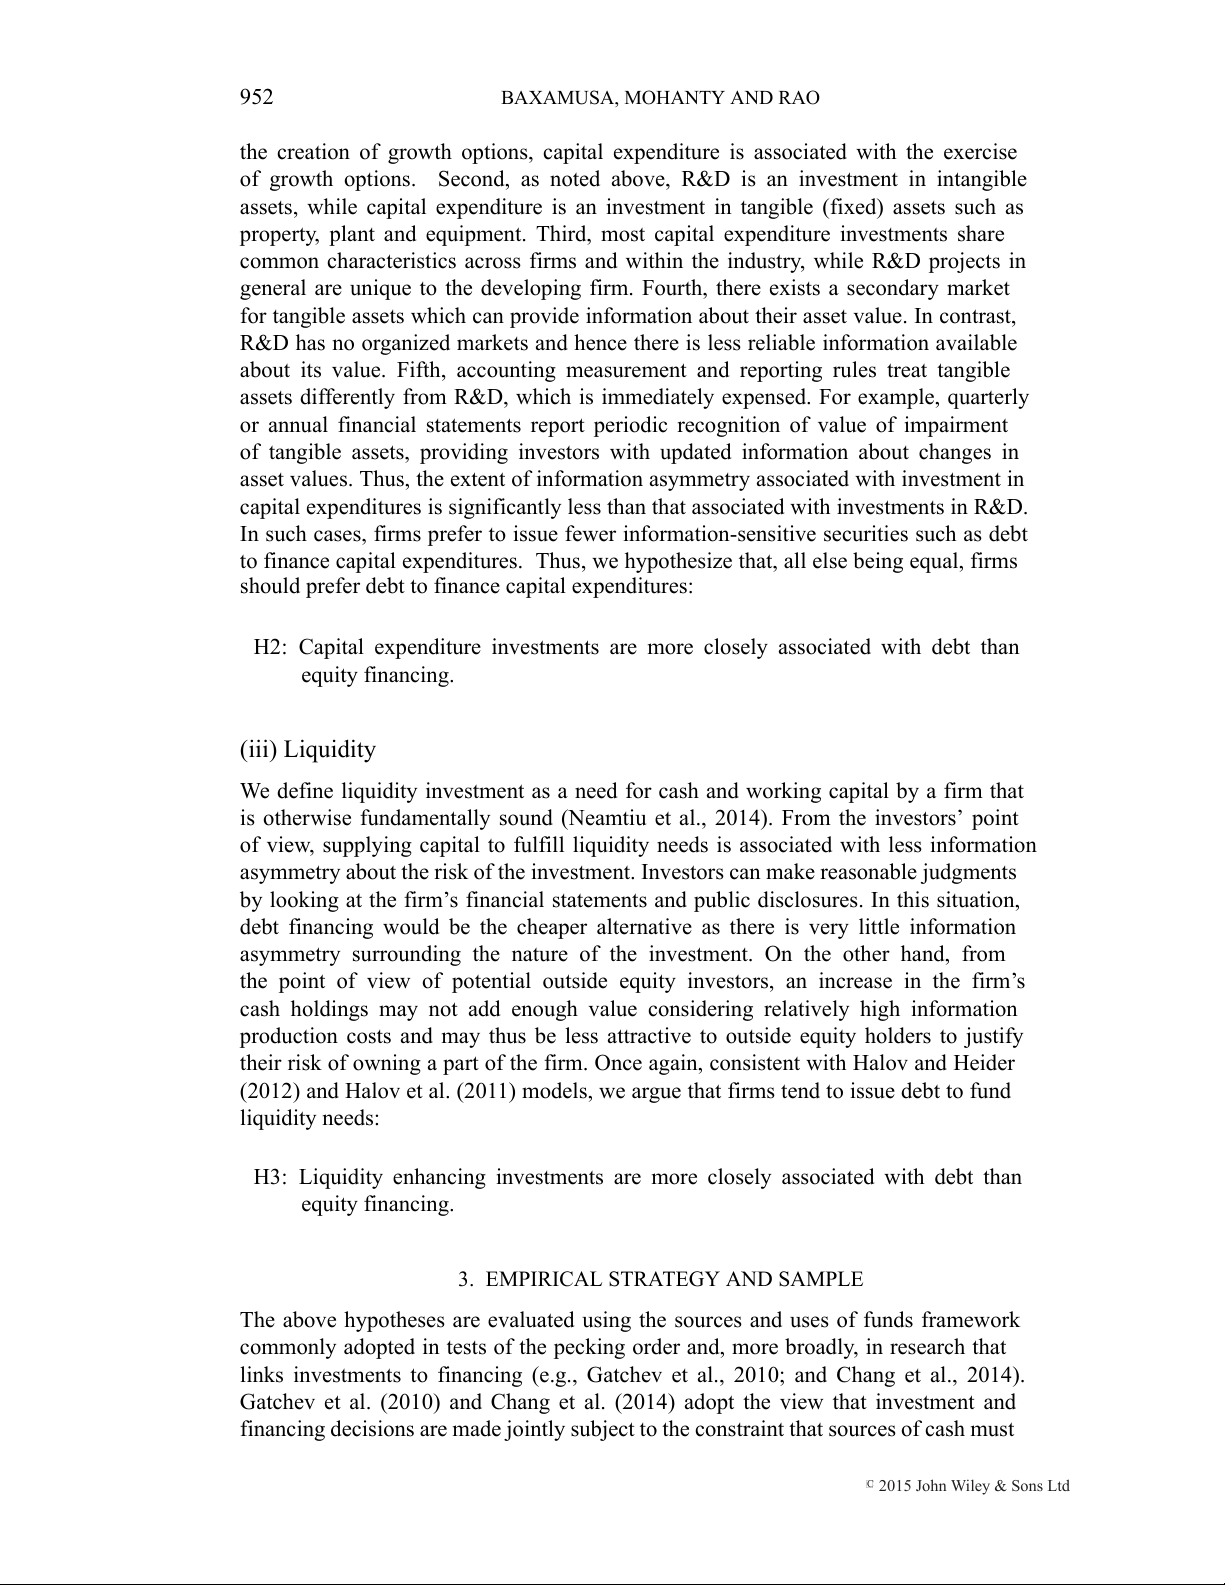
C 2015 John Wiley & Sons Ltd 952 BAXAMUSA, MOHANTY AND RAO
the creation of growth options, capital expenditure is associated with the exercise
of growth options. Second, as noted above, R&D is an investment in intangible
assets, while capital expenditure is an investment in tangible (fixed) assets such as
property, plant and equipment. Third, most capital expenditure investments share
common characteristics across firms and within the industry, while R&D projects in
general are unique to the developing firm. Fourth, there exists a secondary market
for tangible assets which can provide information about their asset value. In contrast,
R&D has no organized markets and hence there is less reliable information available
about its value. Fifth, accounting measurement and reporting rules treat tangible
assets differently from R&D, which is immediately expensed. For example, quarterly
or annual financial statements report periodic recognition of value of impairment
of tangible assets, providing investors with updated information about changes in
asset values. Thus, the extent of information asymmetry associated with investment in
capital expenditures is significantly less than that associated with investments in R&D.
In such cases, firms prefer to issue fewer information-sensitive securities such as debt
to finance capital expenditures. Thus, we hypothesize that, all else being equal, firms
should prefer debt to finance capital expenditures:
H2: Capital expenditure investments are more closely associated with debt than equity financing. (iii) Liquidity
We define liquidity investment as a need for cash and working capital by a firm that
is otherwise fundamentally sound (Neamtiu et al., 2014). From the investors’ point
of view, supplying capital to fulfill liquidity needs is associated with less information
asymmetry about the risk of the investment. Investors can make reasonable judgments
by looking at the firm’s financial statements and public disclosures. In this situation,
debt financing would be the cheaper alternative as there is very little information
asymmetry surrounding the nature of the investment. On the other hand, from
the point of view of potential outside equity investors, an increase in the firm’s
cash holdings may not add enough value considering relatively high information
production costs and may thus be less attractive to outside equity holders to justify
their risk of owning a part of the firm. Once again, consistent with Halov and Heider
(2012) and Halov et al. (2011) models, we argue that firms tend to issue debt to fund liquidity needs:
H3: Liquidity enhancing investments are more closely associated with debt than equity financing.
3. EMPIRICAL STRATEGY AND SAMPLE
The above hypotheses are evaluated using the sources and uses of funds framework
commonly adopted in tests of the pecking order and, more broadly, in research that
links investments to financing (e.g., Gatchev et al., 2010; and Chang et al., 2014).
Gatchev et al. (2010) and Chang et al. (2014) adopt the view that investment and
financing decisions are made jointly subject to the constraint that sources of cash must
C 2015 John Wiley & Sons Ltd
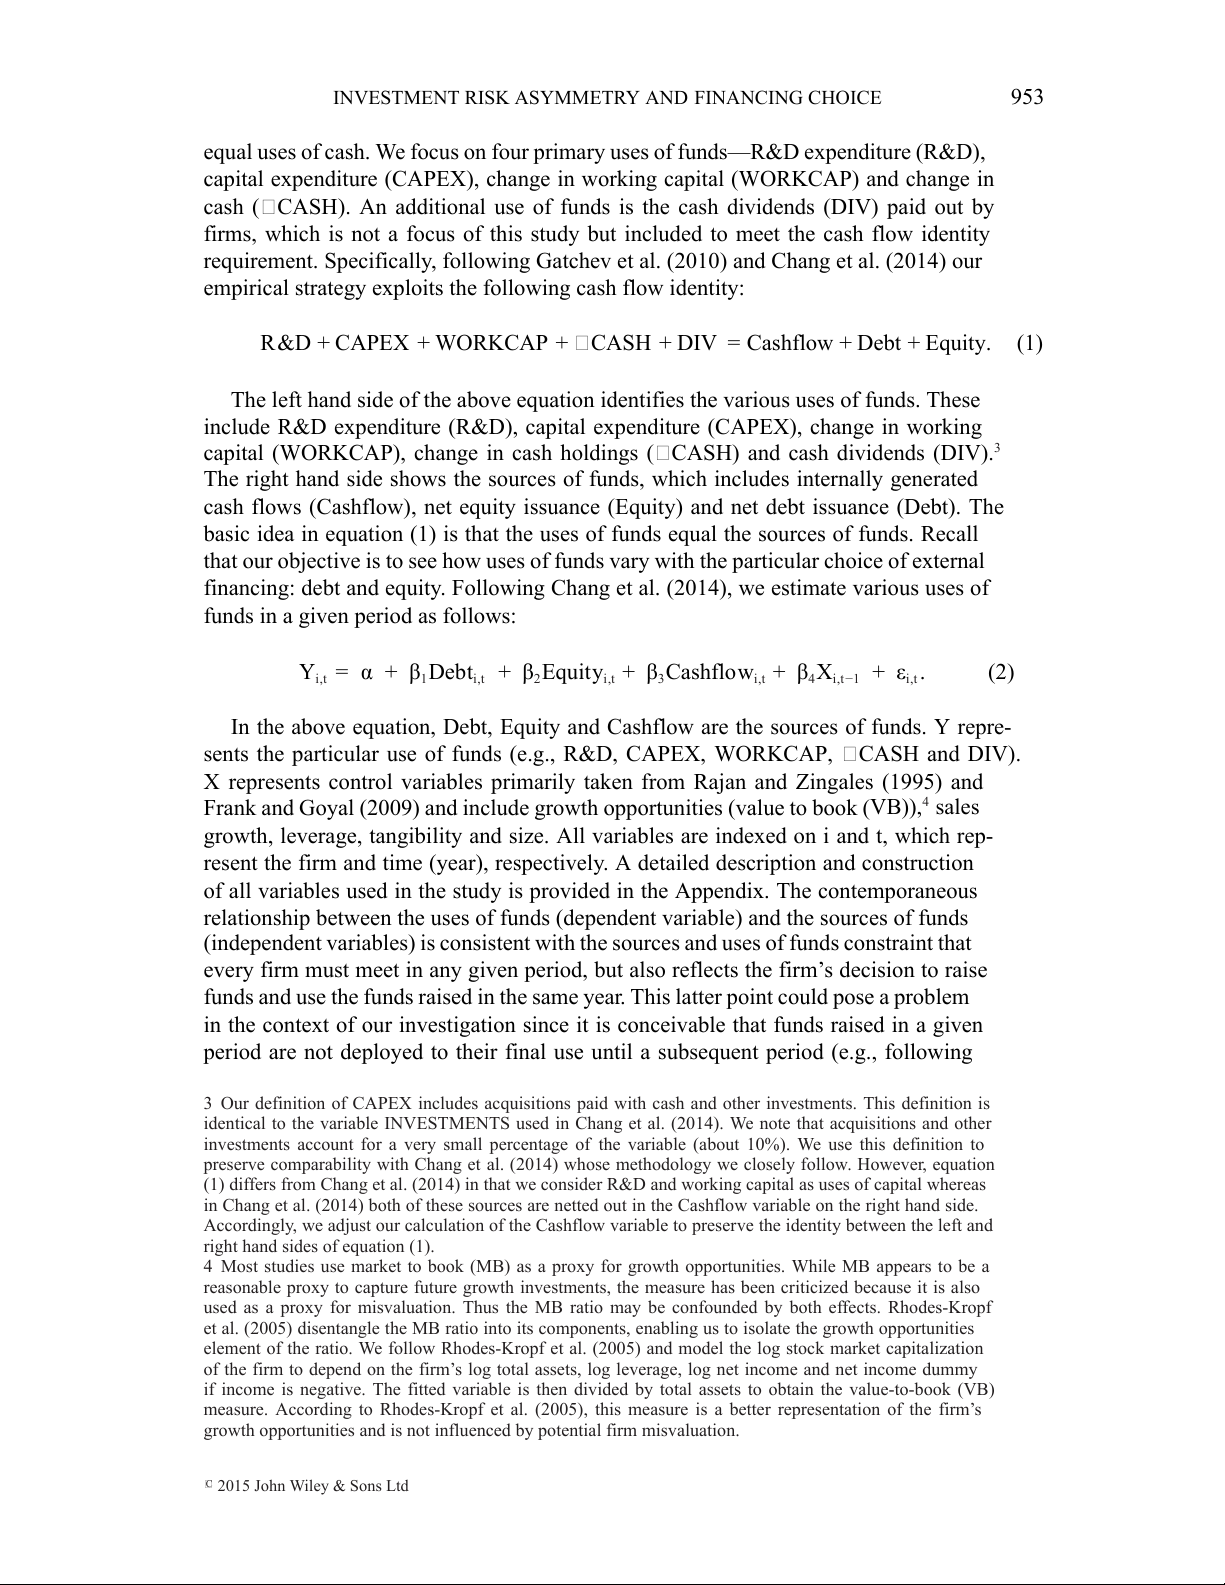
INVESTMENT RISK ASYMMETRY AND FINANCING CHOICE 953
equal uses of cash. We focus on four primary uses of funds—R&D expenditure (R&D),
capital expenditure (CAPEX), change in working capital (WORKCAP) and change in
cash ( CASH). An additional use of funds is the cash dividends (DIV) paid out by
firms, which is not a focus of this study but included to meet the cash flow identity
requirement. Specifically, following Gatchev et al. (2010) and Chang et al. (2014) our
empirical strategy exploits the following cash flow identity:
R&D + CAPEX + WORKCAP + CASH + DIV = Cashflow + Debt + Equity. (1)
The left hand side of the above equation identifies the various uses of funds. These
include R&D expenditure (R&D), capital expenditure (CAPEX), change in working
capital (WORKCAP), change in cash holdings ( CASH) and cash dividends (DIV).3
The right hand side shows the sources of funds, which includes internally generated
cash flows (Cashflow), net equity issuance (Equity) and net debt issuance (Debt). The
basic idea in equation (1) is that the uses of funds equal the sources of funds. Recall
that our objective is to see how uses of funds vary with the particular choice of external
financing: debt and equity. Following Chang et al. (2014), we estimate various uses of
funds in a given period as follows:
Yi,t = α + β1Debti,t + β2Equityi,t + β3Cashflowi,t + β4Xi,t−1 + εi,t. (2)
In the above equation, Debt, Equity and Cashflow are the sources of funds. Y repre-
sents the particular use of funds (e.g., R&D, CAPEX, WORKCAP, CASH and DIV).
X represents control variables primarily taken from Rajan and Zingales (1995) and
Frank and Goyal (2009) and include growth opportunities (value to book (VB)),4 sales
growth, leverage, tangibility and size. All variables are indexed on i and t, which rep-
resent the firm and time (year), respectively. A detailed description and construction
of all variables used in the study is provided in the Appendix. The contemporaneous
relationship between the uses of funds (dependent variable) and the sources of funds
(independent variables) is consistent with the sources and uses of funds constraint that
every firm must meet in any given period, but also reflects the firm’s decision to raise
funds and use the funds raised in the same year. This latter point could pose a problem
in the context of our investigation since it is conceivable that funds raised in a given
period are not deployed to their final use until a subsequent period (e.g., following
3 Our definition of CAPEX includes acquisitions paid with cash and other investments. This definition is
identical to the variable INVESTMENTS used in Chang et al. (2014). We note that acquisitions and other
investments account for a very small percentage of the variable (about 10%). We use this definition to
preserve comparability with Chang et al. (2014) whose methodology we closely follow. However, equation
(1) differs from Chang et al. (2014) in that we consider R&D and working capital as uses of capital whereas
in Chang et al. (2014) both of these sources are netted out in the Cashflow variable on the right hand side.
Accordingly, we adjust our calculation of the Cashflow variable to preserve the identity between the left and
right hand sides of equation (1).
4 Most studies use market to book (MB) as a proxy for growth opportunities. While MB appears to be a
reasonable proxy to capture future growth investments, the measure has been criticized because it is also
used as a proxy for misvaluation. Thus the MB ratio may be confounded by both effects. Rhodes-Kropf
et al. (2005) disentangle the MB ratio into its components, enabling us to isolate the growth opportunities
element of the ratio. We follow Rhodes-Kropf et al. (2005) and model the log stock market capitalization
of the firm to depend on the firm’s log total assets, log leverage, log net income and net income dummy
if income is negative. The fitted variable is then divided by total assets to obtain the value-to-book (VB)
measure. According to Rhodes-Kropf et al. (2005), this measure is a better representation of the firm’s
growth opportunities and is not influenced by potential firm misvaluation.
C 2015 John Wiley & Sons Ltd 954 BAXAMUSA, MOHANTY AND RAO
year), but are parked in a cash account temporarily. Thus, the contemporaneous
framework of equation (2) may lead to the incorrect inference that a financing source
is used to build up liquidity when in fact it is used for an alternate purpose such as
capital expenditure (e.g., CAPEX), which occurs in a following period. However, this
is easily remedied by including lagged values of financing in estimating equation (2).
Gatchev et al. (2010) recommend estimating equation (2) simultaneously, across the
various uses of funds, using seemingly unrelated regression estimation procedure with
the constraint that the coefficients across each use of funds equation for any given
source of funds (i.e., debt, equity, cashflow) should sum to one. Chang et al. (2014)
show that so long as the variables are defined consistently there is no need to impose
the constraint that the coefficients sum to one and that OLS estimation, in contrast to
more sophisticated methodologies like seemingly unrelated regressions, produces the
most reliable estimates. Consequently, we adopt OLS in estimating equation (2).5
The sample consists of US firms in the annual CRSP/Compustat merged dataset
and spans fiscal years 1971 through 2008. In order to ensure comparability of data
over time, all dollar denominated variables are converted to 1983 dollars by using the
Consumer Price Index (CPI) from the Bureau of Labor Statistics (BLS). Firm–years
are excluded if they have missing data for book assets or are financial companies.
Missing values for R&D are replaced with zero.6 We mitigate the effects of misreported
data and extreme outliers in the case of all numeric variables by winsorizing either
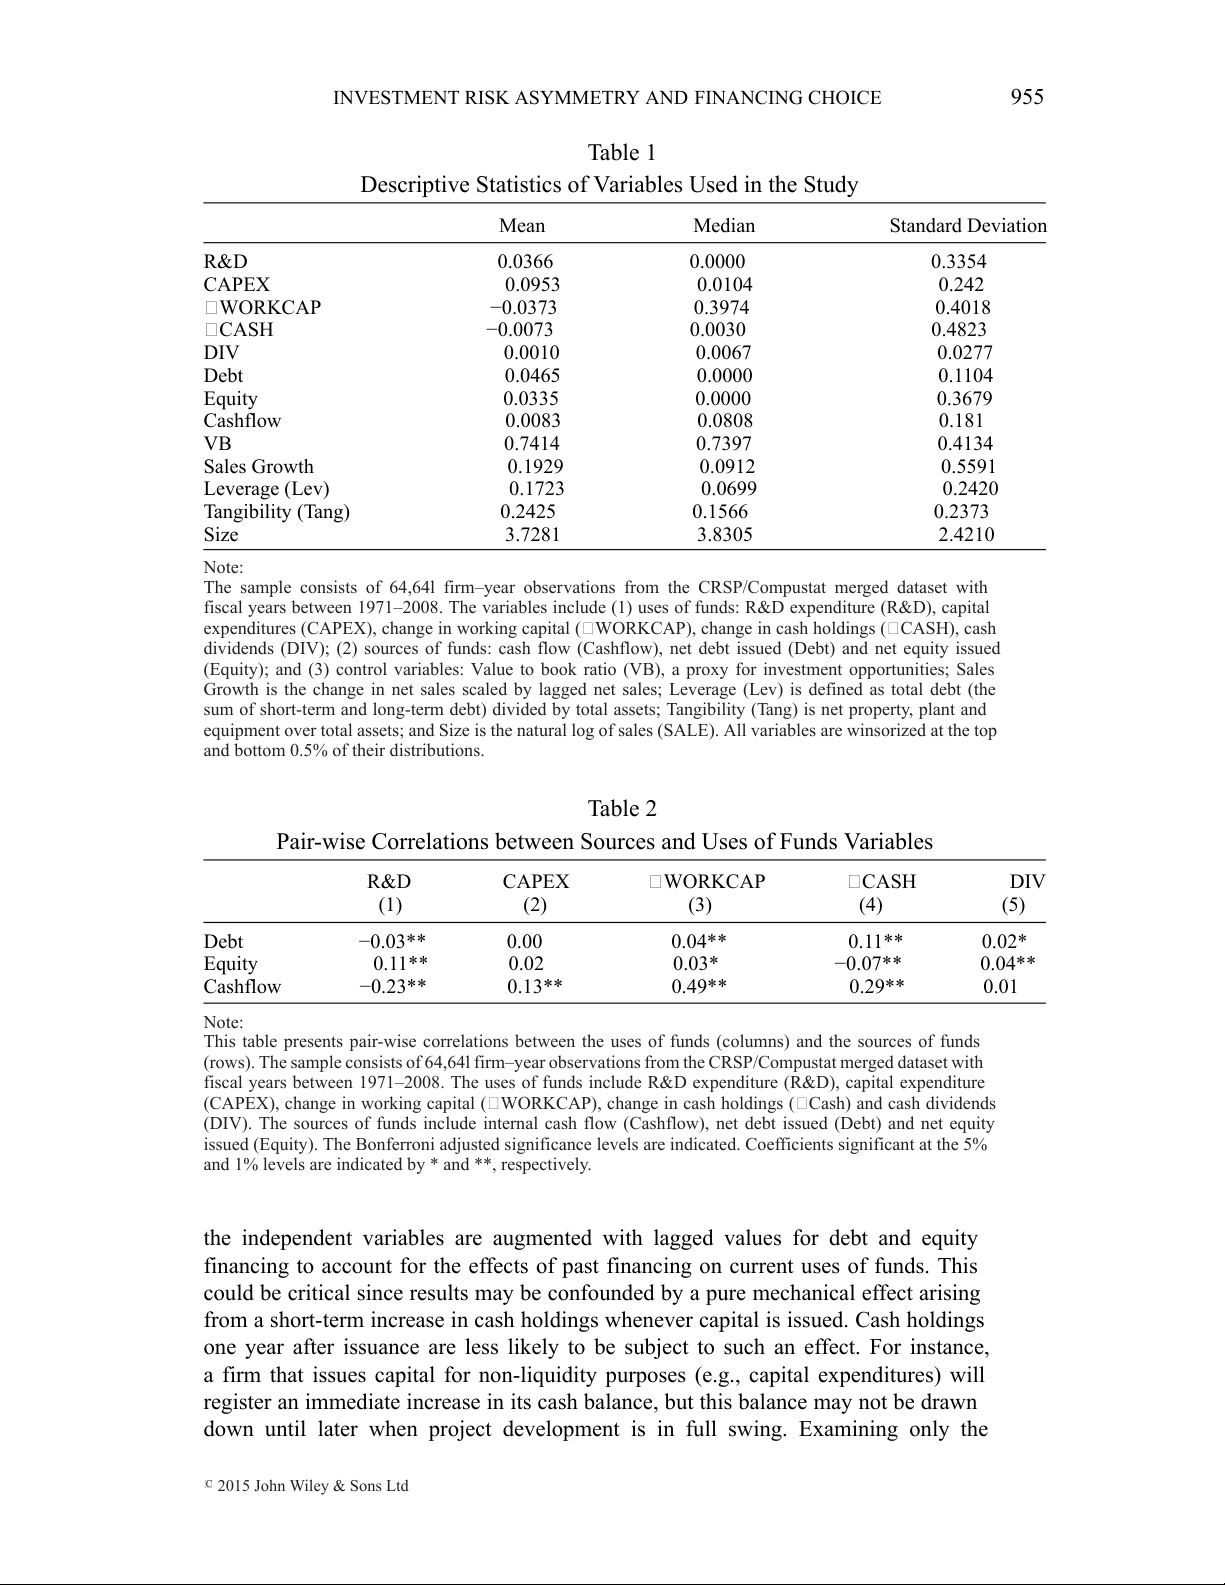
tail at the 0.5% level. Table 1 presents the summary statistics of the variables used
in equation (2). Table 2 presents correlation coefficients between the various uses of
funds and the sources of funds. As a percentage of assets, capital expenditure accounts
for the most significant use of funds at 9.5% followed by R&D at 3.7%. The mean
change in working capital expenditure is –3.7% while the mean change in cash is a –
0.1%. On average, debt financing in any given year amounts to 4.6% of assets, while
external equity financing is equal to 3.3% of assets. Consistent with Chang et al.’s
(2014) observation, the sum of the means of R&D, CAPEX, WORKCAP, Cash and
DIV less the means for Debt, Equity and Cashflow equal to zero. Thus, the accounting
identity can be observed in the data.
The pair-wise correlations in Table 2 reveal that equity (debt) financing is signif-
icantly positively (negatively) correlated with R&D. On the other hand, increases in
cash are significantly positively (negatively) correlated with debt (equity) financing.
Both debt and equity financing are positively correlated with increases in working
capital investments, while both appear to be uncorrelated with capital expenditures.
Overall, the results provide preliminary support for the investment risk information
asymmetry argument, especially when contrasting the correlations between external
financing source and their use for R&D and cash buildup. 4. RESULTS
Columns (1) through (5) in Tables 3 and 4 provide estimates of equation (2) for
each of the uses of funds. Table 3 presents results for the base model. In Table 4
5 We thank an anonymous referee for suggesting the use of the sources and uses of funds framework and,
in particular, reference to the work by Chang et al. (2014).
6 In unreported results, regressions using only non-missing values of R&D were also estimated. The results
are similar to those reported here. This is not surprising as the literature (see Himmelberg et al., 1999) has
already established that missing values of R&D generally represents zero R&D expenditures.
C 2015 John Wiley & Sons Ltd
INVESTMENT RISK ASYMMETRY AND FINANCING CHOICE 955 Table 1
Descriptive Statistics of Variables Used in the Study Mean Median Standard Deviation R&D 0.0366 0.0000 0.3354 CAPEX 0.0953 0.0104 0.242 WORKCAP −0.0373 0.3974 0.4018 CASH −0.0073 0.0030 0.4823 DIV 0.0010 0.0067 0.0277 Debt 0.0465 0.0000 0.1104 Equity 0.0335 0.0000 0.3679 Cashflow 0.0083 0.0808 0.181 VB 0.7414 0.7397 0.4134 Sales Growth 0.1929 0.0912 0.5591 Leverage (Lev) 0.1723 0.0699 0.2420 Tangibility (Tang) 0.2425 0.1566 0.2373 Size 3.7281 3.8305 2.4210 Note:
The sample consists of 64,64l firm–year observations from the CRSP/Compustat merged dataset with
fiscal years between 1971–2008. The variables include (1) uses of funds: R&D expenditure (R&D), capital
expenditures (CAPEX), change in working capital ( WORKCAP), change in cash holdings ( CASH), cash
dividends (DIV); (2) sources of funds: cash flow (Cashflow), net debt issued (Debt) and net equity issued
(Equity); and (3) control variables: Value to book ratio (VB), a proxy for investment opportunities; Sales
Growth is the change in net sales scaled by lagged net sales; Leverage (Lev) is defined as total debt (the
sum of short-term and long-term debt) divided by total assets; Tangibility (Tang) is net property, plant and
equipment over total assets; and Size is the natural log of sales (SALE). All variables are winsorized at the top
and bottom 0.5% of their distributions. Table 2
Pair-wise Correlations between Sources and Uses of Funds Variables R&D CAPEX WORKCAP CASH DIV (1) (2) (3) (4) (5) Debt −0.03** 0.00 0.04** 0.11** 0.02* Equity 0.11** 0.02 0.03* −0.07** 0.04** Cashflow −0.23** 0.13** 0.49** 0.29** 0.01 Note:
This table presents pair-wise correlations between the uses of funds (columns) and the sources of funds
(rows). The sample consists of 64,64l firm–year observations from the CRSP/Compustat merged dataset with
fiscal years between 1971–2008. The uses of funds include R&D expenditure (R&D), capital expenditure
(CAPEX), change in working capital ( WORKCAP), change in cash holdings ( Cash) and cash dividends
(DIV). The sources of funds include internal cash flow (Cashflow), net debt issued (Debt) and net equity
issued (Equity). The Bonferroni adjusted significance levels are indicated. Coefficients significant at the 5%
and 1% levels are indicated by * and **, respectively.
the independent variables are augmented with lagged values for debt and equity
financing to account for the effects of past financing on current uses of funds. This
could be critical since results may be confounded by a pure mechanical effect arising
from a short-term increase in cash holdings whenever capital is issued. Cash holdings
one year after issuance are less likely to be subject to such an effect. For instance,
a firm that issues capital for non-liquidity purposes (e.g., capital expenditures) will
register an immediate increase in its cash balance, but this balance may not be drawn
down until later when project development is in full swing. Examining only the
C 2015 John Wiley & Sons Ltd 956 BAXAMUSA, MOHANTY AND RAO Table 3
Use of Funds and Debt and Equity Financing R&D CAPEX WORKCAP CASH DIV (1) (2) (3) (4) (5) Debtt 0.0086 0.0947 0.0881 0.7678 0.0408 (0.0141) (0.0029)** (0.0057)** (0.0066)** (0.0310) Equityt 0.2115 0.0478 0.0340 0.6870 0.0196 (0.0461)** (0.0026)** (0.0035)** (0.0042)** (0.0006)** Cashflowt −0.0430 0.1142 0.6992 0.2279 0.0017 (0.0007)** (0.0004)** (0.0004)** (0.0007)** (0.0001)** VBt–1 0.0081 0.0042 0.0061 −0.0113 −0.0071 (0.0048) (0.0036) (0.0023) (0.0046)* (0.0008)** Sales Growtht–1 −0.0030 −0.0230 0.0229 0.0003 0.0027 (0.0004)** (0.0005)** (0.0004)** (0.0007) (0.0001)** Leveraget–1 −0.0658 0.0038 0.0283 0.0369 −0.0032 (0.0019)** (0.0020) (0.0022)** (0.0027)** (0.0005)** Tangt–1 0.0928 −0.1192 −0.0625 0.0564 0.0322 (0.0079)** (0.0081)** (0.0062)** (0.0073)** (0.0013)** Size t–1 −0.0240 −0.0247 0.0066 0.0061 0.0355 (0.0009)** (0.0007)** (0.0008)** (0.0010)** (0.0002)** R-squared 0.18 0.12 0.34 0.28 0.08 Coefficients of Debtt − Equityt −0.2029** 0.0469** 0.0541** 0.0808** 0.0212** Note:
This table presents ordinary least squares regression estimates of equation (2) based on the methodology
of Chang et al. (2014). The sample consists of 64,64l firm–year observations from the CRSP/Compustat
merged dataset with fiscal years between 1971–2008. The dependent variable is the use of funds and the
independent variables consist of sources of financing and other control variables. We consider 5 uses of
funds (columns (1)—(5)): R&D expenditure (R&D), capital expenditure (CAPEX), change in working
capital (WORKCAP), change in cash holdings ( CASH) and cash dividends (DIV). The sources of funds
include net debt issued (Debt), net equity issued (Equity) and cash flow (Cashflow). The control variables
include VBt–1, SalesGrowtht –1, Leveraget–1, Tangt–1 and Sizet–1. VBt–1 is a proxy for investment opportunities
(as estimated in Rhodes-Kropf et al., 2005) and is defined as the lagged value of the firm divided by lagged
book value of assets. Sales Growtht–1 is the lagged change in net sales scaled by net sales in the beginning of
the year, Leveraget–1 is defined as the lagged value of total debt (the sum of short-term and long-term debt)
divided by total assets. Tangibility (Tangt–1) is the lagged value of net property, plant and equipment over
total assets. Sizet–1 is the lagged value of natural log of sales (SALE). Firm-level fixed effects are generated
by demeaning the data for each firm for both the dependent and independent variables. Constant terms
and year dummies are not reported. The last row shows the difference in the coefficient for Debt and Equity
financing variables and the associated significance level. Standard errors of estimates for the coefficients
are presented in parentheses. Coefficients significant at the 5% and 1% levels are indicated by * and **, respectively.
contemporaneous effect could lead to the incorrect inference that capital was raised
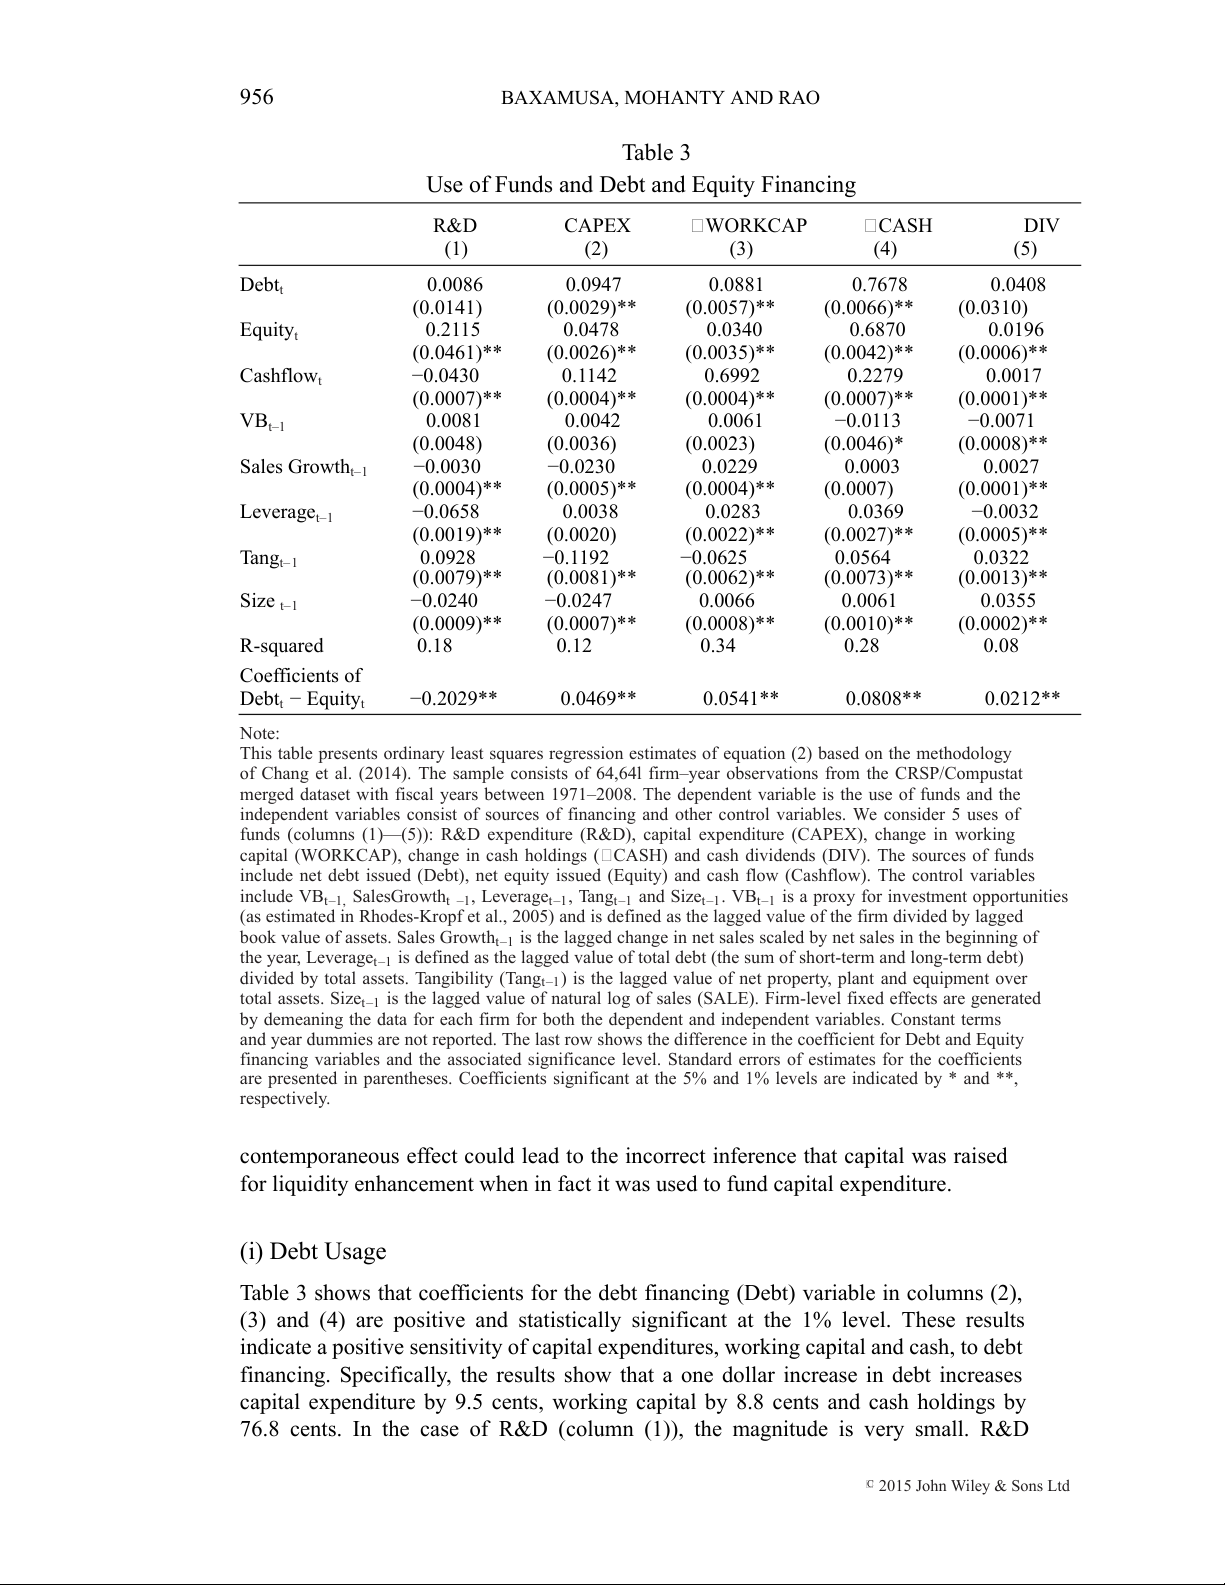
for liquidity enhancement when in fact it was used to fund capital expenditure. (i) Debt Usage
Table 3 shows that coefficients for the debt financing (Debt) variable in columns (2),
(3) and (4) are positive and statistically significant at the 1% level. These results
indicate a positive sensitivity of capital expenditures, working capital and cash, to debt
financing. Specifically, the results show that a one dollar increase in debt increases
capital expenditure by 9.5 cents, working capital by 8.8 cents and cash holdings by
76.8 cents. In the case of R&D (column (1)), the magnitude is very small. R&D
C 2015 John Wiley & Sons Ltd
INVESTMENT RISK ASYMMETRY AND FINANCING CHOICE 957 Table 4
Use of Funds from Lagged Debt and Lagged Equity Financing R&D CAPEX WORKCAP CASH DIV (1) (2) (3) (4) (5) Debtt–1 −0.0077 0.0437 0.0251 0.0101 −0.0013 (0.0040) (0.0043)** (0.0056)** (0.0103) (0.0011) Equityt–1 0.0194 0.0011 −0.0128 −0.0345 −0.0023 (0.0033)** (0.0028) (0.0029)** (0.0060)** (0.0018) Debtt 0.0078 0.1067 0.0904 0.7923 0.0030 (0.0049) (0.0249)** (0.0135)** (0.1070)** (0.0020) Equityt 0.2189 0.0467 0.0247 0.6984 0.0114 (0.0562)** (0.0140)** (0.0039)** (0.2046)** (0.0026)** Cashflowt −0.0393 0.0214 0.7878 0.2231 0.0071 (0.0107)** (0.0055)** (0.1204)** (0.0529)** (0.0021)** VBt–1 0.0119 0.0003 0.0017 −0.0089 −0.0050 (0.0032)** (0.0029) (0.0031) (0.0051) (0.0009)** Sales Growtht–1 −0.0034 −0.0005 0.0035 0.0001 0.0003 (0.0011)** (0.0003) (0.0006)** (0.0006) (0.0001)** Leveraget–1 −0.0574 0.0069 0.0245 0.0332 −0.0072 (0.0128)** (0.0014)** (0.0068)** (0.0087)** (0.0027)** Tangt–1 0.0875 −0.1058 −0.0400 0.0568 0.0015 (0.0158)** (0.0265)** (0.0070)** (0.0189)** (0.0019) Sizet–1 −0.0183 −0.0110 0.0104 0.0079 0.0110 (0.0029)** (0.0018)** (0.0019)** (0.0018)** (0.0023)** R-squared 0.19 0.14 0.36 0.27 0.10 Coefficients of Debtt–1 – Equityt–1 −0.027** 0.0426** 0.0379** 0.0446** 0.0010 Debtt − Equityt −0.2111** 0.0600** 0.0658** 0.0939** −0.0084** Note:
This table presents ordinary least squares regression estimates of equation (2) based on the methodology
of Chang et al. (2014). The sample consists of 64,64l firm–year observations from the CRSP/Compustat
merged dataset with fiscal years between 1971–2008. The dependent variable is the use of funds and the
independent variables consist of sources of financing and other control variables. We consider 5 uses of
funds (columns (1)—(5)): R&D expenditure (R&D), capital expenditure (CAPEX), change in working
capital (WORKCAP), change in cash holdings ( CASH) and cash dividends (DIV). The sources of funds
include net debt issued (Debt), net equity issued (Equity), lagged net debt issued (Debtt–1), lagged net equity
issued (Equityt–1) and cash flow (Cashflow). The control variables include VBt–1, Sales Growtht–1, Leveraget–1,
Tangt–1 and Sizet–1. VBt–1 is a proxy for investment opportunities (as estimated in 2005Rhodes-Kropf et al.,
2005) and is defined as the lagged value of the firm divided by lagged book value of assets. Sales Growtht–1
is the lagged change in net sales scaled by net sales in the beginning of the year, Leveraget–1 is defined as
the lagged value of total debt (the sum of short-term and long-term debt) divided by total assets. Tangibility
(Tangt–1) is the lagged value of net property, plant and equipment over total assets. Sizet–1 is the lagged value
of natural log of sales (SALE). Firm-level fixed effects are generated by demeaning the data for each firm
for both the dependent and independent variables. Constant terms and year dummies are not reported.
The last row shows the difference in the coefficient for Debt and Equity financing variables and the associated
significance level. Standard errors of estimates for the coefficients are presented in parentheses. Coefficients
significant at the 5% and 1% levels are indicated by * and **, respectively.
accounts for only one cent of every dollar of debt financing. It is interesting to
note that the coefficients for debt financing when added across the five use of funds
equations adds up to one. We observe this for the equity financing variable as well.
This is consistent with Chang et al.’s (2014) observation that as long as the variables
are consistently defined there is no need to impose the constraint that coefficients
across the various uses should sum to one for any given source of financing.
C 2015 John Wiley & Sons Ltd 958 BAXAMUSA, MOHANTY AND RAO
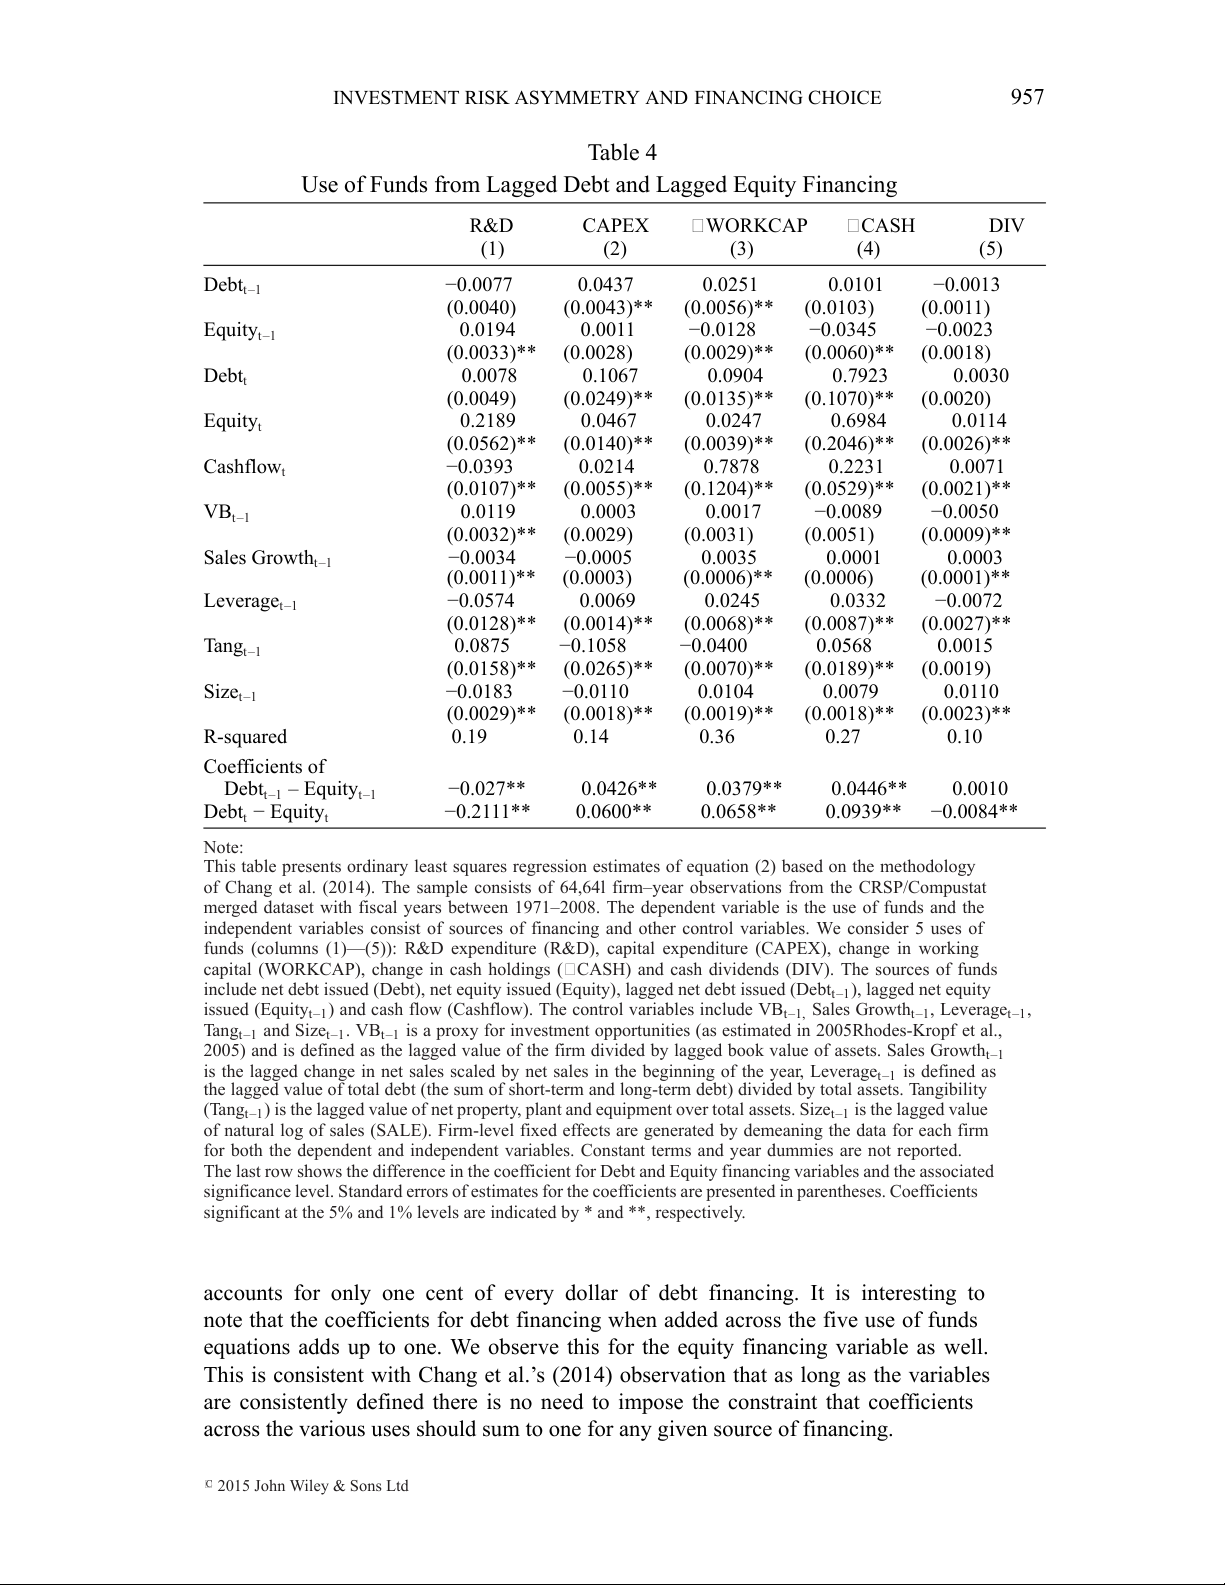
The relatively large coefficient for cash in Table 3 suggests that the firm may
be issuing debt in a particular year and then using the funds in subsequent years.
This is evident from Table 4 which shows that the increases in working capital and
capital expenditure are positively related to lagged debt financing. For example,
Table 4 shows that contemporaneous debt financing accounts for 11 cents of capital
expenditure while 4 cents comes from lagged debt financing. This coupled with the
much smaller coefficient for lagged debt financing in the cash equation (compared
to the coefficient for contemporaneous debt) indicates that there may be a lag
between financing and where it is eventually used. Considering both Tables 3 and
4 we find that debt financing is associated with a build-up in cash, working capital and
investment in capital expenditures. The insignificant coefficient for debt financing
in the R&D equation (Tables 3 and 4) indicates that this source of financing is
less likely to be used to finance R&D expenditures. The combined evidence from
Table 3 and Table 4 supports the view that debt financing is used to fund investments
with low information asymmetry about their risk such as liquidity enhancement and
capital expenditures but not R&D investments, which are at the opposite end of the spectrum. (ii) Equity Usage
Table 3 shows the contemporaneous relationship between equity financing and
various uses of funds. The regression estimates reveal positive statistically significant
coefficients for the equity issuance variable across the various uses of funds. In
terms of economic significance, a one-dollar increase in equity financing increases
investment in R&D by 21 cents, capital expenditures by 5 cents, working capital by
3 cents and cash holdings by 69 cents. When compared to the coefficient for debt
financing, there is clear preference by firms to use equity to finance R&D projects.
The preference for equity financing in funding R&D investments is also evident when
lagged values of the financing variable are included (Table 4). Though equity financ-
ing is positively associated with contemporaneous increases in capital expenditures,
working capital and cash, the coefficients are smaller than those evidenced for debt
financing. The bottom row of Tables 3 and 4 presents the difference in the debt
and equity financing sensitivity with respect to each of the uses of funds and their
significance levels. All of the differences are statistically significant. Additionally, from
Table 4 we observe that lagged equity financing is not related to current capital
expenditure and is significantly negatively related to increases in working capital and cash.
Overall, the results from Tables 3 and 4 suggest that firms are most likely to use debt
financing to fund capital expenditures and current liquidity needs. On the other hand,
firms are likely to use equity over debt to finance R&D projects. Our results suggest
that investments with the highest risk information asymmetry, i.e., R&D, are financed
through equity while investments with relatively low information asymmetry about
their risk, i.e., capital expenditures and liquidity, are financed primarily through debt
financing. Thus investments with high (low) information asymmetry about risk such
as R&D (liquidity and capital expenditures) are financed by more (less) information
sensitive equity (debt) securities.
C 2015 John Wiley & Sons Ltd
INVESTMENT RISK ASYMMETRY AND FINANCING CHOICE 959 Table 5
Robustness Test for R&D Using Asset Tangibility
Low Tangible Assets High Tangible Assets Low Tangible Assets High Tangible Assets R&D (1) (2) (3) (4) Debtt–1 −0.0052 −0.0050 (0.0067) (0.0235) Equityt–1 0.0404 0.0202 (0.0070)** (0.0052)** Debtt −0.0784 0.0522 −0.0667 0.0757 (0.0084)** (0.0389) (0.0099)** (0.0642) Equityt 0.2806 0.1924 0.2968 0.1853 (0.0960)** (0.0789)* (0.1060)** (0.0694)** Cashflowt −0.0497 −0.0703 −0.0493 −0.0560 (0.0057)** (0.0054)** (0.0068)** (0.0053)** VBt–1 0.0338 0.0109 0.0256 0.0353 (0.0061)** (0.0068) (0.0057)** (0.0063)** Sales Growtht–1 −0.0003 −0.0003 −0.0007 −0.0005 (0.0012) (0.0020) (0.0010) (0.0012) Leveraget–1 −0.0018 −0.0008 −0.0033 −0.0023 (0.0003)** (0.0003)** (0.0001)** (0.0003)** Tangt–1 0.0373 0.0450 0.0445 0.0626 (0.0134)** (0.0200)* (0.0208)* (0.0131)** Sizet–1 −0.0161 −0.0210 −0.0150 −0.0085 (0.0031)** (0.0034)** (0.0030)** (0.0022)** R-squared 0.19 0.18 0.19 0.18 Note:
This table presents regression estimates of equation (2) for R&D expenditures classified by proportion of
tangible assets to total assets. The test involves splitting the sample into two halves (low tangible assets and
high tangible assets) based on the median value of tangible assets (as a proportion of total assets). Number
of observations is 32,320 (32,321) for the low (high) tangible subset. The dependent variable is R&D
expenditure. The independent variables consist of sources of funds variables and other control variables.
The sources of funds include net debt issued (Debt), net equity issued (Equity), lagged net debt issued
(Debtt–1), lagged net equity issued (Equityt–1) and cash flow (Cashflow). The control variables include VBt–1,
Sales Growtht–1, Leveraget–1, Tangt–1 and Sizet–1. VBt–1 is a proxy for investment opportunities (as estimated
in Rhodes-Kropf et al., 2005) and is defined as the lagged value of the firm divided by lagged book value
of assets. Sales Growtht–1 is the lagged change in net sales scaled by net sales in the beginning of the year,
Leveraget–1 is defined as the lagged value of total debt (the sum of short-term and long-term debt) divided
by total assets. Tangibility (Tangt–1) is the lagged value of net property, plant and equipment over total assets.
Sizet–1 is the lagged value of natural log of sales (SALE). Firm-level fixed effects are generated by demeaning
the data for each firm for both the dependent and independent variables. Constant terms and year dummies
are not reported. Standard errors of estimates for the coefficients are presented in parentheses. Coefficients
significant at the 5% and 1% levels are indicated by * and **, respectively.
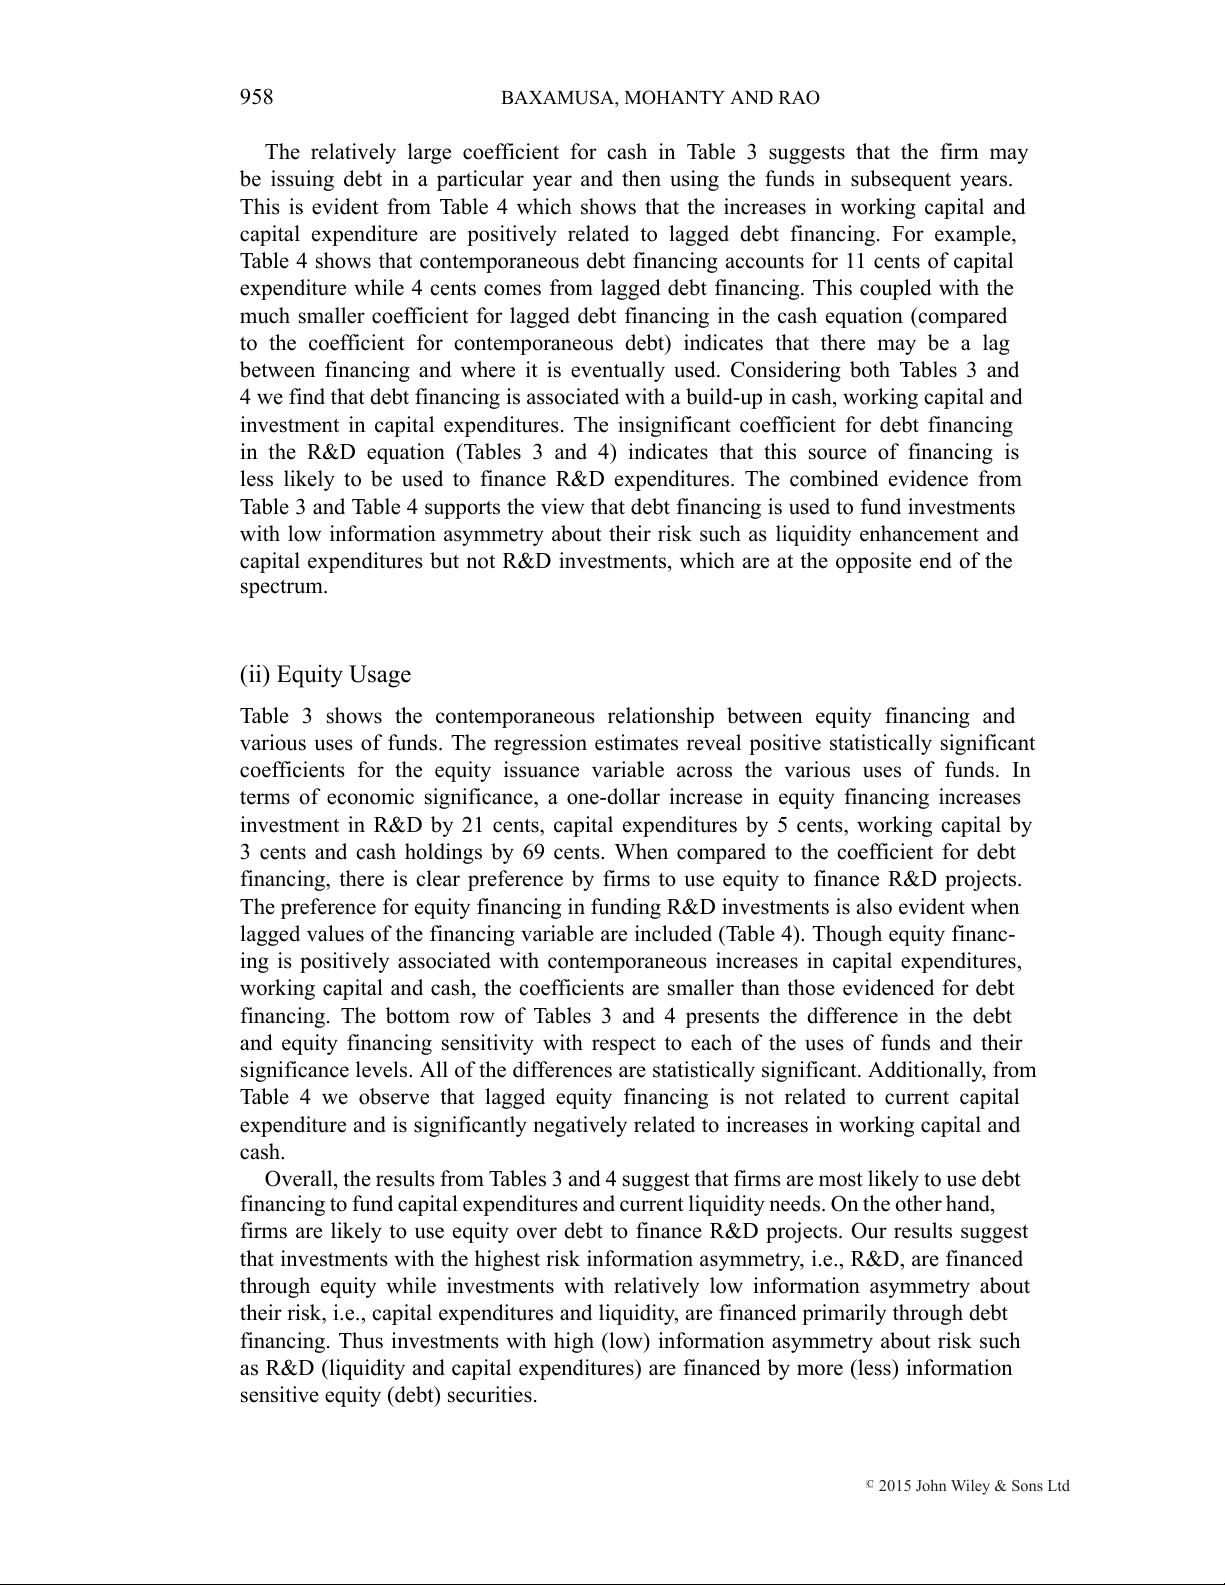
(iii) Robustness Tests for R&D
In this section we address the issue of whether our results for R&D are due to lack of
collateral associated with these projects and therefore are financed by equity regardless
of the information asymmetry of risk. R&D projects are often characterized by a lack
of hard assets (i.e., they are intangible assets) to serve as collateral. Hence, it may
appear that irrespective of underlying project risk information asymmetry the natural
choice is to fund R&D through equity financing. Our finding that equity (but not
debt) financing is associated with R&D investment may reflect the lack of collateral
rather than any presumed information asymmetry about investment risk inherent in
R&D projects. To test whether our results reflect information asymmetry or collateral
C 2015 John Wiley & Sons Ltd 960 BAXAMUSA, MOHANTY AND RAO Table 6
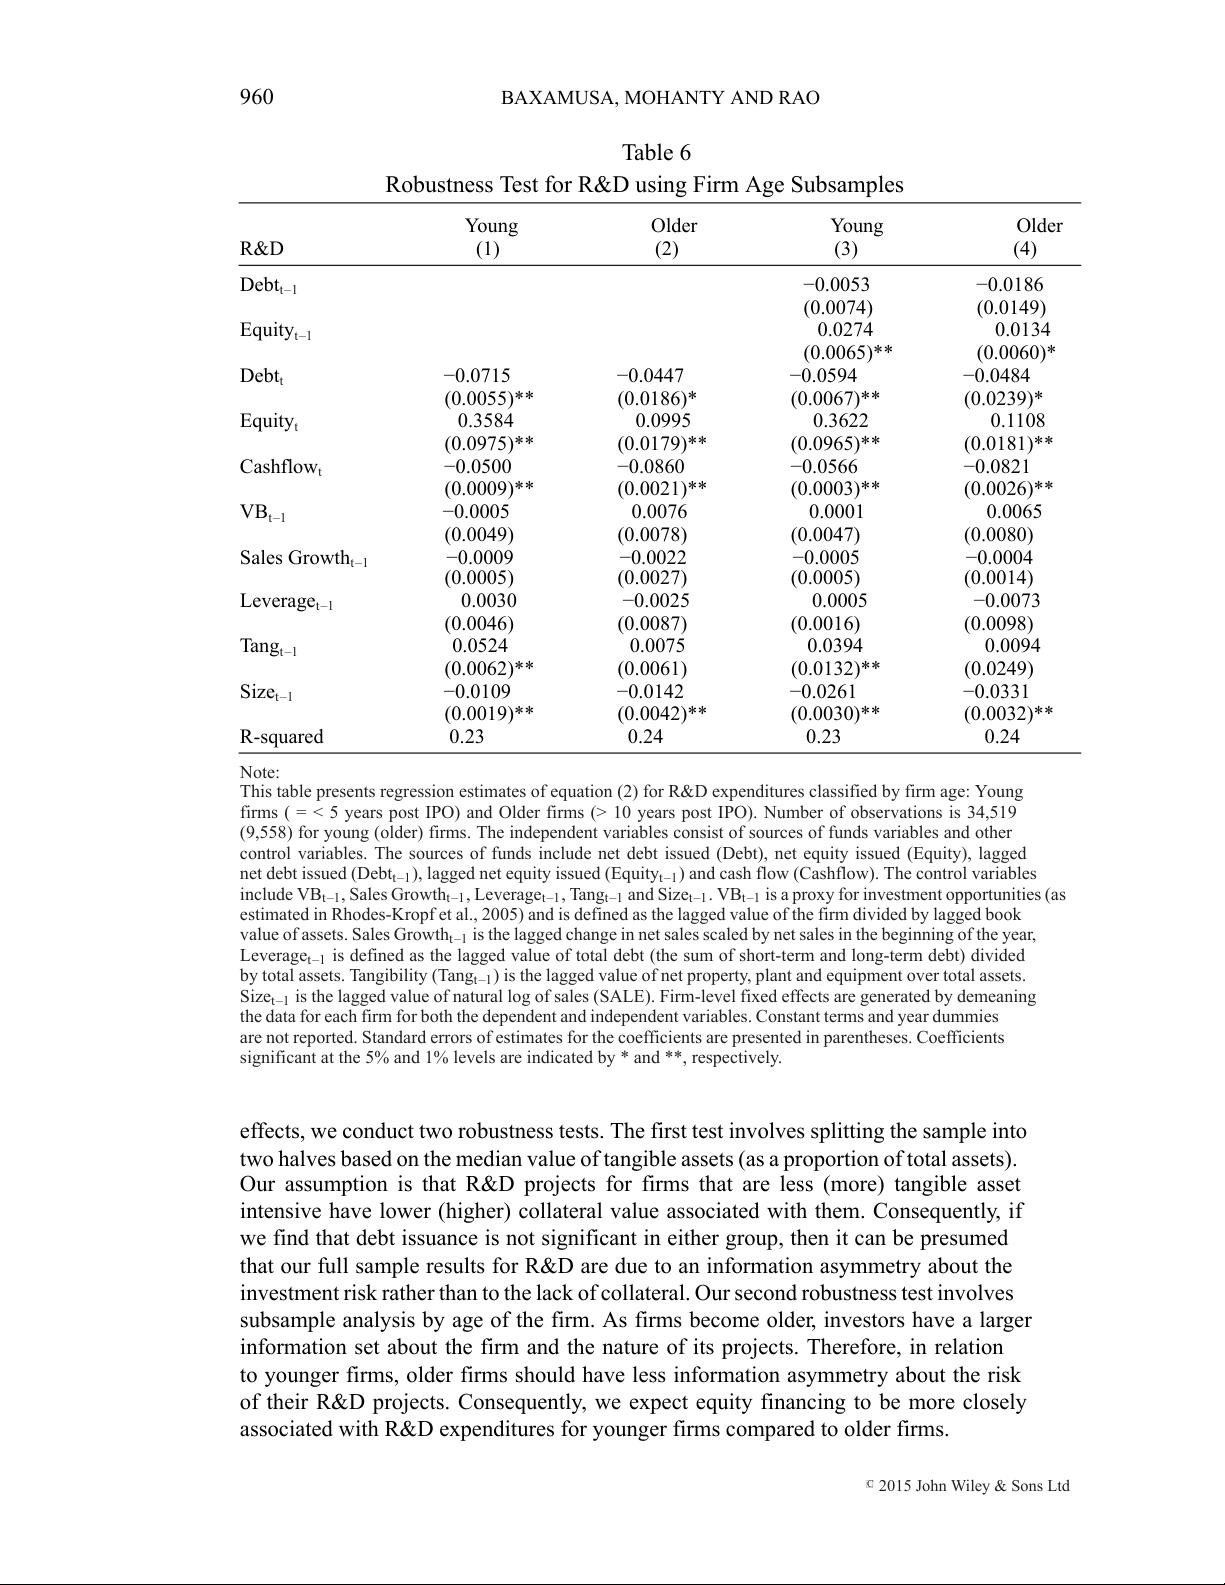
Robustness Test for R&D using Firm Age Subsamples Young Older Young Older R&D (1) (2) (3) (4) Debtt–1 −0.0053 −0.0186 (0.0074) (0.0149) Equityt–1 0.0274 0.0134 (0.0065)** (0.0060)* Debtt −0.0715 −0.0447 −0.0594 −0.0484 (0.0055)** (0.0186)* (0.0067)** (0.0239)* Equityt 0.3584 0.0995 0.3622 0.1108 (0.0975)** (0.0179)** (0.0965)** (0.0181)** Cashflowt −0.0500 −0.0860 −0.0566 −0.0821 (0.0009)** (0.0021)** (0.0003)** (0.0026)** VBt–1 −0.0005 0.0076 0.0001 0.0065 (0.0049) (0.0078) (0.0047) (0.0080) Sales Growtht–1 −0.0009 −0.0022 −0.0005 −0.0004 (0.0005) (0.0027) (0.0005) (0.0014) Leveraget–1 0.0030 −0.0025 0.0005 −0.0073 (0.0046) (0.0087) (0.0016) (0.0098) Tangt–1 0.0524 0.0075 0.0394 0.0094 (0.0062)** (0.0061) (0.0132)** (0.0249) Sizet–1 −0.0109 −0.0142 −0.0261 −0.0331 (0.0019)** (0.0042)** (0.0030)** (0.0032)** R-squared 0.23 0.24 0.23 0.24 Note:
This table presents regression estimates of equation (2) for R&D expenditures classified by firm age: Young
firms ( = < 5 years post IPO) and Older firms (> 10 years post IPO). Number of observations is 34,519
(9,558) for young (older) firms. The independent variables consist of sources of funds variables and other
control variables. The sources of funds include net debt issued (Debt), net equity issued (Equity), lagged
net debt issued (Debtt–1), lagged net equity issued (Equityt–1) and cash flow (Cashflow). The control variables
include VBt–1, Sales Growtht–1, Leveraget–1, Tangt–1 and Sizet–1. VBt–1 is a proxy for investment opportunities (as
estimated in Rhodes-Kropf et al., 2005) and is defined as the lagged value of the firm divided by lagged book
value of assets. Sales Growtht–1 is the lagged change in net sales scaled by net sales in the beginning of the year,
Leveraget–1 is defined as the lagged value of total debt (the sum of short-term and long-term debt) divided
by total assets. Tangibility (Tangt–1) is the lagged value of net property, plant and equipment over total assets.
Sizet–1 is the lagged value of natural log of sales (SALE). Firm-level fixed effects are generated by demeaning
the data for each firm for both the dependent and independent variables. Constant terms and year dummies
are not reported. Standard errors of estimates for the coefficients are presented in parentheses. Coefficients
significant at the 5% and 1% levels are indicated by * and **, respectively.
effects, we conduct two robustness tests. The first test involves splitting the sample into
two halves based on the median value of tangible assets (as a proportion of total assets).
Our assumption is that R&D projects for firms that are less (more) tangible asset
intensive have lower (higher) collateral value associated with them. Consequently, if
we find that debt issuance is not significant in either group, then it can be presumed
that our full sample results for R&D are due to an information asymmetry about the
investment risk rather than to the lack of collateral. Our second robustness test involves
subsample analysis by age of the firm. As firms become older, investors have a larger
information set about the firm and the nature of its projects. Therefore, in relation
to younger firms, older firms should have less information asymmetry about the risk
of their R&D projects. Consequently, we expect equity financing to be more closely
associated with R&D expenditures for younger firms compared to older firms.
C 2015 John Wiley & Sons Ltd
INVESTMENT RISK ASYMMETRY AND FINANCING CHOICE 961
The robustness results using the two tangible asset subgroups are presented in
Table 5. We regress R&D on current period debt and equity financing, cashflow and
other control variables (columns (1) and (2)).We also include lagged values of debt
and equity sources of funds in the regression model to account for the effects of past
financing on current use of funds in R&D investments (columns (3) and (4)). Results
reported in Table 5 show that the R&D investment–debt financing relationship is
significantly negative for firms with low tangible assets while it is insignificant for firms
with high tangible assets. On the other hand, the R&D investment–equity financing
sensitivities reported in columns (1) through (4) are positive and significant indicating
that firms, irrespective of tangible assets, fund R&D through equity. These results
suggest that firms with R&D investments inherently face greater risk information
asymmetries and higher debt contracting costs, therefore, firms are more likely to issue
equity to finance their R&D expenditures.
Table 6 presents alternative robustness results for R&D by examining subsamples
classified by firm age. We present estimates for young firms defined as those with 5 or
fewer years of post-IPO existence and older firms defined as those with more than 10
post-IPO years of existence. We observe from columns (1) and (2) that the estimated
coefficient of R&D for the contemporaneous equity financing variable is positive and
significant for young and older firms alike, but the coefficient for older firms at 0.10 is
much smaller than the 0.36 for young firms. The results are qualitatively similar when
lagged values for financing are included (columns (3) and (4)). This is consistent
with our prediction that the greater information asymmetry associated with younger
firms will yield a stronger sensitivity between equity issuance and the use of funds
for R&D purposes. In contrast, the R&D-debt financing sensitivities across the four
regression models are negative and significant, irrespective of the age of firms. These
results indicate that both young and older firms are less likely to issue debt to finance
R&D projects which are associated with higher risk of information asymmetries and
greater debt contracting costs. 5. CONCLUSIONS
We investigate the role of investment-specific information asymmetry in capital struc-
ture decisions. Recent theoretical work indicates that for projects with less information
asymmetry about their risk, e.g., increasing liquidity, the preferred choice is to issue
debt as it has low contracting costs under these conditions. On the other hand, for
projects with greater information asymmetry about their risk, e.g., R&D, the optimal
choice is to issue equity as the returns from the project’s risk accrue to the stockholders
and contracting costs of debt are very high.
Our empirical methodology utilizes the sources and uses of funds framework based
on the well-established accounting identity that the total funds used by the firm should
equal internal cash flows in addition to debt and equity raised by the firm. Our
primary test methodology involves regressing various uses of funds on the sources of
funds and other control variables, following Chang et al. (2014). The primary uses of
funds we consider are research and development (R&D), capital expenditure, working
capital changes, changes in cash holdings and cash dividends. The sources of funds
include debt and equity financing and internal cash flow, though our focus is on the
former (external capital sources). If investment risk information asymmetry is a major
C 2015 John Wiley & Sons Ltd 962 BAXAMUSA, MOHANTY AND RAO
driver of financing choice, we should find debt financing to be closely associated with
low risk information asymmetry uses (e.g., liquidity enhancement investments) while
equity financing should be more closely related with projects characterized by high
information asymmetry about their risk investments such as R&D. Consistent with our
hypothesis, we find that equity, but not debt, financing is closely associated with R&D
investments which have high information asymmetry about their risk. On the other
hand, debt financing is favored in the case of liquidity enhancement investments,
which have low information asymmetry about their risk and low agency costs of
debt. These findings are consistent with recent theoretical and empirical findings by
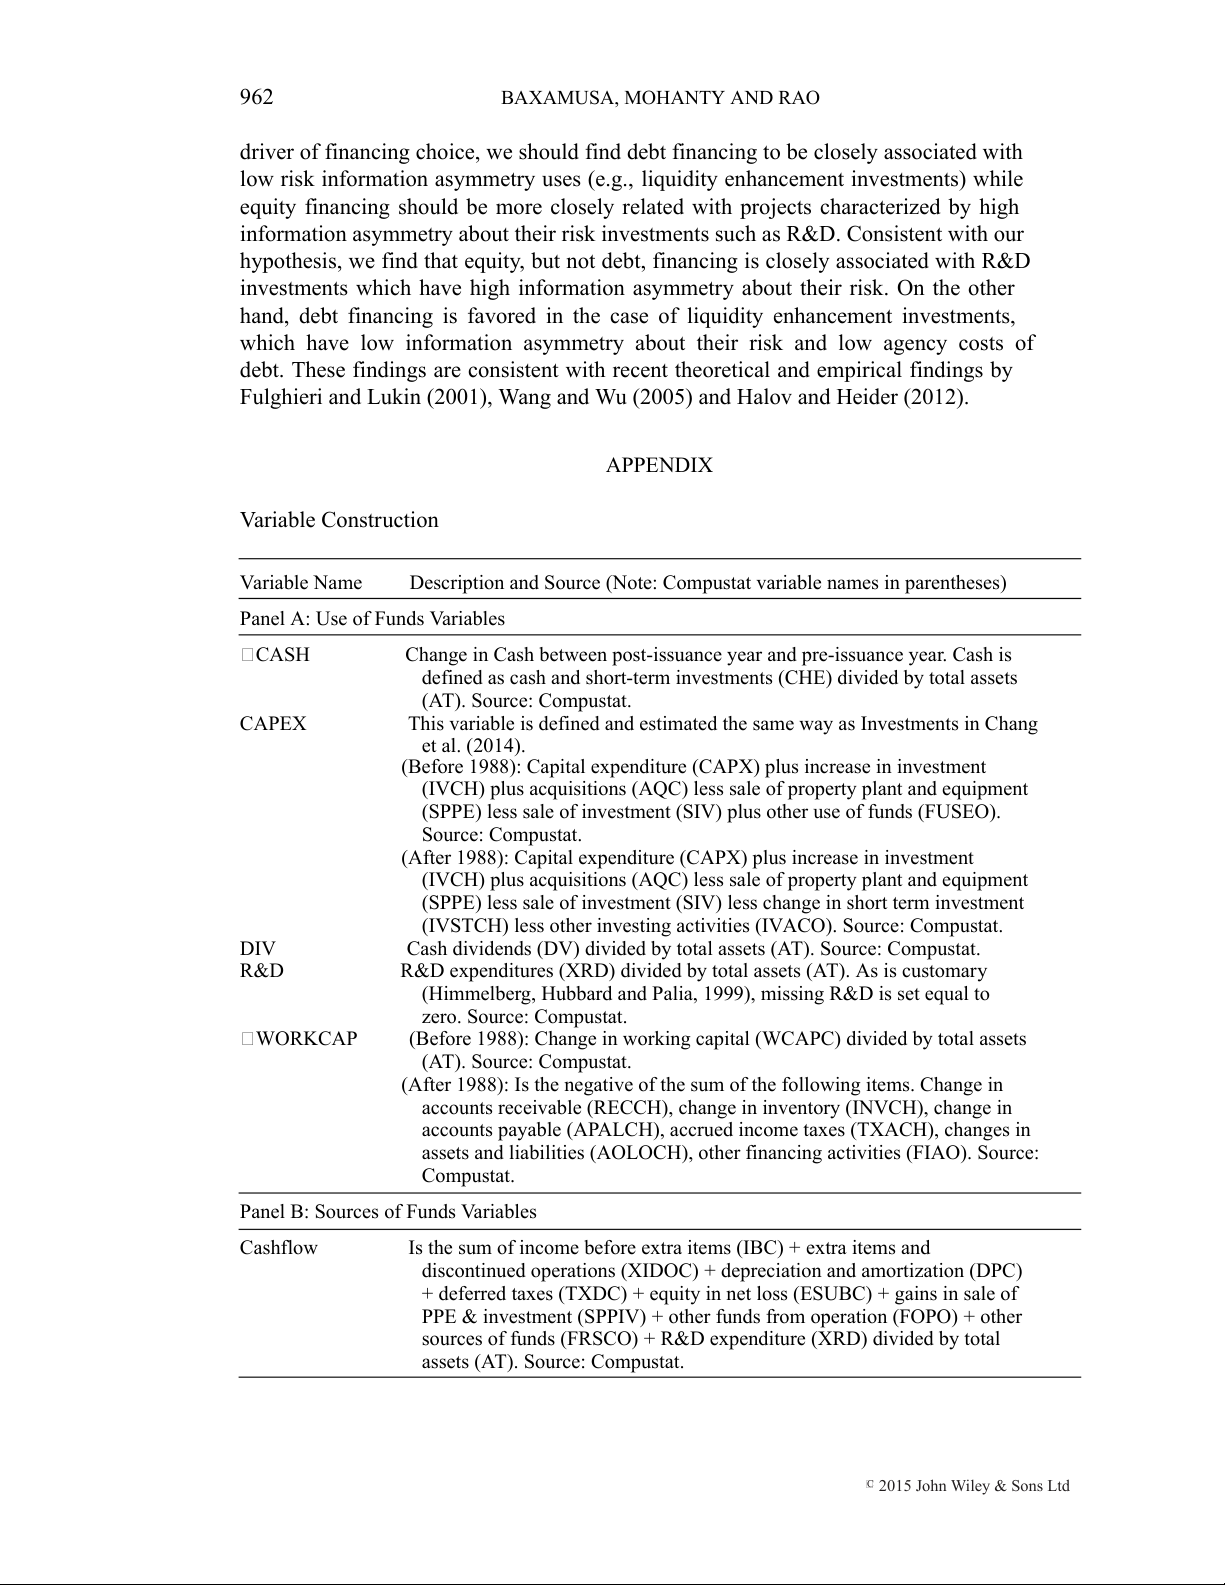
Fulghieri and Lukin (2001), Wang and Wu (2005) and Halov and Heider (2012). APPENDIX Variable Construction Variable Name
Description and Source (Note: Compustat variable names in parentheses)
Panel A: Use of Funds Variables CASH
Change in Cash between post-issuance year and pre-issuance year. Cash is
defined as cash and short-term investments (CHE) divided by total assets (AT). Source: Compustat. CAPEX
This variable is defined and estimated the same way as Investments in Chang et al. (2014).
(Before 1988): Capital expenditure (CAPX) plus increase in investment
(IVCH) plus acquisitions (AQC) less sale of property plant and equipment
(SPPE) less sale of investment (SIV) plus other use of funds (FUSEO). Source: Compustat.
(After 1988): Capital expenditure (CAPX) plus increase in investment
(IVCH) plus acquisitions (AQC) less sale of property plant and equipment
(SPPE) less sale of investment (SIV) less change in short term investment
(IVSTCH) less other investing activities (IVACO). Source: Compustat. DIV
Cash dividends (DV) divided by total assets (AT). Source: Compustat. R&D
R&D expenditures (XRD) divided by total assets (AT). As is customary
(Himmelberg, Hubbard and Palia, 1999), missing R&D is set equal to zero. Source: Compustat. WORKCAP
(Before 1988): Change in working capital (WCAPC) divided by total assets (AT). Source: Compustat.
(After 1988): Is the negative of the sum of the following items. Change in
accounts receivable (RECCH), change in inventory (INVCH), change in
accounts payable (APALCH), accrued income taxes (TXACH), changes in
assets and liabilities (AOLOCH), other financing activities (FIAO). Source: Compustat.
Panel B: Sources of Funds Variables Cashflow
Is the sum of income before extra items (IBC) + extra items and
discontinued operations (XIDOC) + depreciation and amortization (DPC)
+ deferred taxes (TXDC) + equity in net loss (ESUBC) + gains in sale of
PPE & investment (SPPIV) + other funds from operation (FOPO) + other
sources of funds (FRSCO) + R&D expenditure (XRD) divided by total
assets (AT). Source: Compustat.
C 2015 John Wiley & Sons Ltd
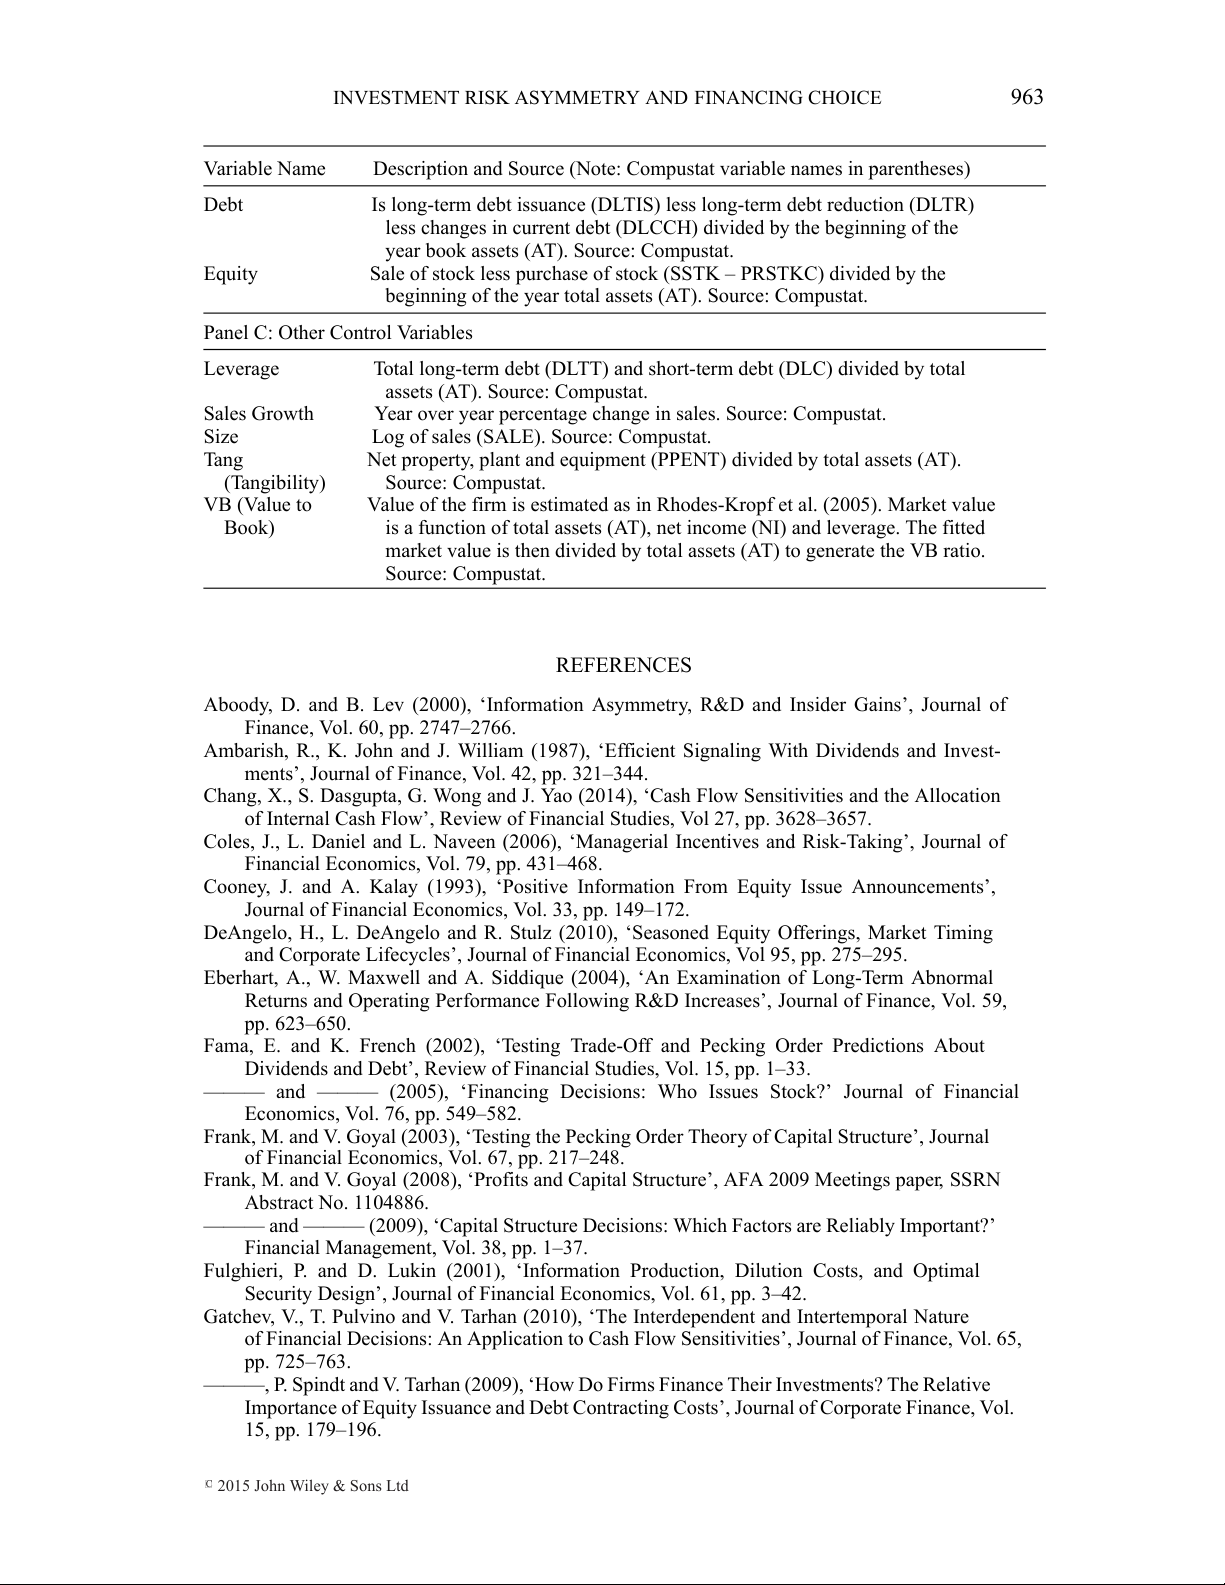
INVESTMENT RISK ASYMMETRY AND FINANCING CHOICE 963 Variable Name
Description and Source (Note: Compustat variable names in parentheses) Debt
Is long-term debt issuance (DLTIS) less long-term debt reduction (DLTR)
less changes in current debt (DLCCH) divided by the beginning of the
year book assets (AT). Source: Compustat. Equity
Sale of stock less purchase of stock (SSTK – PRSTKC) divided by the
beginning of the year total assets (AT). Source: Compustat.
Panel C: Other Control Variables Leverage
Total long-term debt (DLTT) and short-term debt (DLC) divided by total
assets (AT). Source: Compustat. Sales Growth
Year over year percentage change in sales. Source: Compustat. Size
Log of sales (SALE). Source: Compustat. Tang
Net property, plant and equipment (PPENT) divided by total assets (AT). (Tangibility) Source: Compustat. VB (Value to
Value of the firm is estimated as in Rhodes-Kropf et al. (2005). Market value Book)
is a function of total assets (AT), net income (NI) and leverage. The fitted
market value is then divided by total assets (AT) to generate the VB ratio. Source: Compustat. REFERENCES
Aboody, D. and B. Lev (2000), ‘Information Asymmetry, R&D and Insider Gains’, Journal of
Finance, Vol. 60, pp. 2747–2766.
Ambarish, R., K. John and J. William (1987), ‘Efficient Signaling With Dividends and Invest-
ments’, Journal of Finance, Vol. 42, pp. 321–344.
Chang, X., S. Dasgupta, G. Wong and J. Yao (2014), ‘Cash Flow Sensitivities and the Allocation
of Internal Cash Flow’, Review of Financial Studies, Vol 27, pp. 3628–3657.
Coles, J., L. Daniel and L. Naveen (2006), ‘Managerial Incentives and Risk-Taking’, Journal of
Financial Economics, Vol. 79, pp. 431–468.
Cooney, J. and A. Kalay (1993), ‘Positive Information From Equity Issue Announcements’,
Journal of Financial Economics, Vol. 33, pp. 149–172.
DeAngelo, H., L. DeAngelo and R. Stulz (2010), ‘Seasoned Equity Offerings, Market Timing
and Corporate Lifecycles’, Journal of Financial Economics, Vol 95, pp. 275–295.
Eberhart, A., W. Maxwell and A. Siddique (2004), ‘An Examination of Long-Term Abnormal
Returns and Operating Performance Following R&D Increases’, Journal of Finance, Vol. 59, pp. 623–650.
Fama, E. and K. French (2002), ‘Testing Trade-Off and Pecking Order Predictions About
Dividends and Debt’, Review of Financial Studies, Vol. 15, pp. 1–33.
——— and ——— (2005), ‘Financing Decisions: Who Issues Stock?’ Journal of Financial
Economics, Vol. 76, pp. 549–582.
Frank, M. and V. Goyal (2003), ‘Testing the Pecking Order Theory of Capital Structure’, Journal
of Financial Economics, Vol. 67, pp. 217–248.
Frank, M. and V. Goyal (2008), ‘Profits and Capital Structure’, AFA 2009 Meetings paper, SSRN Abstract No. 1104886.
——— and ——— (2009), ‘Capital Structure Decisions: Which Factors are Reliably Important?’
Financial Management, Vol. 38, pp. 1–37.
Fulghieri, P. and D. Lukin (2001), ‘Information Production, Dilution Costs, and Optimal
Security Design’, Journal of Financial Economics, Vol. 61, pp. 3–42.
Gatchev, V., T. Pulvino and V. Tarhan (2010), ‘The Interdependent and Intertemporal Nature
of Financial Decisions: An Application to Cash Flow Sensitivities’, Journal of Finance, Vol. 65, pp. 725–763.
———, P. Spindt and V. Tarhan (2009), ‘How Do Firms Finance Their Investments? The Relative
Importance of Equity Issuance and Debt Contracting Costs’, Journal of Corporate Finance, Vol. 15, pp. 179–196.
C 2015 John Wiley & Sons Ltd 964 BAXAMUSA, MOHANTY AND RAO
Graham, J. and C. Harvey (2001), ‘The Theory and Practice of Corporate Finance: Evidence
from the Field’, Journal of Financial Economics, Vol. 60, pp. 187–243.
Halov N. and F. Heider (2012), ‘Capital Structure with Asymmetric Information about Value
and Risk: Theory and Empirical Analysis’, Quarterly Journal of Finance, forthcoming.
———, ——— and K. John (2011), ‘Capital Structure and Volatility of Risk’, NYU working
paper, presented at 2011 Financial Management Association Annual meeting.
Himmelberg, C., G. Hubbard and D. Palia (1999), ‘Understanding the Determinants of
Managerial Ownership and the Link Between Ownership and Performance’, Journal of
Financial Economics, Vol. 53, pp. 353–384.
Kim, W. and M. Weisbach (2008), ‘Motivations for Public Equity Offers: An International
Perspective’, Journal of Financial Economics, Vol. 87, pp. 281–307.
Kothari, S., T. Laguerre and J. Leone (2002), ‘Capitalization versus Expensing: Evidence on the
Uncertainty of Future Earnings from Capital Expenditures Versus R&D Outlays’, Review of
Accounting Studies, Vol. 7, pp. 355–382.
Leary, M. and M. Roberts (2010), ‘The Pecking Order, Debt Capacity, and Information
Asymmetry’, Journal of Financial Economics, Vol. 95, pp. 332–355.
Lemmon, M. and J. Zender (2010), ‘Debt Capacity and Tests of Capital Structure Theories’,
Journal of Financial and Quantitative Analysis, Vol. 45, pp. 1161–1187.
Myers, S. and N. Majluf (1984), ‘Corporate Financing and Investment Decisions when the Firms
Have Information that the Investors Do Not Have’, Journal of Financial Economics, Vol. 13, pp. 187–221.
Neamtiu, M., N. Shroff, H. White and D. Williams (2014), ‘The Impact of Ambiguity on
Managerial Investment and Cash Holdings’, Journal of Business Finance & Accounting, Vol. 41, pp. 1071–1099.
Rajan, R. and L. Zingales (1995), ‘What Do We Know about Capital Structure: Some Evidence
from International Data’, Journal of Finance, Vol. 50, pp. 1421–1460.
Rhodes-Kropf, M., D. Robinson and S. Vishwanathan (2005), ‘Valuation Waves and Merger
Activity: The Empirical Evidence’, Journal of Financial Economics, Vol. 77, pp. 561–603.
Shyam-Sunder, L. and S. Myers (1999), ‘Testing Static Tradeoff against Pecking Order Models
of Capital Structure’, Journal of Financial Economics, Vol. 51, pp. 219–244.
Wu, X. and Z. Wang (2005), ‘Equity Financing in a Myers–Majluf Framework with Private
Benefits of Control’, Journal of Corporate Finance, Vol. 11, pp. 915–945.
C 2015 John Wiley & Sons Ltd
Tài liệu liên quan:
-

Đề cương Ôn tập Thống kê cho Khoa học xã hội cuối kỳ | Thống kê cho khoa học xã hội | Trường Đại học Khoa học Tự nhiên, Đại học Quốc gia Hà Nội
406 203 -
Tài liệu Nguyên Tắc Thống Kê Khoa Học Xã Hội | Thống kê cho khoa học xã hội | Trường Đại học Khoa học Tự nhiên, Đại học Quốc gia Hà Nội
287 144 -

Bài Thi Kết Thúc Học Phần | Thống kê cho khoa học xã hội | Trường Đại học Khoa học Tự nhiên, Đại học Quốc gia Hà Nội
386 193 -

Lợi Ích Kinh Tế & Vai Trò Nhà Nước Trong Quy Trình Phát Triển | Thống kê cho khoa học xã hội | Trường Đại học Khoa học Tự nhiên, Đại học Quốc gia Hà Nội
136 68 -

Tác động của Biến Đổi Khí Hậu đến Sức Khỏe Con Người | Thống kê cho khoa học xã hội | Trường Đại học Khoa học Tự nhiên, Đại học Quốc gia Hà Nội
104 52