Winter Term 1999 Midterm Exam | Microeconomics | Trường Đại học Quốc tế, Đại học Quốc gia Thành phố Hồ Chí Minh
For each of the following transactions and events, indicate whether or not it contributed to one or more of the U.S. macroeconomic variables C, I, G, X, or IM, and if so, which one or ones. Record your answer(s) by writing either “none” or x=±yyy in the space provided, where x=C,I,G,X,or IM and yyy is the dollar amount. Assume that all take place in the same year. Tài liệu được sưu tầm và soạn thảo dưới dạng file PDF để gửi tới các bạn cùng tham khảo, ôn tập đầy đủ kiến thức, chuẩn bị cho các buổi học thật tốt. Mời bạn đọc đón xem!
Môn: Microeconomics 640 tài liệu
Trường: Trường Đại học Quốc tế, Đại học Quốc gia Thành phố Hồ Chí Minh 2 K tài liệu
Tác giả:

Preview text:
SPP/Econ 556 Alan Deardorff Winter Term 1999 Midterm #1 (with Answers) Page 1 of 11 Name: Student No.: SPP/Econ 556 Macroeconomics Midterm Exam No. 1 - Answers February 17, 1999
Answer all questions, on these sheets in the spaces or blanks provided. In questions where
it is appropriate, show your work, if you want partial credit for an incorrect answer.
Point values of the questions are shown; there are a total of 94 points possible. 1. (20 points)
a. For each of the following transactions and events, indicate whether or not it
contributed to one or more of the U.S. macroeconomic variables C, I, G, X, or
IM, and if so, which one or ones. Record your answer(s) by writing either “none”
or x=±yyy in the space provided, where x=C,I,G,X,or IM and yyy is the dollar
amount. Assume that all take place in the same year.
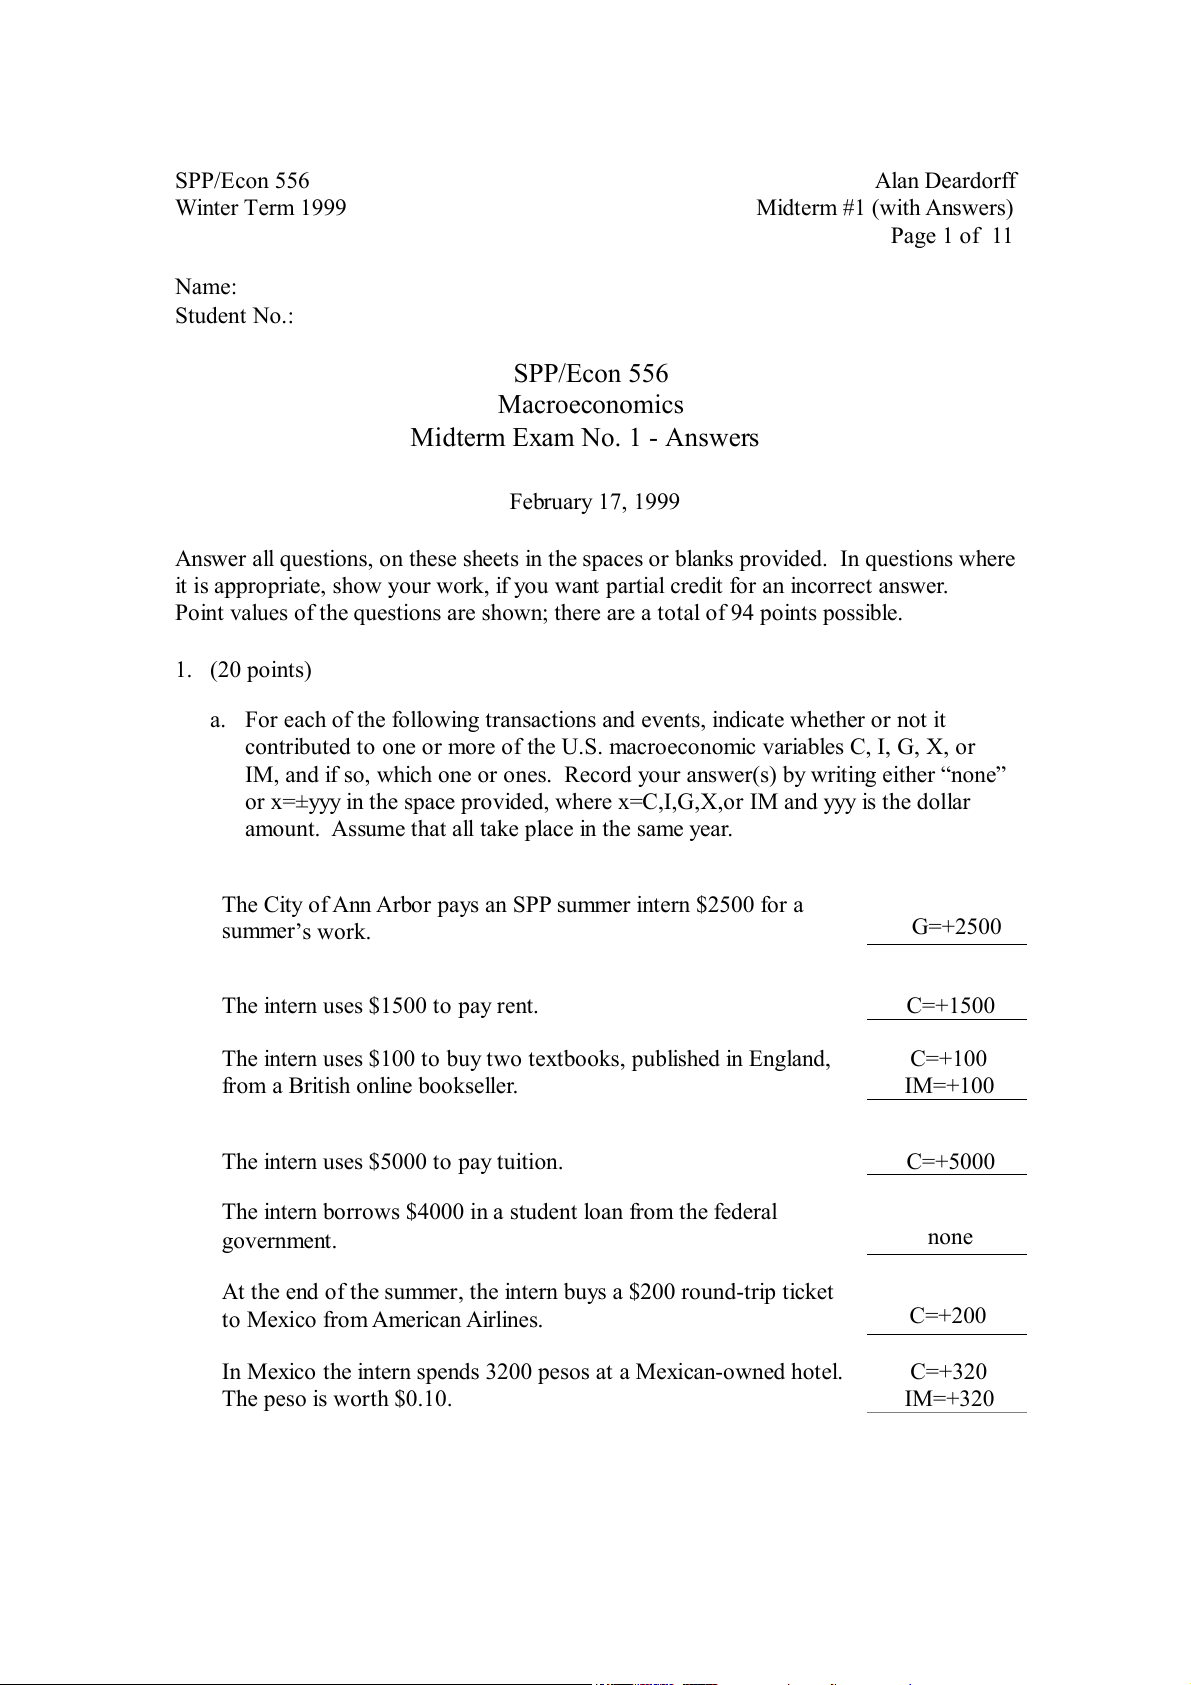
The City of Ann Arbor pays an SPP summer intern $2500 for a summer ’s work. G=+2500
The intern uses $1500 to pay rent. C=+1500
The intern uses $100 to buy two textbooks, published in England, C=+100
from a British online bookseller. IM=+100
The intern uses $5000 to pay tui tion. C=+5000
The intern borrows $4000 in a student loan from the federal government . none
At the end of the summer, the intern buys a $200 round-trip ticket
to Mexico from American Airlines. C=+200
In Mexico the intern spends 3200 pesos at a Mexican-owned hotel. C=+320 The peso is worth $0.10. IM=+320 SPP/Econ 556 Alan Deardorff Winter Term 1999 Midterm #1 (with Answers) Page 2 of 11
Meanwhile, back in Ann Arbor, the intern s ’ landlord spends $7600 repairing the intern s apartm ’
ent, damaged by fire when the intern
left the coffeemaker on during the trip to Mexico. I=7600
b. Calculate the total contribution of the above transactions to U.S. Gross Domestic Product.
Ans: ? Y = ? C + ? I + ? G + ? X ? IM
= (1500+100+5000+200+320) + (7600) + (2500) + (0) (100+320)
= (7120) + (7600) + (2500) + (0) (420) = $16,800
c. By how much would U.S. GDP have been different if the intern had chosen not
to take a vacation and had instead spent the time in the apartment watching the coffeemaker?
Ans: If the intern had stayed home, the last three transactions would not have
occurred. GDP would be smaller by $200 (the cost of the plane ticket)
plus $7600 (the cost of repairs, since the fire would not have happened,
for a total of $7800. The hotel expense would also not have occurred, but
it does not contribute to U.S. GDP. SPP/Econ 556 Alan Deardorff Winter Term 1999 Midterm #1 (with Answers) Page 3 of 11
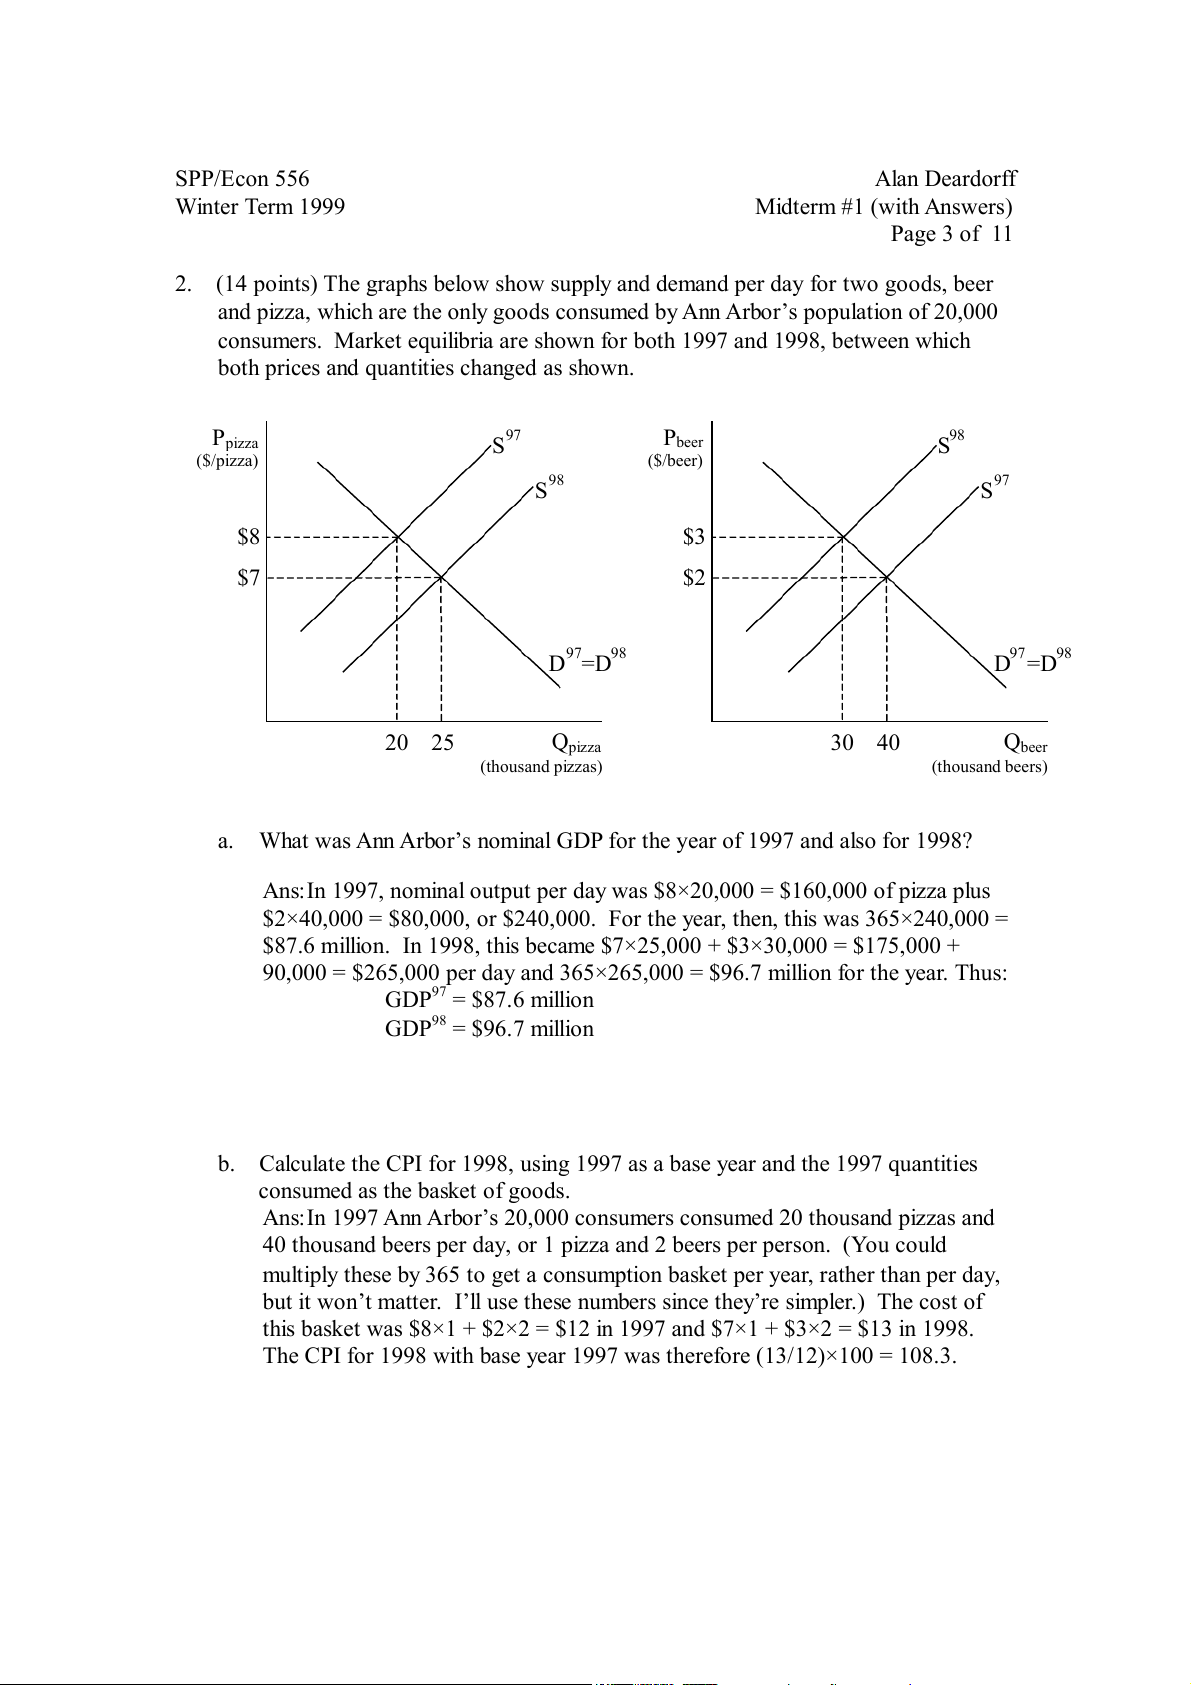
2. (14 points) The graphs below show supply and demand f per day or two goods, beer
and pizza, which are the only goods consumed by Ann Arbor s po ’ pulation of 20,000
consumers. Market equilibria are shown for both 1997 and 1998, between which
both prices and quantities changed as shown. Ppizza S97 Pbeer S98 ($/pizza) ($/beer) S98 S97 $8 $3 $7 $2 D97=D98 D97=D98 20 25 Qpizza 30 40 Qbeer (thousand pizzas) (thousand beers) a. What was Ann Arbor s ’ nominal GDP for the of 1997 and al year so for 1998?
Ans:In 1997, nominal output per day was $8×20,000 = $160,000 of pizza plus
$2×40,000 = $80,000, or $240,000. For the year, then, this was 365×240,000 =
$87.6 million. In 1998, this became $7×25,000 + $3×30,000 = $175,000 +
90,000 = $265,000 per day and 365×265,000 = $96.7 million for the year. Thus: GDP97 = $87.6 million GDP98 = $96.7 million
b. Calculate the CPI for 1998, using 1997 as a base year and the 1997 quantities
consumed as the basket of goods. Ans:In 1997 Ann Arbor s 20, ’
000 consumers consumed 20 thousand pizzas and
40 thousand beers per day, or 1 pizza and 2 beers per person. (You could
multiply these by 365 to get a consumption basket per year, rather than per day, but it won t m ’ atter. I l
’ l use these numbers since they ’re simpler.) The cost of
this basket was $8×1 + $2×2 = $12 in 1997 and $7×1 + $3×2 = $13 in 1998.
The CPI for 1998 with base year 1997 was therefore (13/12)×100 = 108.3. SPP/Econ 556 Alan Deardorff Winter Term 1999 Midterm #1 (with Answers) Page 4 of 11
c. Calculate the Ann Arbor GDP deflator for 1998 using 1997 as base year,
assuming that beer and pizza were the only things produced in Ann Arbor during these years.
Ans:Real GDP in 1998 at 1997 prices is $8×25,000 + $2×30,000 = $260,000 per
day, or 365×260,000 = $94.9 million. The GDP deflator for 1998, from the ratio
of nominal GDP to this, is (96.7/94.9)×100 = 101.9
d. How do the rates of inflation from 1997 to 1998 compare when measured by
these two different means? Why do they differ in this way?
Ans:The rate of inflation from the CPI is 8.3%, much greater than the rate of
inflation from the Deflator, 1.9%. The reason is that the CPI, by using quantities
from before the price changes, has assigned much greater weights to the good
whose price has risen (beer) and less weight to the good whose price has fallen
(pizza) than the Deflator. The CPI therefore fails to account for the ability of
consumers to substitute away from goods whose prices are rising and toward
goods whose prices are falling. This is caused substitution bias. SPP/Econ 556 Alan Deardorff Winter Term 1999 Midterm #1 (with Answers) Page 5 of 11 e. Suppose that the “true ” rat
e of inflation were taken to be simply halfway between
(i.e., the arithmetic average of) the two rates gotten from the CPI and the GDP
Deflator. In this example, how would the error from using only the CPI as the
official rate of inflation compare to error that was found by the Boskin
Commission to be present in the United States CPI? Would Dean Baker, who
criticized the Commission findings, believe that the example here is more correct
or less correct than the Boskin Commission findings?
Ans:The average of the two rates of inflation is (8.3+1.9)/2 = 5.1%. Taking this
as the true rate, the rate from the CPI alone overstates the rate of inflation by
8.3-5.1 = 3.2%. This is about three times larger than the 1.1% bias that the
Boskin Commission found to be present in the rate of inflation measured by the
United States CPI. Since Baker objected to the Boskin Commission findings as
overstating the upward bias in the CPI, which Baker argues instead may even
understate the rate of inflation, Baker would presumably believe this example even less.
f. Name and briefly explain one source of error in the real-world CPI that is not included in the example here. Ans:
In addition to substitution bias, which is illustrated by this example, the
CPI also is argued to include biases for the following reasons: New go
ods: The CPI excludes new goods, which provide new consumer
benefits and also tend to fall in price after introduction. Quality improvement:
In most cases the CPI ignores the improvements
in quality of goods that mean that consumers are getting more for the prices that they pay.
Retail outlet substitution: By taking price measurements always at the same
sellers, the CPI misses consumers ’ ab
ility to shop around and get lower prices. SPP/Econ 556 Alan Deardorff Winter Term 1999 Midterm #1 (with Answers) Page 6 of 11 3. (14 points)
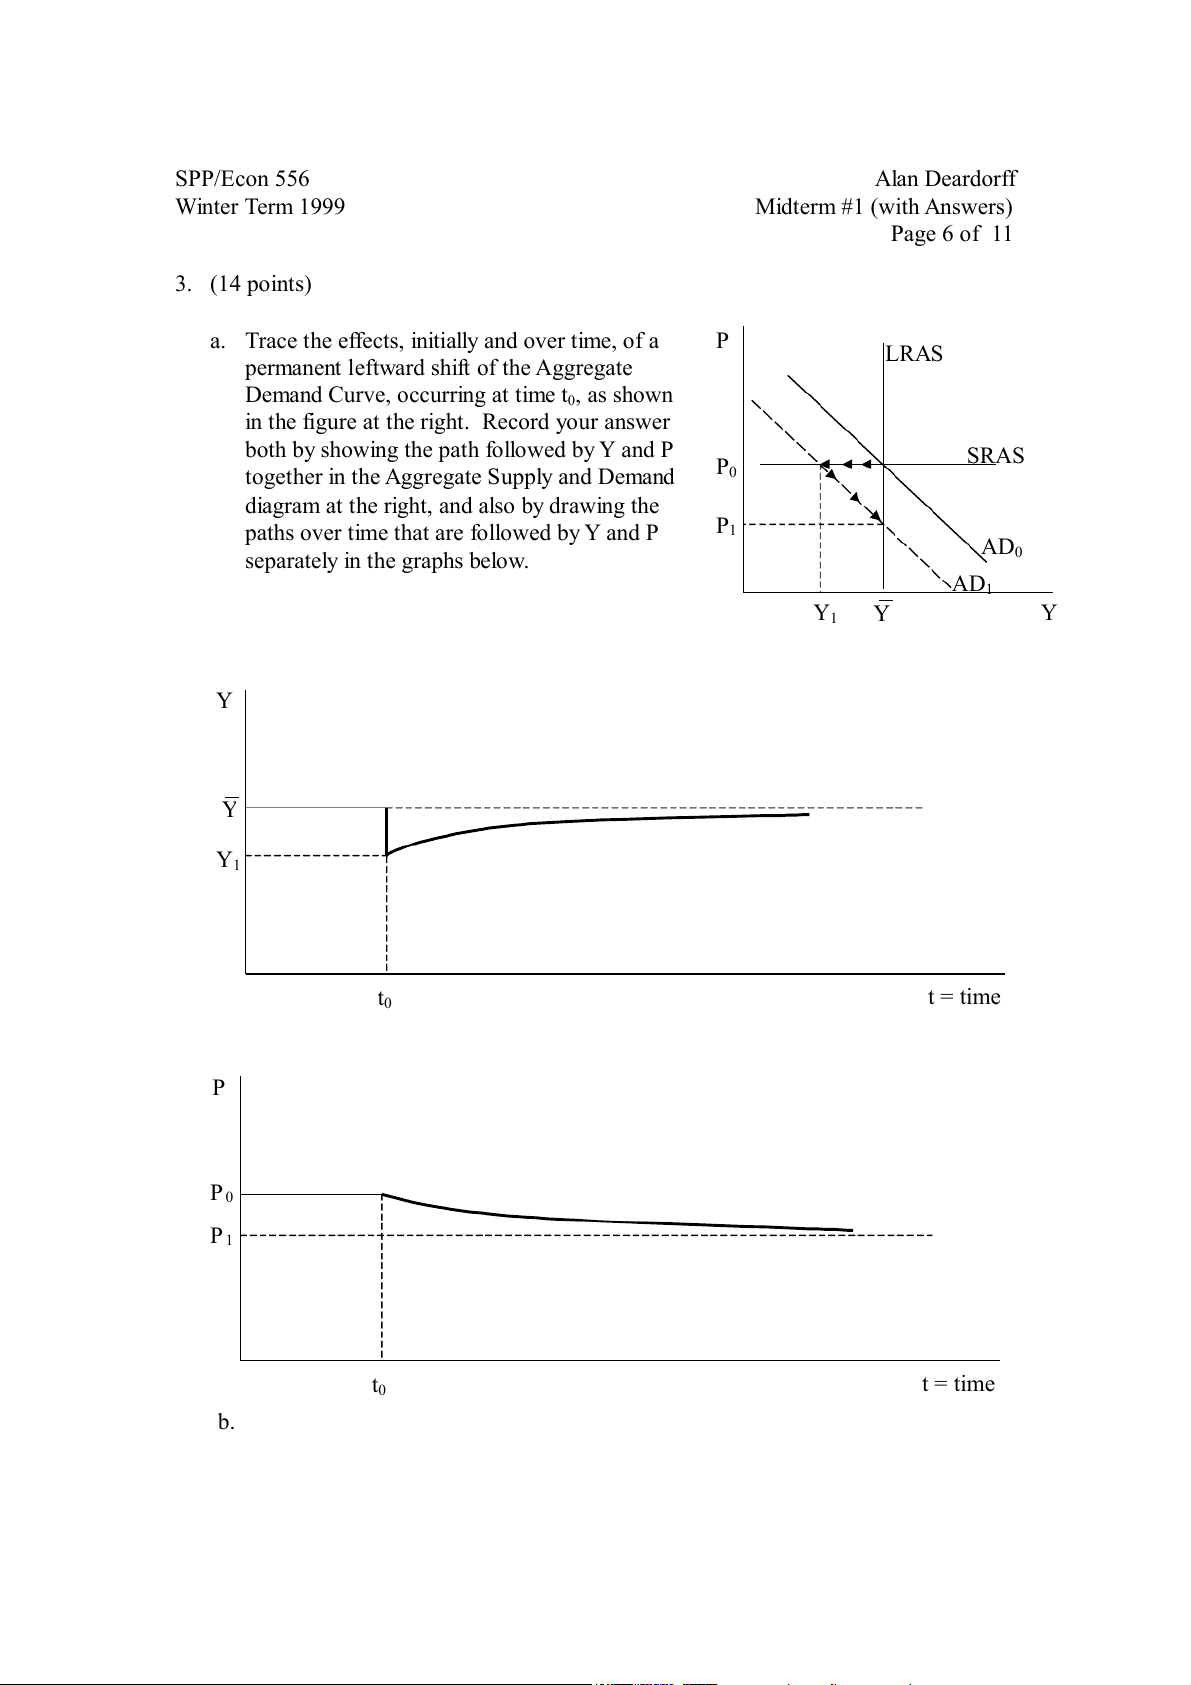
a. Trace the effects, initially and over time, of a P LRAS
permanent leftward shift of the Aggregate
Demand Curve, occurring at time t0, as shown
in the figure at the right. Record your answer
both by showing the path followed by Y and P SRAS
together in the Aggregate Supply and Demand P0
diagram at the right, and also by drawing the
paths over time that are followed by Y and P P1 AD
separately in the graphs below. 0 AD1 Y1 Y Y Y Y Y1 t0 t = time P P0 P1 t0 t = time b. SPP/Econ 556 Alan Deardorff Winter Term 1999 Midterm #1 (with Answers) Page 7 of 11
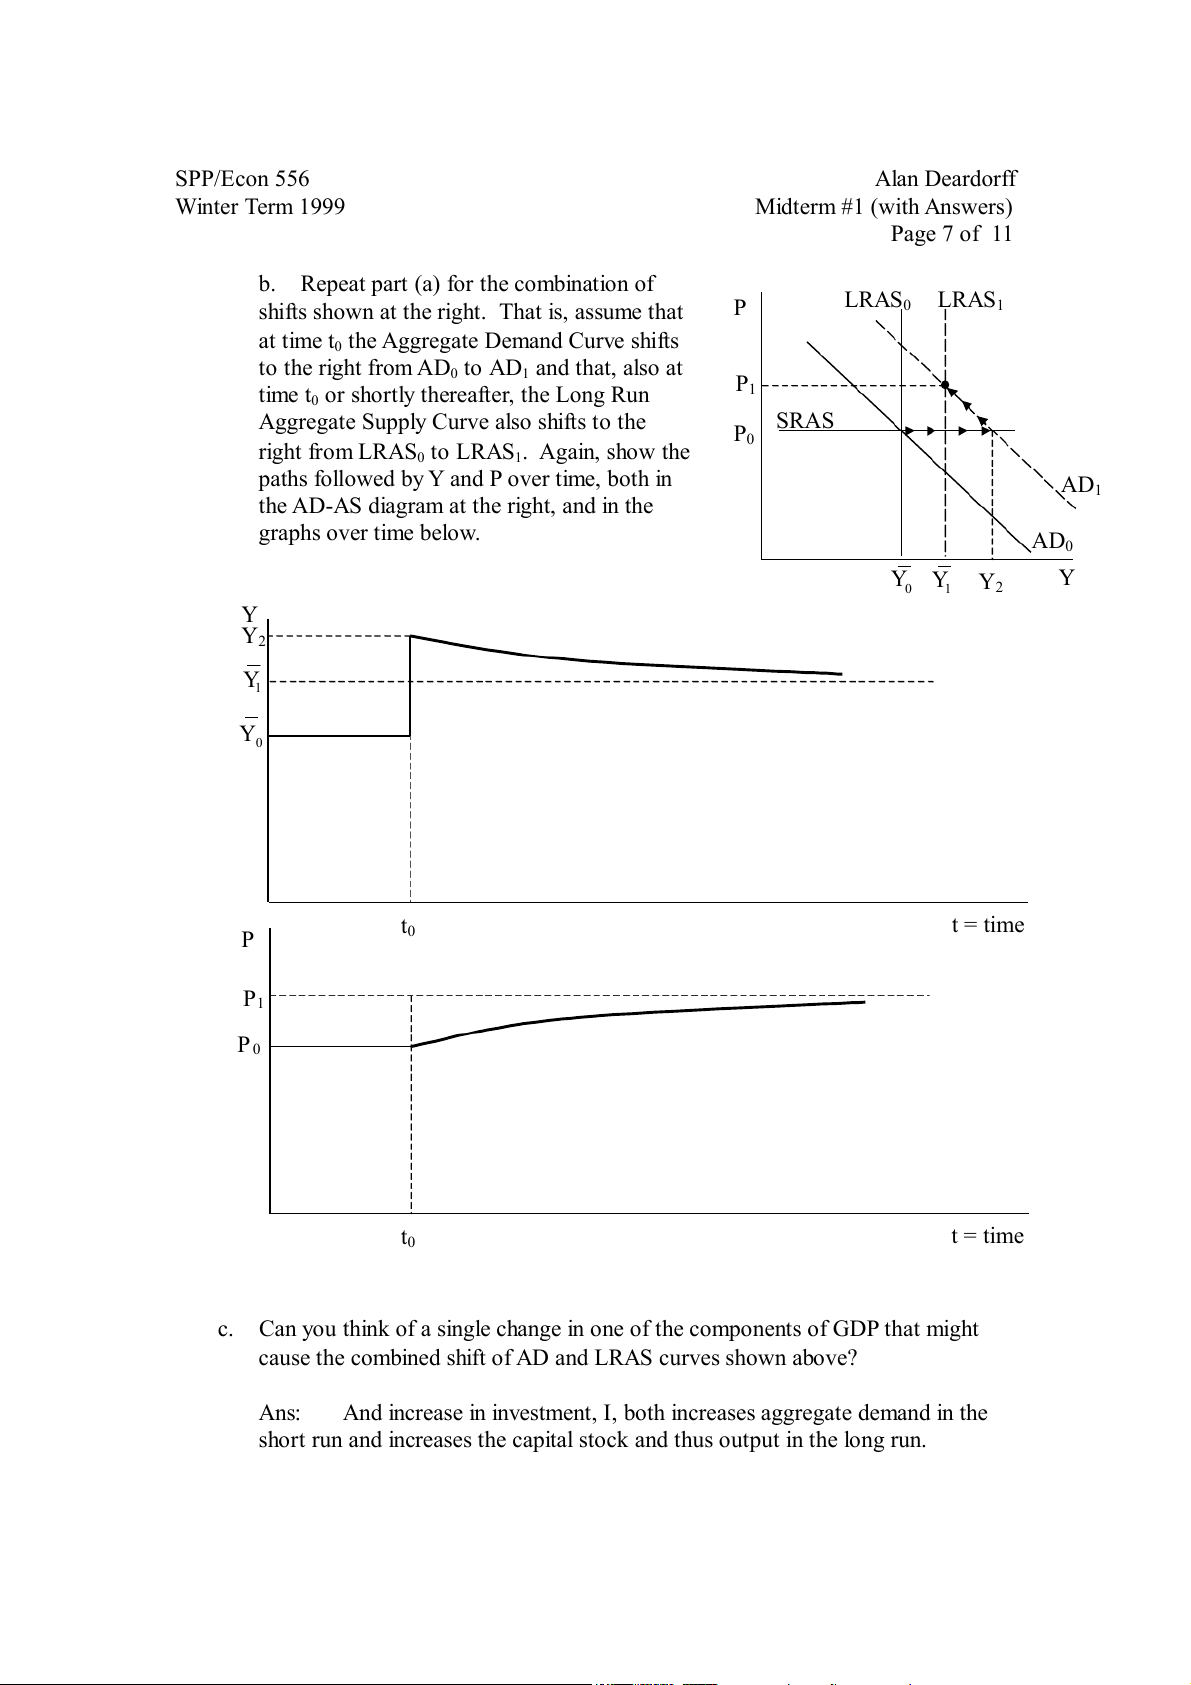
b. Repeat part (a) for the combination of
shifts shown at the right. That is, assume that LRAS0 P LRAS1
at time t0 the Aggregate Demand Curve shifts
to the right from AD0 to AD1 and that, also at time t P1
0 or shortly thereafter, the Long Run
Aggregate Supply Curve also shifts to the SRAS P right from LRAS 0 0 to LRAS1. Again, show the
paths followed by Y and P over time, both in AD1
the AD-AS diagram at the right, and in the graphs over time below. AD0 Y Y1 Y Y 0 2 Y Y2 Y1 Y0 t0 t = time P P1 P0 t0 t = time
c. Can you think of a single change in one of the components of GDP that might
cause the combined shift of AD and LRAS curves shown above? Ans:
And increase in investment, I, both increases aggregate demand in the
short run and increases the capital stock and thus output in the long run. SPP/Econ 556 Alan Deardorff Winter Term 1999 Midterm #1 (with Answers) Page 8 of 11
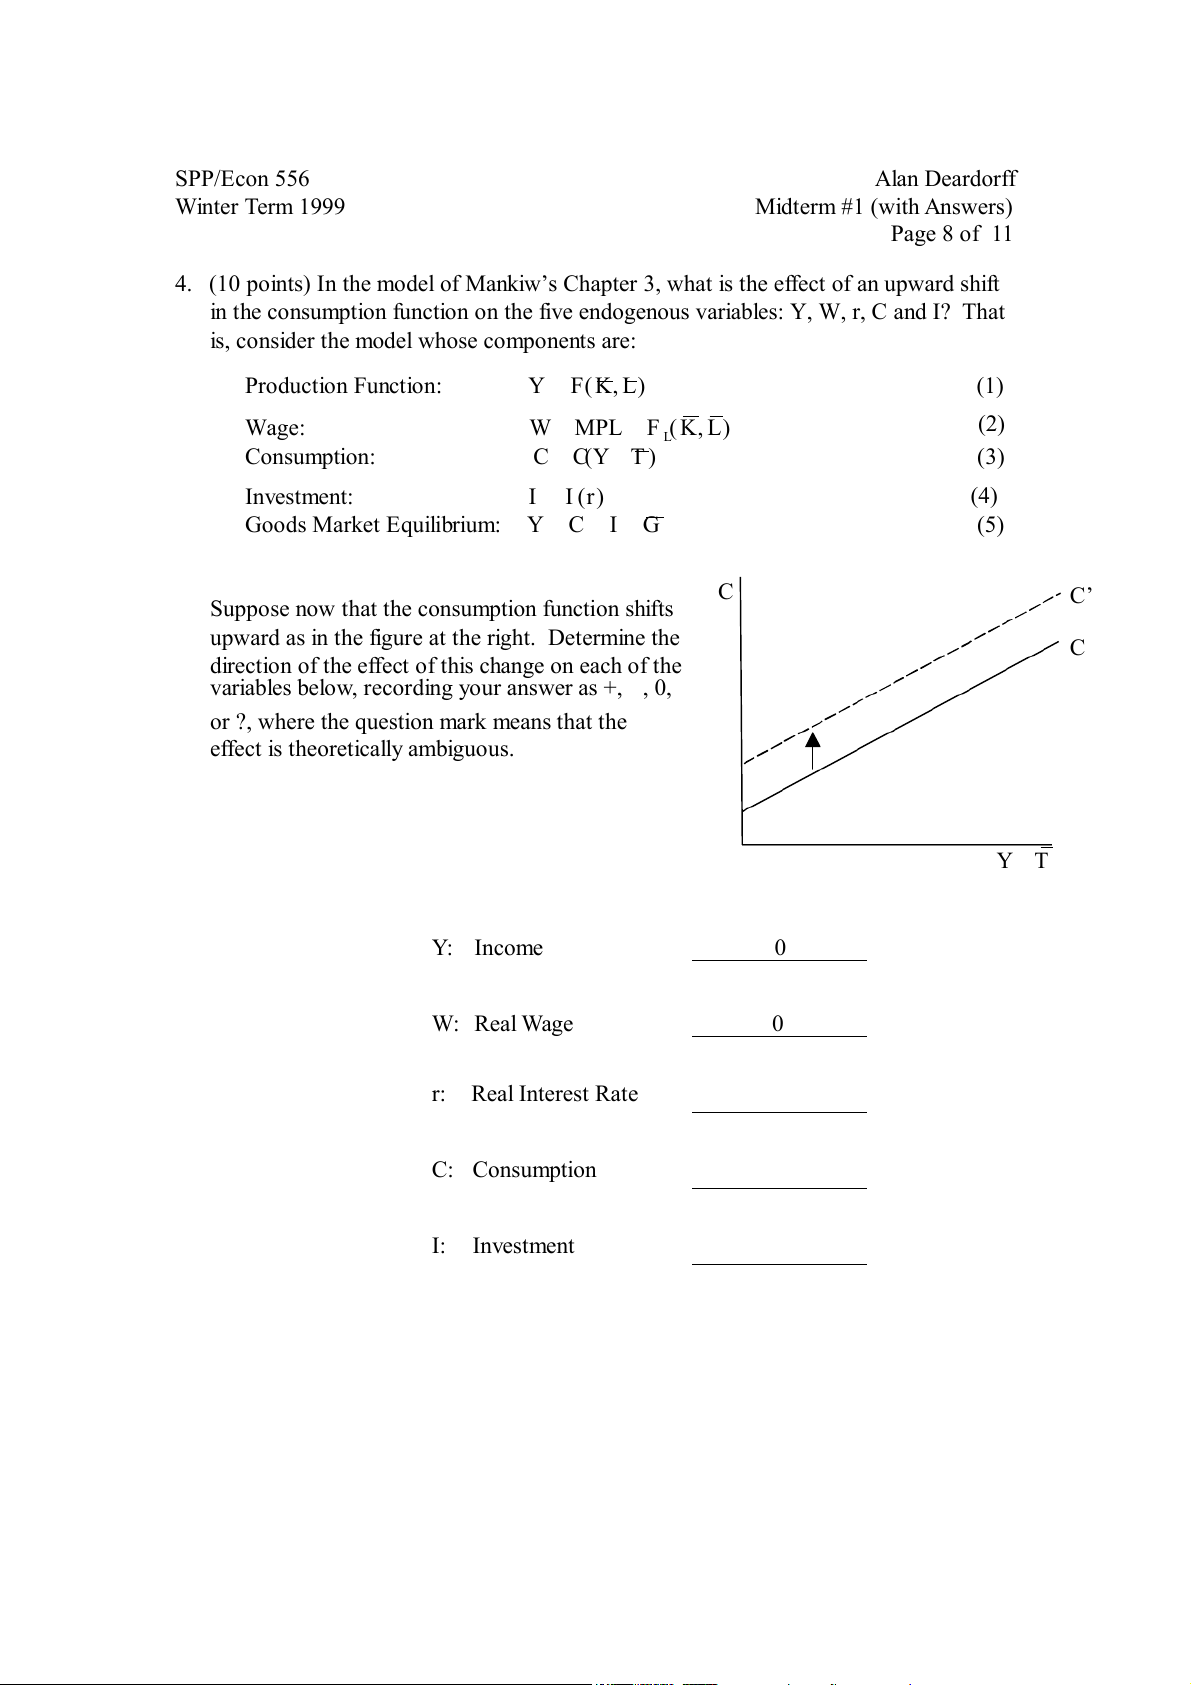
4. (10 points) In the model of Mankiw s Chapter ’
3, what is the effect of an upward shift
in the consumption function on the five endogenous variables: Y, W, , r C and I? That
is, consider the model whose components are: Production Function: Y F ( K, L) (1) Wage: W MPL F ( K, L) (2) L Consumption: C C (Y T ) (3) Investment: I I (r) (4)
Goods Market Equilibrium: Y C I G (5) C C’
Suppose now that the consumption function shifts
upward as in the figure at the right. Determine the C
direction of the effect of this change on each of the
variables below, recording your answer as +, , 0,
or ?, where the question mark means that the
effect is theoretically ambiguous. Y T Y: Income 0 W: Real Wage 0 r: Real Interest Rate C: Consumpti on I: Investment SPP/Econ 556 Alan Deardorff Winter Term 1999 Midterm #1 (with Answers) Page 9 of 11
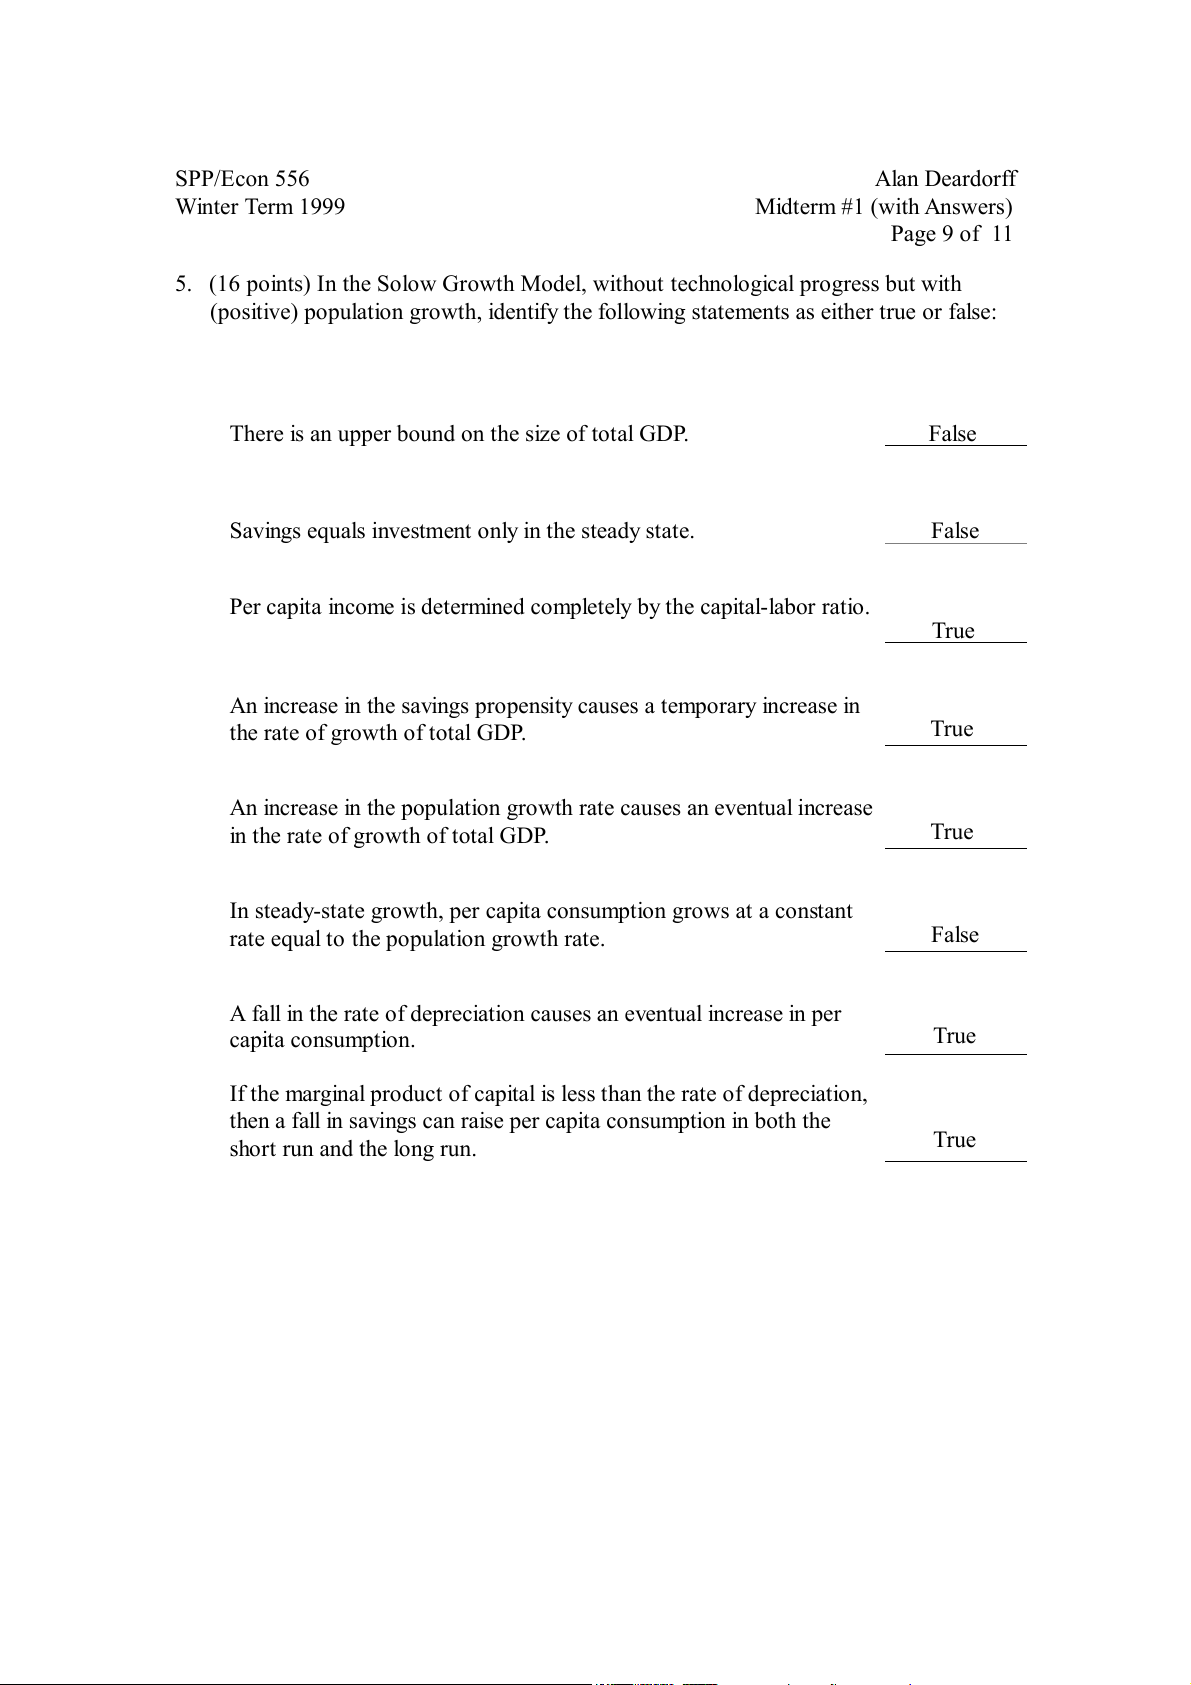
5. (16 points) In the Solow Growth Model, without technological progress but with
(positive) population growth, identify the following statements as either true or false:
There is an upper bound on the size of total GDP . False
Savings equals investment only in the steady state. False
Per capita income is determined completely by the capital-labor ratio. True
An increase in the savings propensity causes a temporary increase in
the rate of growth of total GDP . True
An increase in the population growth rate causes an eventual increase
in the rate of growth of total GDP . True
In steady-state growth, per capita consumption grows at a constant
rate equal to the population growth rate. False
A fall in the rate of depreciation causes an eventual increase in per capita consumption. True
If the marginal product of capital is less than the rate of depreciation,
then a fall in savings can raise per capita consumption in both the short run and the long run. True SPP/Econ 556 Alan Deardorff Winter Term 1999 Midterm #1 (with Answers) Page 10 of 11
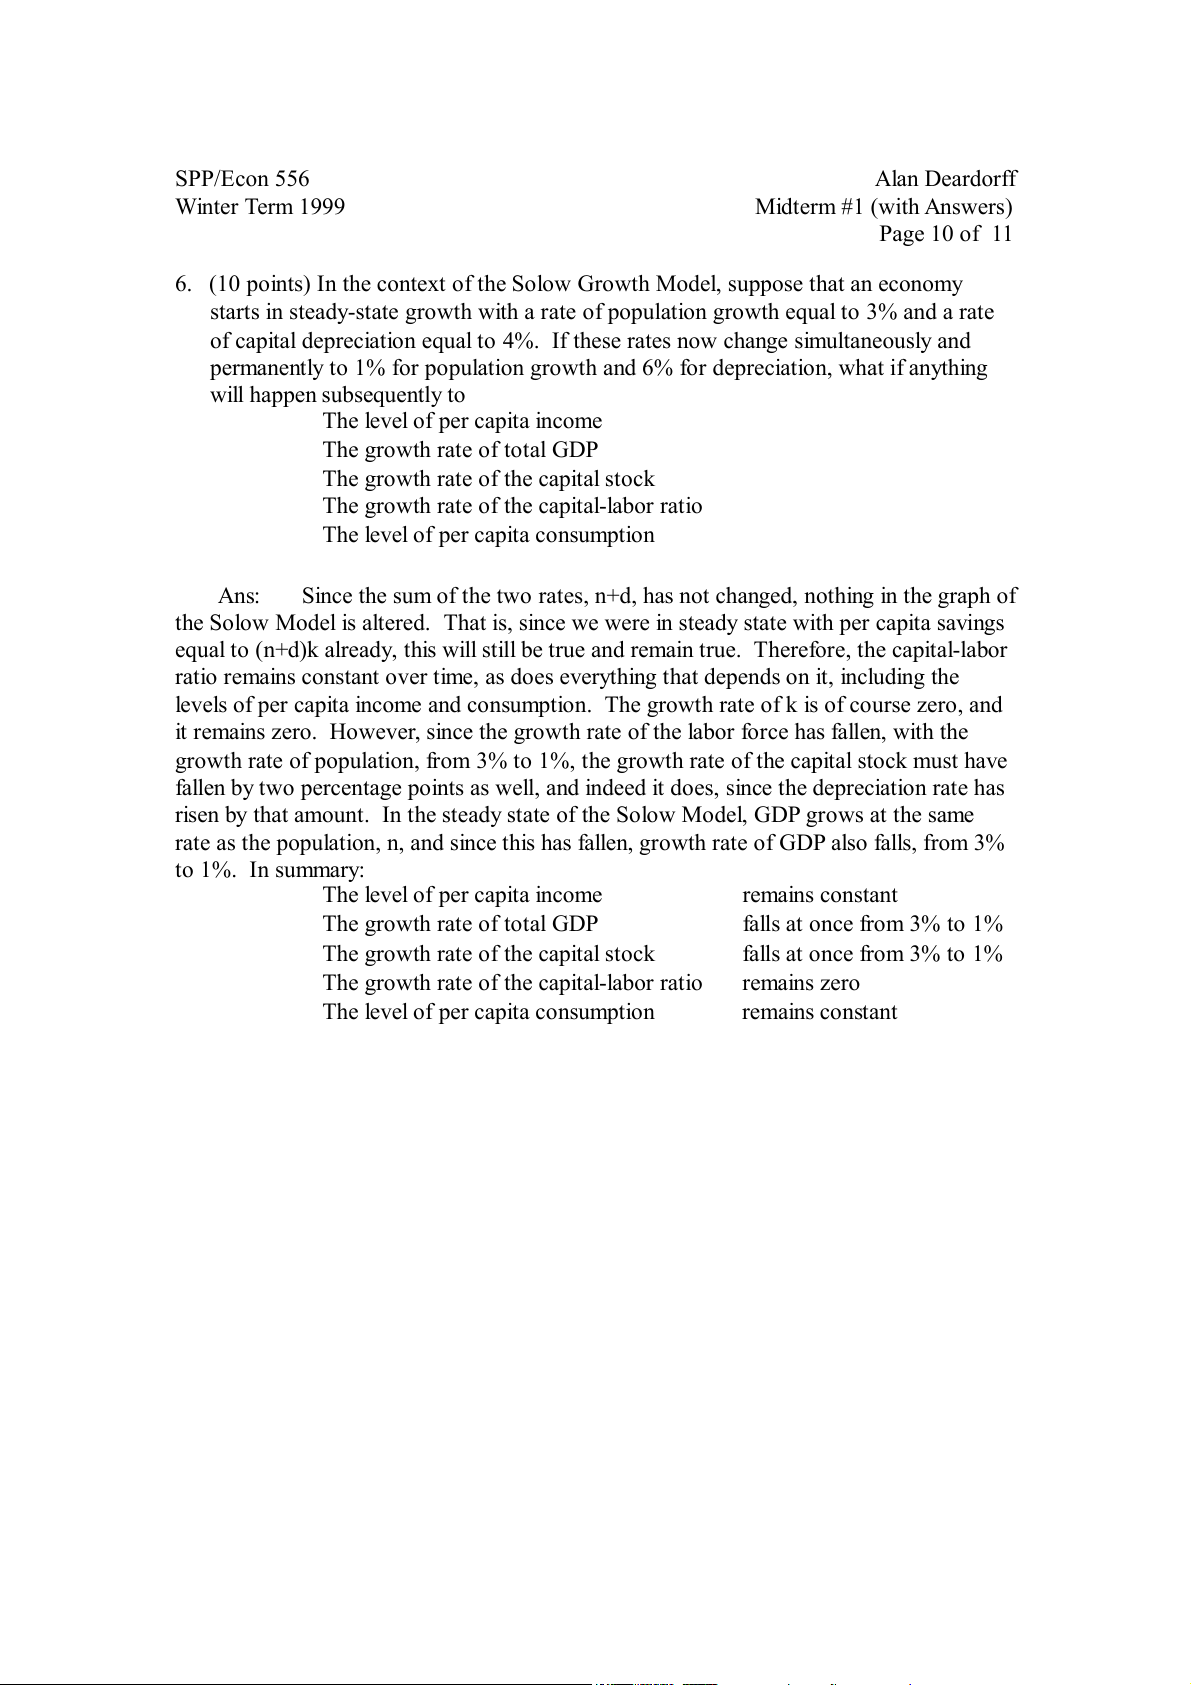
6. (10 points) In the context of the Solow Growth Model, suppose that an economy
starts in steady-state growth with a rate of population growth equal to 3% and a rate
of capital depreciation equal to 4%. If these rates now change simultaneously and
permanently to 1% for population growth and 6% for depreciation, what if anything will happen subsequently to
The level of per capita income The growth rate of total GDP
The growth rate of the capital stock
The growth rate of the capital-labor ratio
The level of per capita consumption Ans:
Since the sum of the two rates, n+d, has not changed, nothing in the graph of
the Solow Model is altered. That is, since we were in steady state with per capita savings
equal to (n+d)k already, this will still be true and remain true. Therefore, the capital-labor
ratio remains constant over time, as does everything that depends on it, including the
levels of per capita income and consumption. The growth rate of k is of course zero, and
it remains zero. However, since the growth rate of the labor force has fallen, with the
growth rate of population, from 3% to 1%, the growth rate of the capital stock must have
fallen by two percentage points as well, and indeed it does, since the depreciation rate has
risen by that amount. In the steady state of the Solow Model, GDP grows at the same
rate as the population, n, and since this has fallen, growth rate of GDP also falls, from 3% to 1%. In summary:
The level of per capita income remains constant The growth rate of total GDP falls at once from 3% to 1%
The growth rate of the capital stock falls at once from 3% to 1%
The growth rate of the capital-labor rati o remains zero
The level of per capita consumptio n remains constant SPP/Econ 556 Alan Deardorff Winter Term 1999 Midterm #1 (with Answers) Page 11 of 11
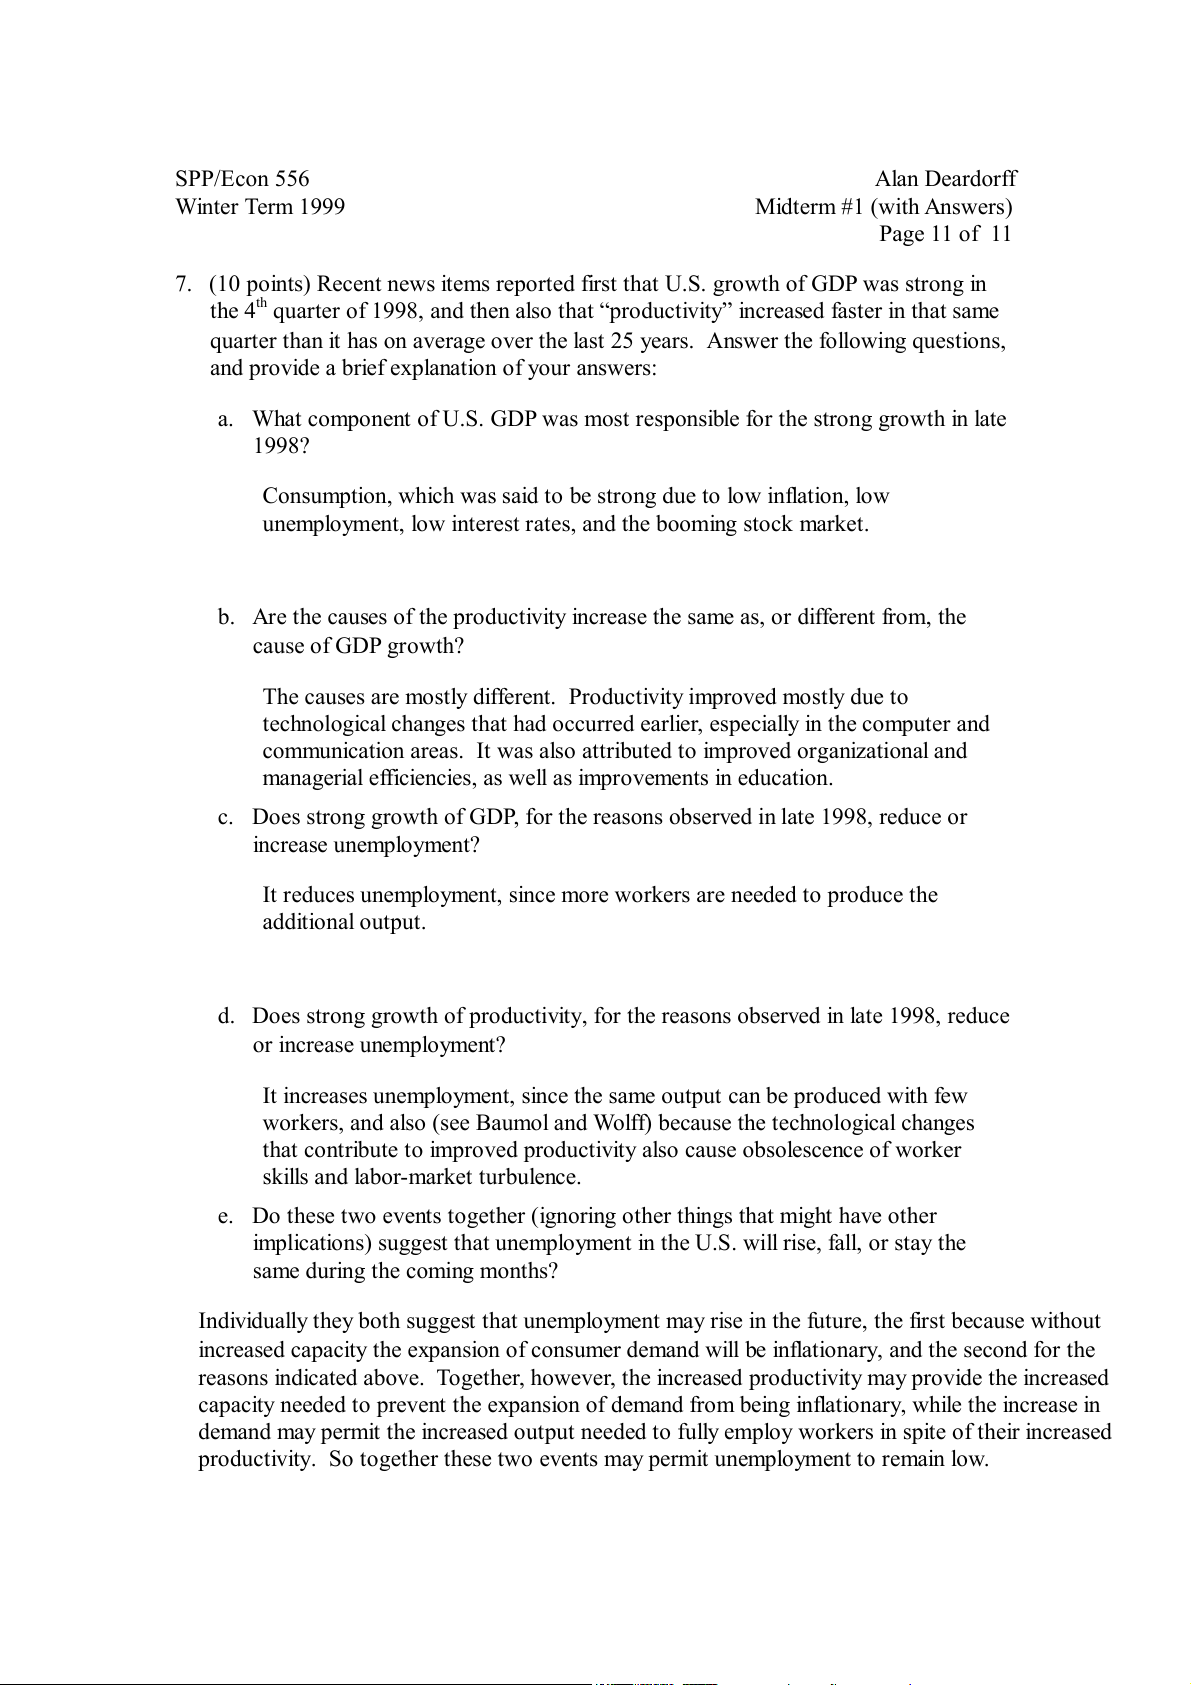
7. (10 points) Recent news items reported first that U.S. growth of GDP was strong in the 4t quar h
ter of 1998, and then also that
“productivity” increased faster in that same
quarter than it has on average over the last 25 years. Answer the following questions,
and provide a brief explanation of your answers:
a. What component of U.S. GDP was most responsible for the strong growth in late 1998?
Consumption, which was said to be strong due to low inflation, low
unemployment, low interest rates, and the booming stock market.
b. Are the causes of the productivity increase the same as, or different from, the cause of GDP growth?
The causes are mostly different. Productivity improved mostly due to
technological changes that had occurred earlier, especially in the computer and
communication areas. It was also attributed to improved organizational and
managerial efficiencies, as well as improvements in education.
c. Does strong growth of GDP, for the reasons observed in late 1998, reduce or increase unemployment?
It reduces unemployment, since more workers are needed to produce the additional output.
d. Does strong growth of productivity, for the reasons observed in late 1998, reduce or increase unemployment?
It increases unemployment, since the same output can be produced with few
workers, and also (see Baumol and Wolff) because the technological changes
that contribute to improved productivity also cause obsolescence of worker
skills and labor-market turbulence.
e. Do these two events together (ignoring other things that might have other
implications) suggest that unemployment in the U.S. will rise, fall, or stay the same during the coming months?
Individually they both suggest that unemployment may rise in the future, the first because without
increased capacity the expansion of consumer demand will be inflationary, and the second for the
reasons indicated above. Together, however, the increased productivity may provide the increased
capacity needed to prevent the expansion of demand from being inflationary, while the increase in
demand may permit the increased output needed to fully employ workers in spite of their increased
productivity. So together these two events may permit unemployment to remain low. SPP/Econ 556 Alan Deardorff Winter Term 1999 Midterm #1 (with Answers) Page 12 of 11
Tài liệu liên quan:
-
Syllabus: Principles of Microeconomics | Microeconomics | Trường Đại học Quốc tế, Đại học Quốc gia Thành phố Hồ Chí Minh
30 15 -

Understanding Economic Bubbles: Insights from Fama & Shiller | Microeconomics | Trường Đại học Quốc tế, Đại học Quốc gia Thành phố Hồ Chí Minh
23 12 -

Tóm Tắt Chương 1-3 Thuyết Kinh Tế Vi Mô | Microeconomics | Trường Đại học Quốc tế, Đại học Quốc gia Thành phố Hồ Chí Minh
26 13 -
Assignment Presentation 1: Economic Trade-offs & Production Dynamics | Microeconomics | Trường Đại học Quốc tế, Đại học Quốc gia Thành phố Hồ Chí Minh
18 9