Analysis and Opportunity Costs: Group Assignment 1 | Microeconomics | Trường Đại học Quốc tế, Đại học Quốc gia Thành phố Hồ Chí Minh
Assume that a simple economy has 2 industries which produce wheat and cloths. Resources to produce these products are scarce and used effectively. The following table represents the possible combinations of output between wheat and cloths that this economy produces in a given year. Alternatives. Tài liệu được sưu tầm và soạn thảo dưới dạng file PDF để gửi tới các bạn cùng tham khảo, ôn tập đầy đủ kiến thức, chuẩn bị cho các buổi học thật tốt. Mời bạn đọc đón xem!
Môn: Microeconomics 635 tài liệu
Trường: Trường Đại học Quốc tế, Đại học Quốc gia Thành phố Hồ Chí Minh 1.9 K tài liệu
Tác giả:
Preview text:
Exercise 2. Assume that a simple economy has 2 industries which produce wheat and cloths.
Resources to produce these products are scarce and used effectively. The following table represents
the possible combinations of output between wheat and cloths that this economy produces in a given year.
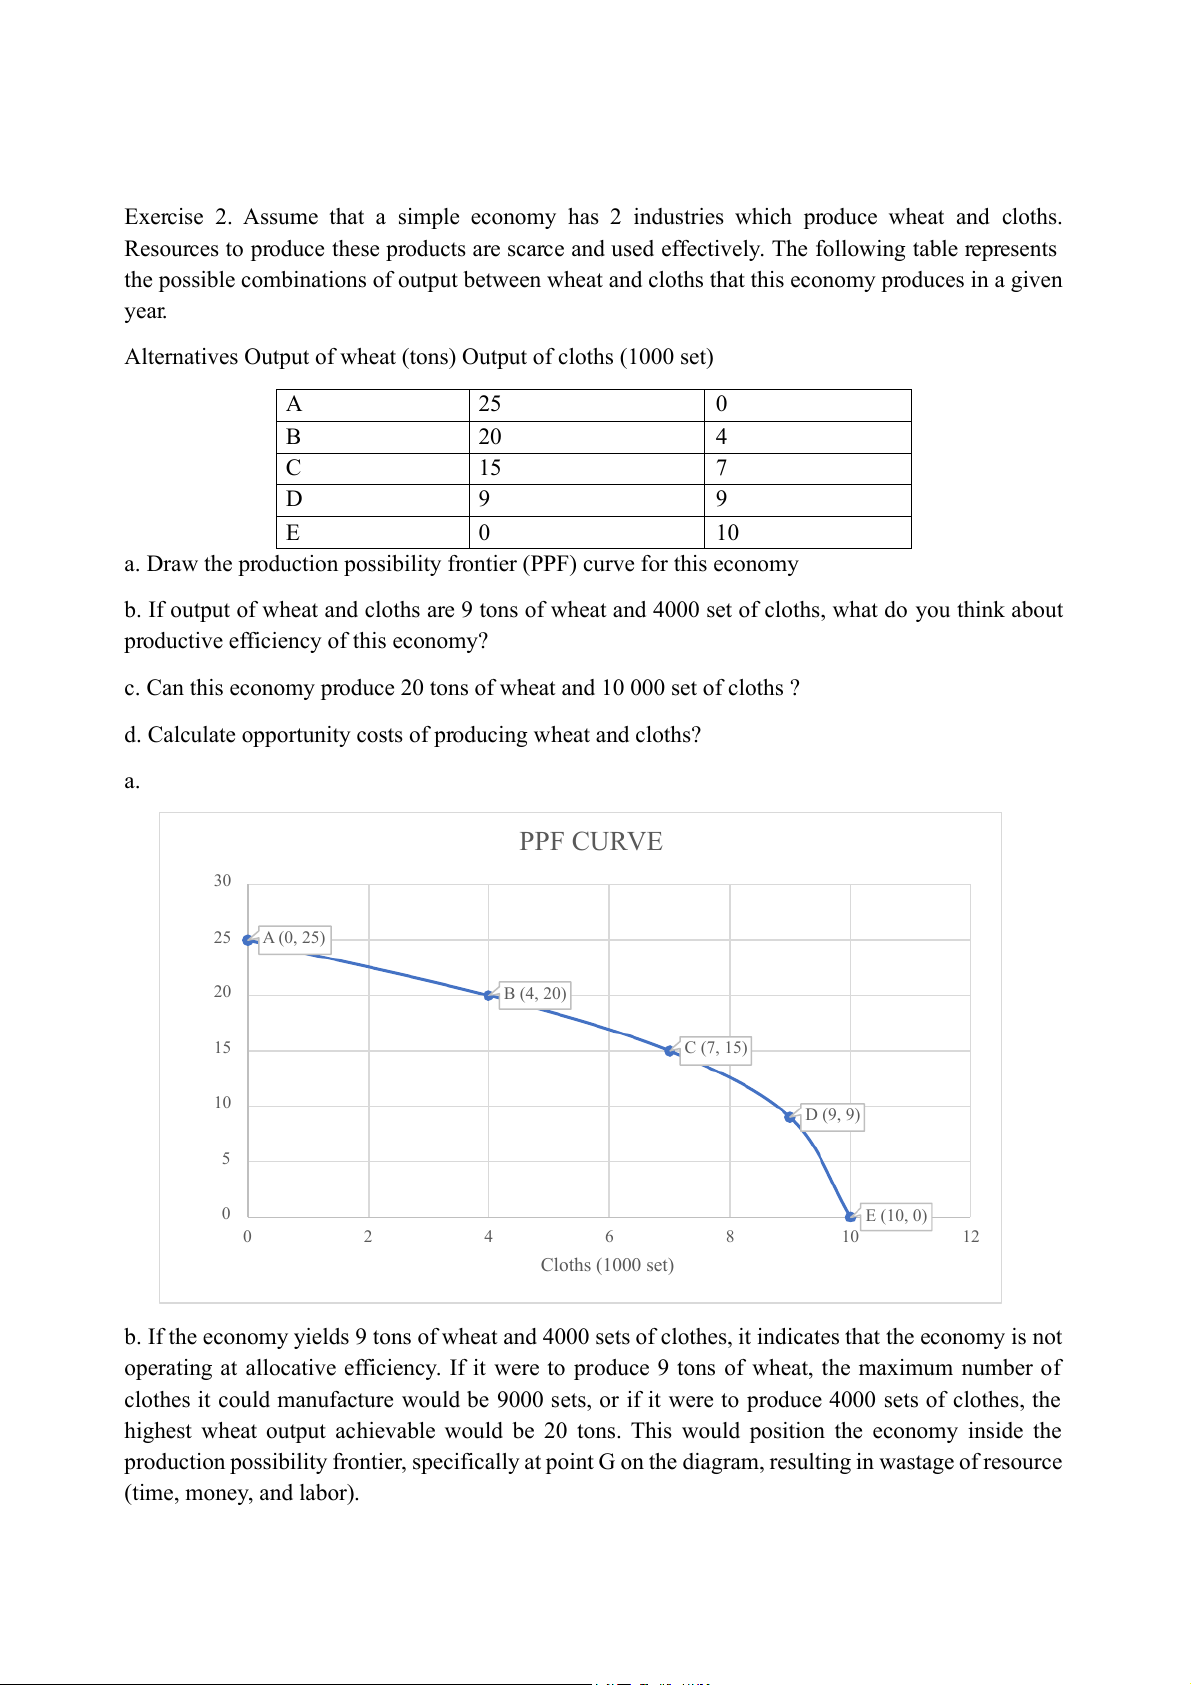
Alternatives Output of wheat (tons) Output of cloths (1000 set) A 25 0 B 20 4 C 15 7 D 9 9 E 0 10
a. Draw the production possibility frontier (PPF) curve for this economy
b. If output of wheat and cloths are 9 tons of wheat and 4000 set of cloths, what do you think about
productive efficiency of this economy?
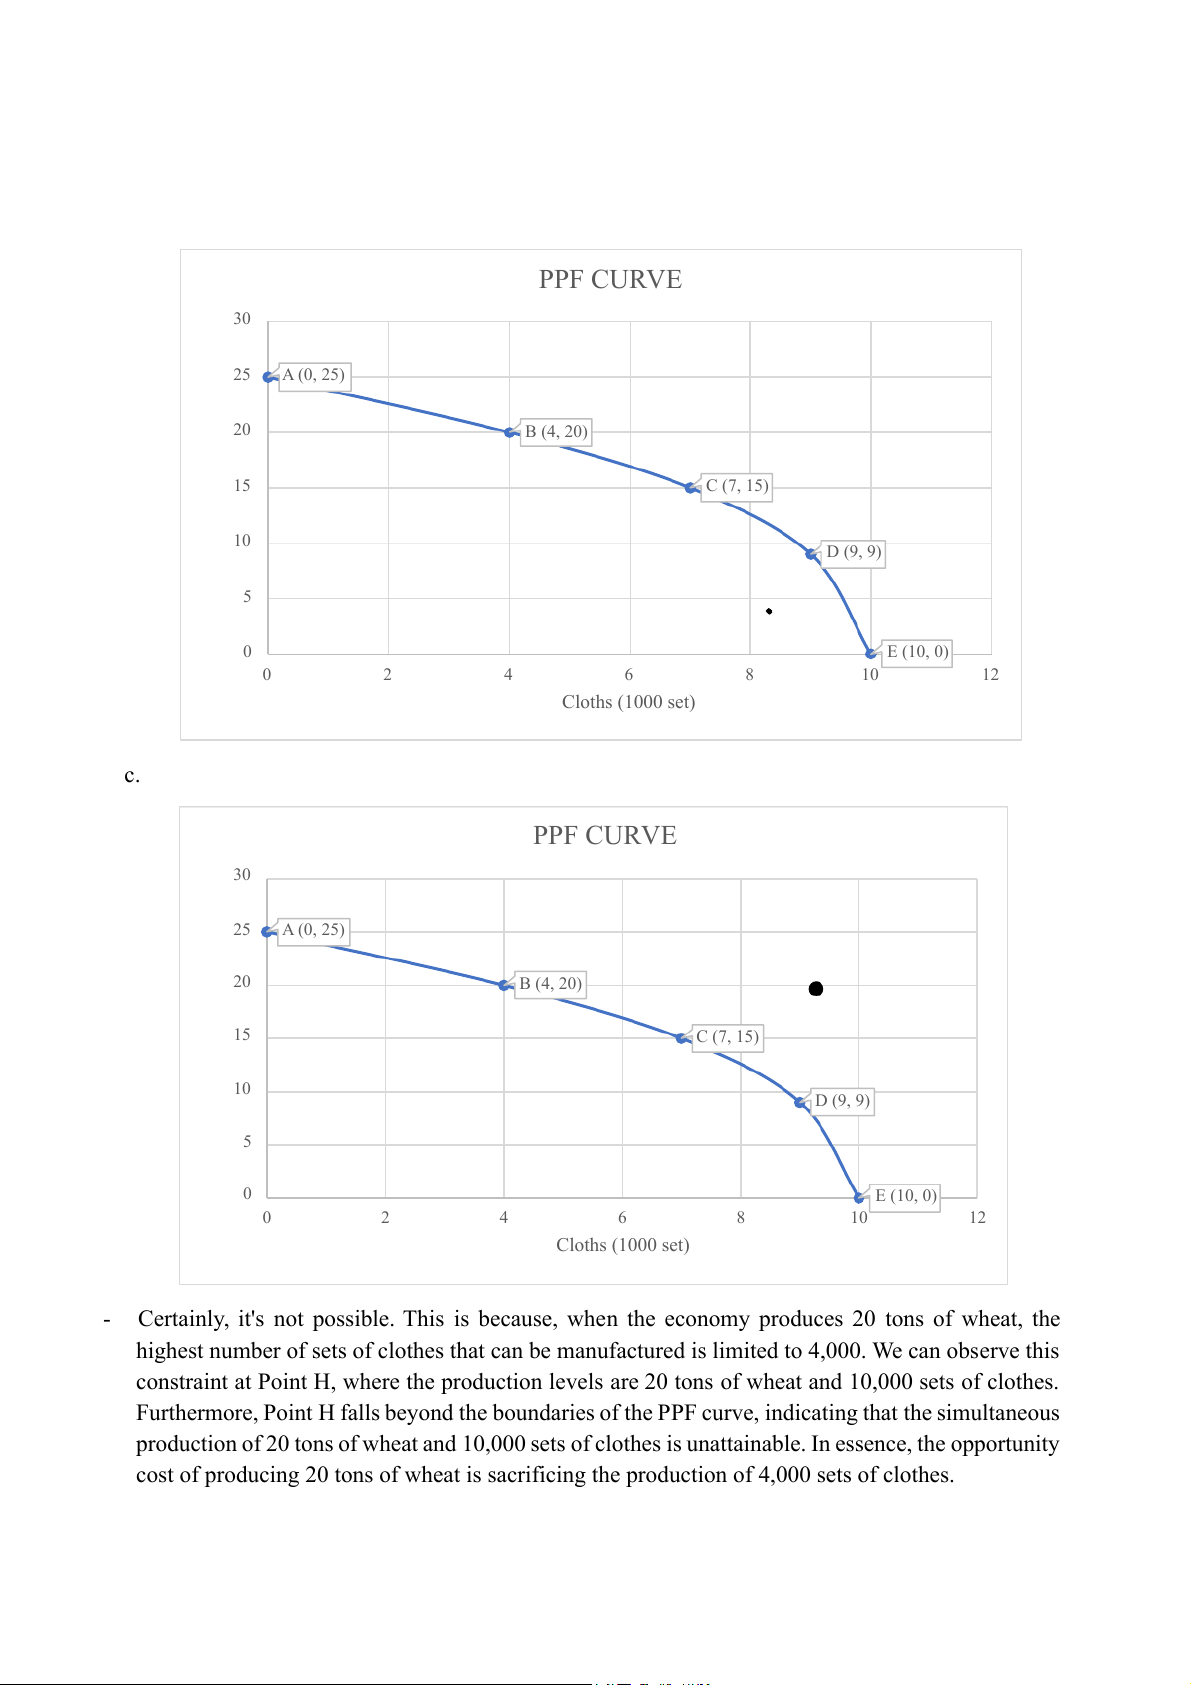
c. Can this economy produce 20 tons of wheat and 10 000 set of cloths ?
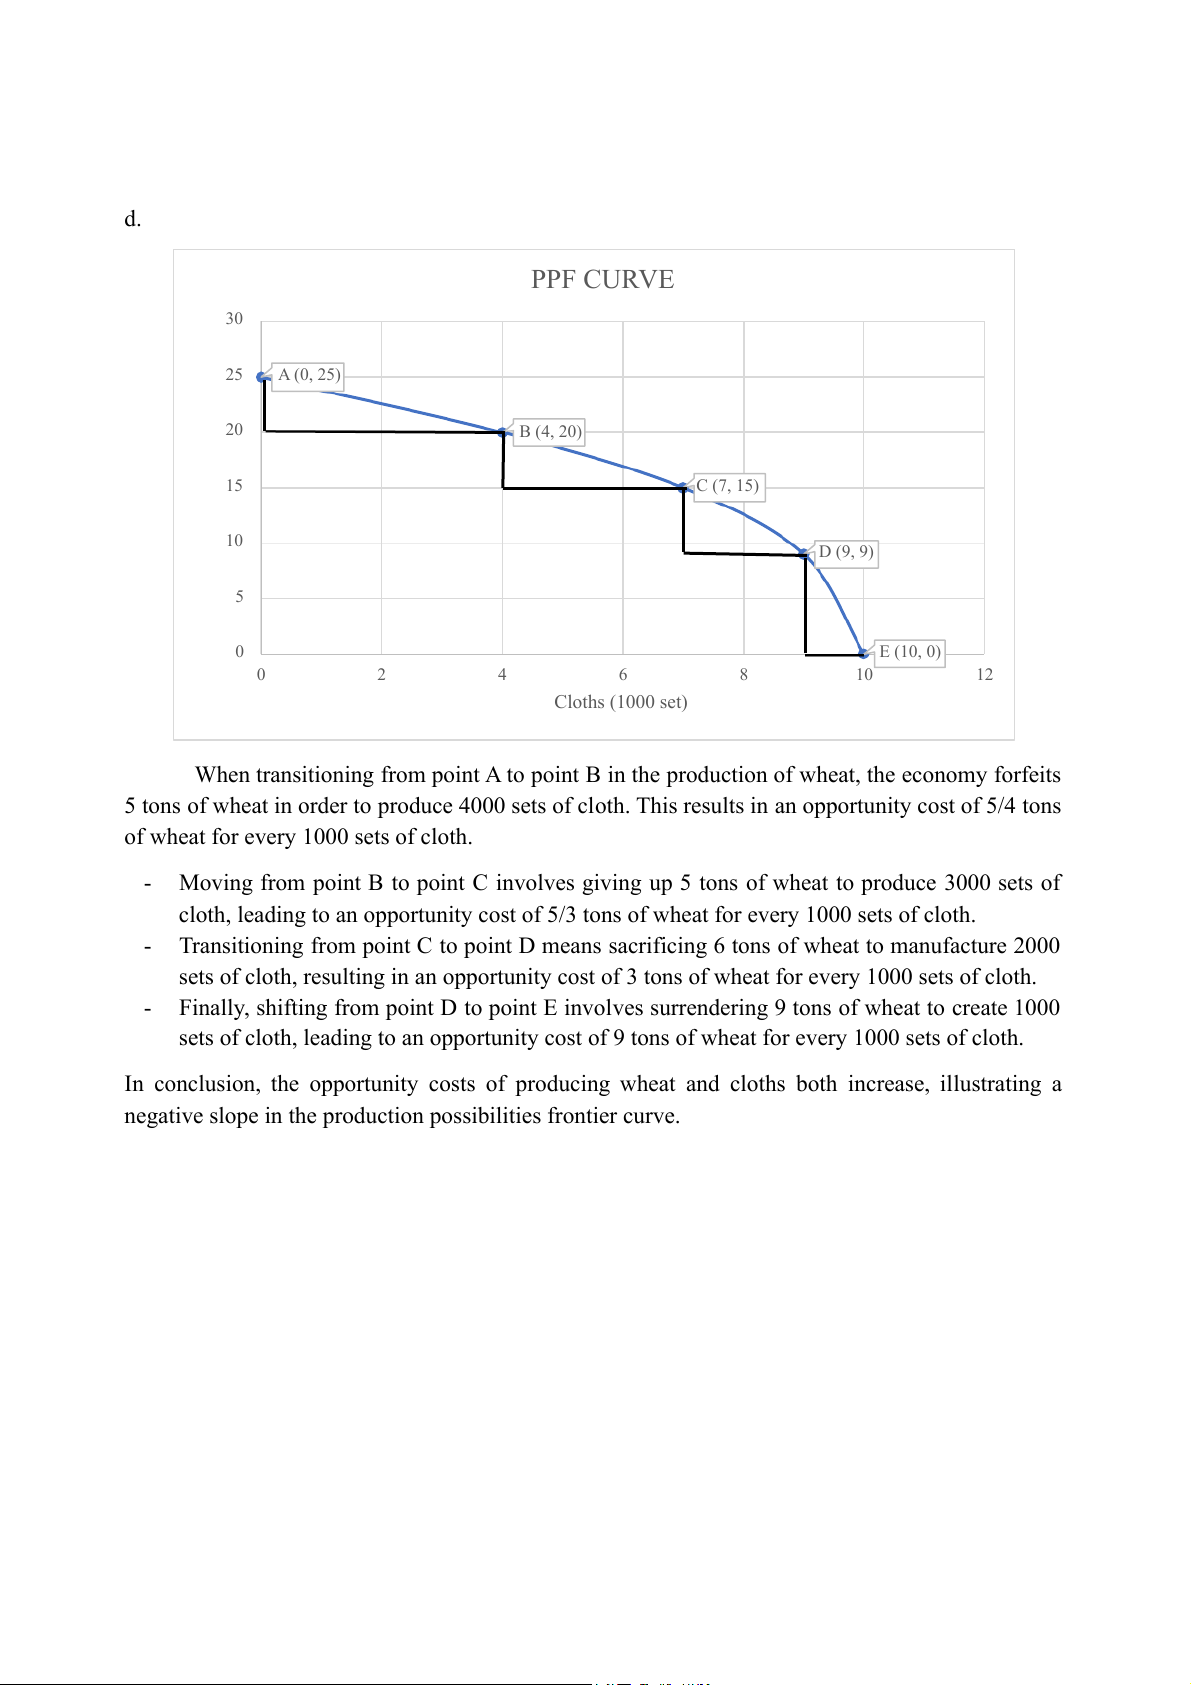
d. Calculate opportunity costs of producing wheat and cloths? a. PPF CURVE 30 25 A (0, 2 ) 5 20 B (4, 2 ) 0 15 C (7, 15) at (tons) Whe 10 D (9, 9) 5 0 E (10, 0) 0 2 4 6 8 10 12 Cloths (1000 set)
b. If the economy yields 9 tons of wheat and 4000 sets of clothes, it indicates that the economy is not
operating at allocative efficiency. If it were to produce 9 tons of wheat, the maximum number of
clothes it could manufacture would be 9000 sets, or if it were to produce 4000 sets of clothes, the
highest wheat output achievable would be 20 tons. This would position the economy inside the
production possibility frontier, specifically at point G on the diagram, resulting in wastage of resource (time, money, and labor). PPF CURVE 30 25 A (0, 2 ) 5 20 B (4, 2 ) 0 15 C (7, 15) at (tons) Whe 10 D (9, 9) 5 0 E (10, 0) 0 2 4 6 8 10 12 Cloths (1000 set) c. PPF CURVE 30 25 A (0, 2 ) 5 20 B (4, 2 ) 0 15 C (7, 15) at (tons) Whe 10 D (9, 9) 5 0 E (10, 0) 0 2 4 6 8 10 12 Cloths (1000 set) -
Certainly, it's not possible. This is because, when the economy produces 20 tons of wheat, the
highest number of sets of clothes that can be manufactured is limited to 4,000. We can observe this
constraint at Point H, where the production levels are 20 tons of wheat and 10,000 sets of clothes.
Furthermore, Point H falls beyond the boundaries of the PPF curve, indicating that the simultaneous
production of 20 tons of wheat and 10,000 sets of clothes is unattainable. In essence, the opportunity
cost of producing 20 tons of wheat is sacrificing the production of 4,000 sets of clothes. d. PPF CURVE 30 25 A (0, 2 ) 5 20 B (4, 2 ) 0 15 C (7, 15) at (tons) Whe 10 D (9, 9) 5 0 E (10, 0) 0 2 4 6 8 10 12 Cloths (1000 set)
When transitioning from point A to point B in the production of wheat, the economy forfeits
5 tons of wheat in order to produce 4000 sets of cloth. This results in an opportunity cost of 5/4 tons
of wheat for every 1000 sets of cloth. -
Moving from point B to point C involves giving up 5 tons of wheat to produce 3000 sets of
cloth, leading to an opportunity cost of 5/3 tons of wheat for every 1000 sets of cloth. -
Transitioning from point C to point D means sacrificing 6 tons of wheat to manufacture 2000
sets of cloth, resulting in an opportunity cost of 3 tons of wheat for every 1000 sets of cloth. -
Finally, shifting from point D to point E involves surrendering 9 tons of wheat to create 1000
sets of cloth, leading to an opportunity cost of 9 tons of wheat for every 1000 sets of cloth.
In conclusion, the opportunity costs of producing wheat and cloths both increase, illustrating a
negative slope in the production possibilities frontier curve.
Tài liệu liên quan:
-

Chương 3: độ co giãn và các nhân tố ảnh hưởng | Microeconomics | Trường Đại học Quốc tế, Đại học Quốc gia Thành phố Hồ Chí Minh
3 2 -

Microeconomics Syllabus | Microeconomics | Trường Đại học Quốc tế, Đại học Quốc gia Thành phố Hồ Chí Minh
3 2 -

Microeconomics Course Syllabus & Assessment Details | Microeconomics | Trường Đại học Quốc tế, Đại học Quốc gia Thành phố Hồ Chí Minh
3 2 -

Assignment 3 - Elasticity MCQs and Key Concepts | Microeconomics | Trường Đại học Quốc tế, Đại học Quốc gia Thành phố Hồ Chí Minh
3 2 -

Assignment 2 - Economic Equilibrium Analysis of Fridges and Motorcycles | Microeconomics | Trường Đại học Quốc tế, Đại học Quốc gia Thành phố Hồ Chí Minh
3 2