Assignment 3: Effects of Demand and Supply Shifts | Microeconomics | Trường Đại học Quốc tế, Đại học Quốc gia Thành phố Hồ Chí Minh
Hurricane Katrina led to the migration of citizens from New Orleans to Baton Rouge. As a result, the increase in the city’s population shifted the demand curve to the right. - While before the hurricane, there were 3,600 homes listed for sale in the city, but a week after the storm, there were only 500. Tài liệu được sưu tầm và soạn thảo dưới dạng file PDF để gửi tới các bạn cùng tham khảo, ôn tập đầy đủ kiến thức, chuẩn bị cho các buổi học thật tốt. Mời bạn đọc đón xem!
Môn: Microeconomics 635 tài liệu
Trường: Trường Đại học Quốc tế, Đại học Quốc gia Thành phố Hồ Chí Minh 1.9 K tài liệu
Tác giả:


Preview text:
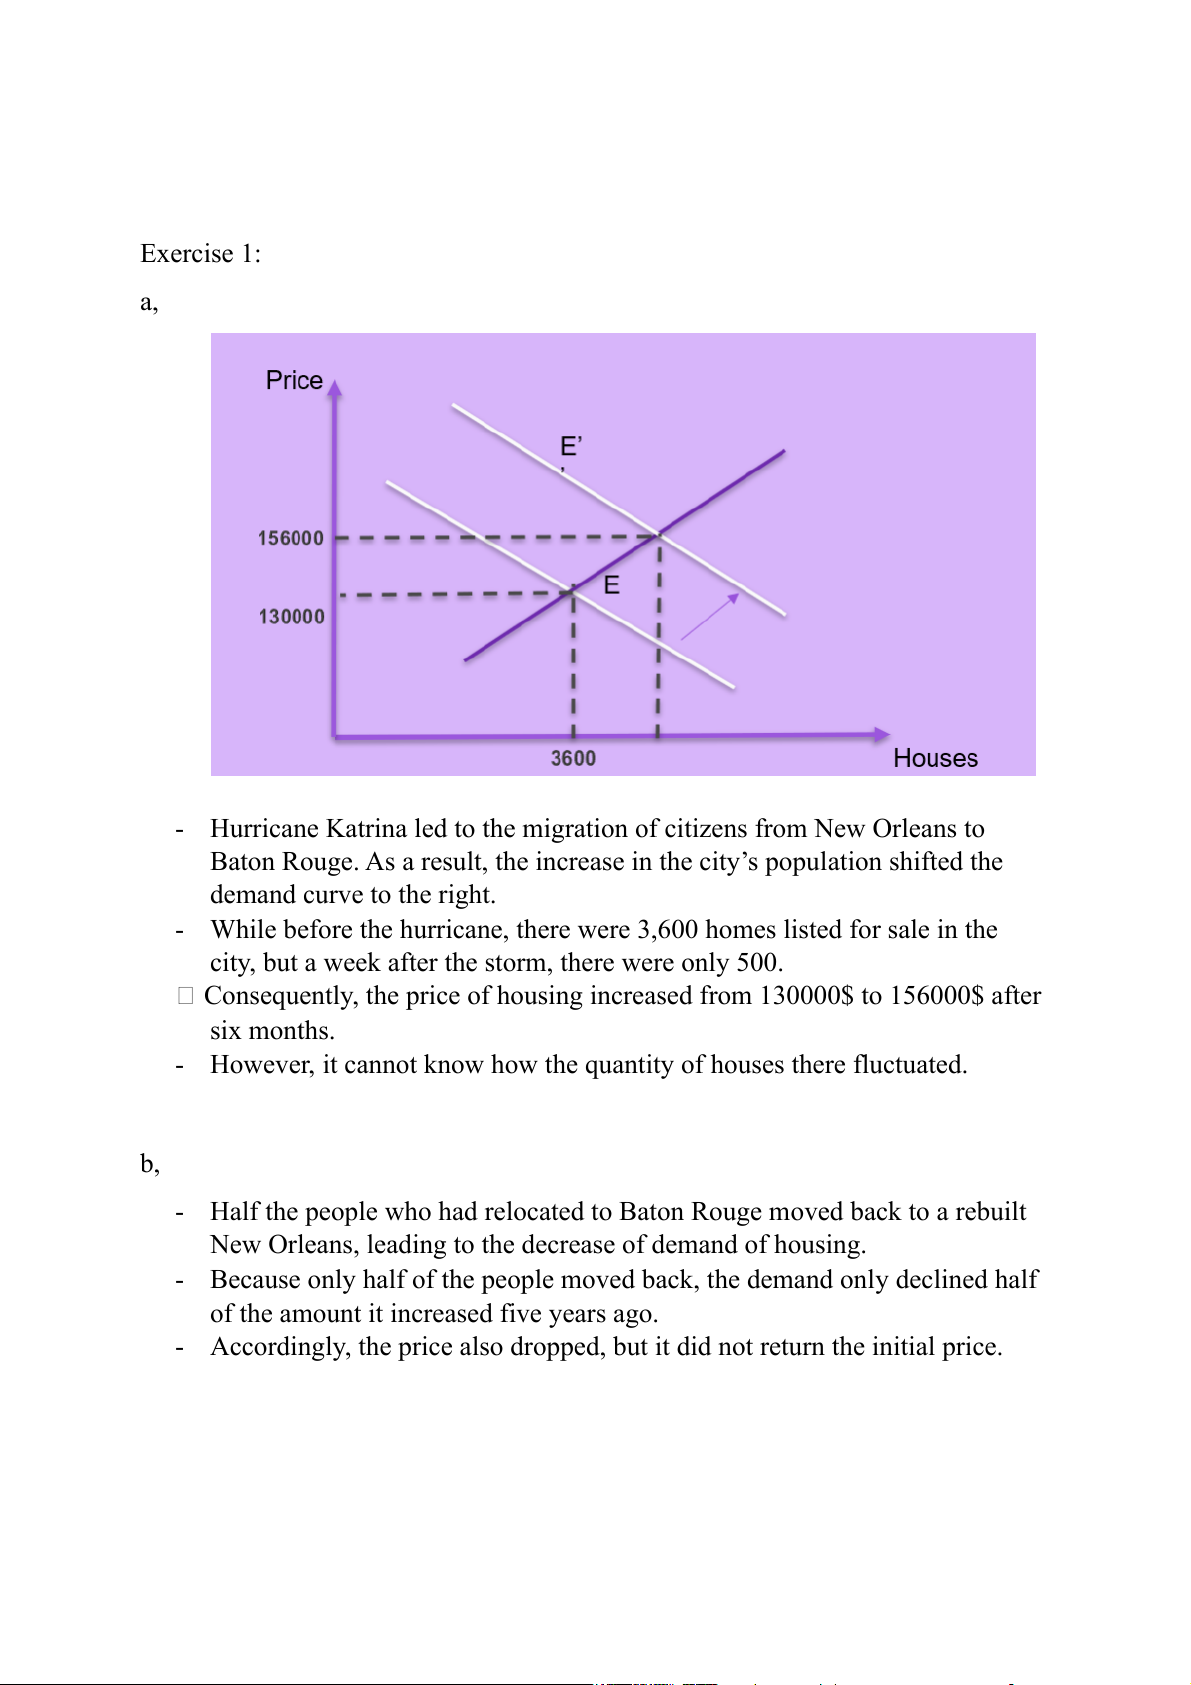
Exercise 1: a,
- Hurricane Katrina led to the migration of citizens from New Orleans to
Baton Rouge. As a result, the increase in the city’s population shifted the demand curve to the right.
- While before the hurricane, there were 3,600 homes listed for sale in the
city, but a week after the storm, there were only 500.
Consequently, the price of housing increased from 130000$ to 156000$ after six months.
- However, it cannot know how the quantity of houses there fluctuated. b,
- Half the people who had relocated to Baton Rouge moved back to a rebuilt
New Orleans, leading to the decrease of demand of housing.
- Because only half of the people moved back, the demand only declined half
of the amount it increased five years ago.
- Accordingly, the price also dropped, but it did not return the initial price. Exercise 2: Case 2
In the last few years, thousands of honeybee colonies have vanished, which is a
result of bee colony collapse disorder (CCD). Roughly one-third of the US food
supply- including a wide variety of fruits, vegetables, and nuts- depends on
pollination from bees. The decline of honeybees threatens $ 15 billion worth of
crops in the US. The decrease in pollination by bees has decreased the supply of
strawberries, raspberries, and almost, leading to higher prices for these ingredients
for ice cream. The higher price for berries and nuts has increased the cost of
producing food products, such as ice cream, increasing their prices as well.
Questions Draw graphs to show the effects of the decline of the bee population on
the market for ice cream and explain those effects.
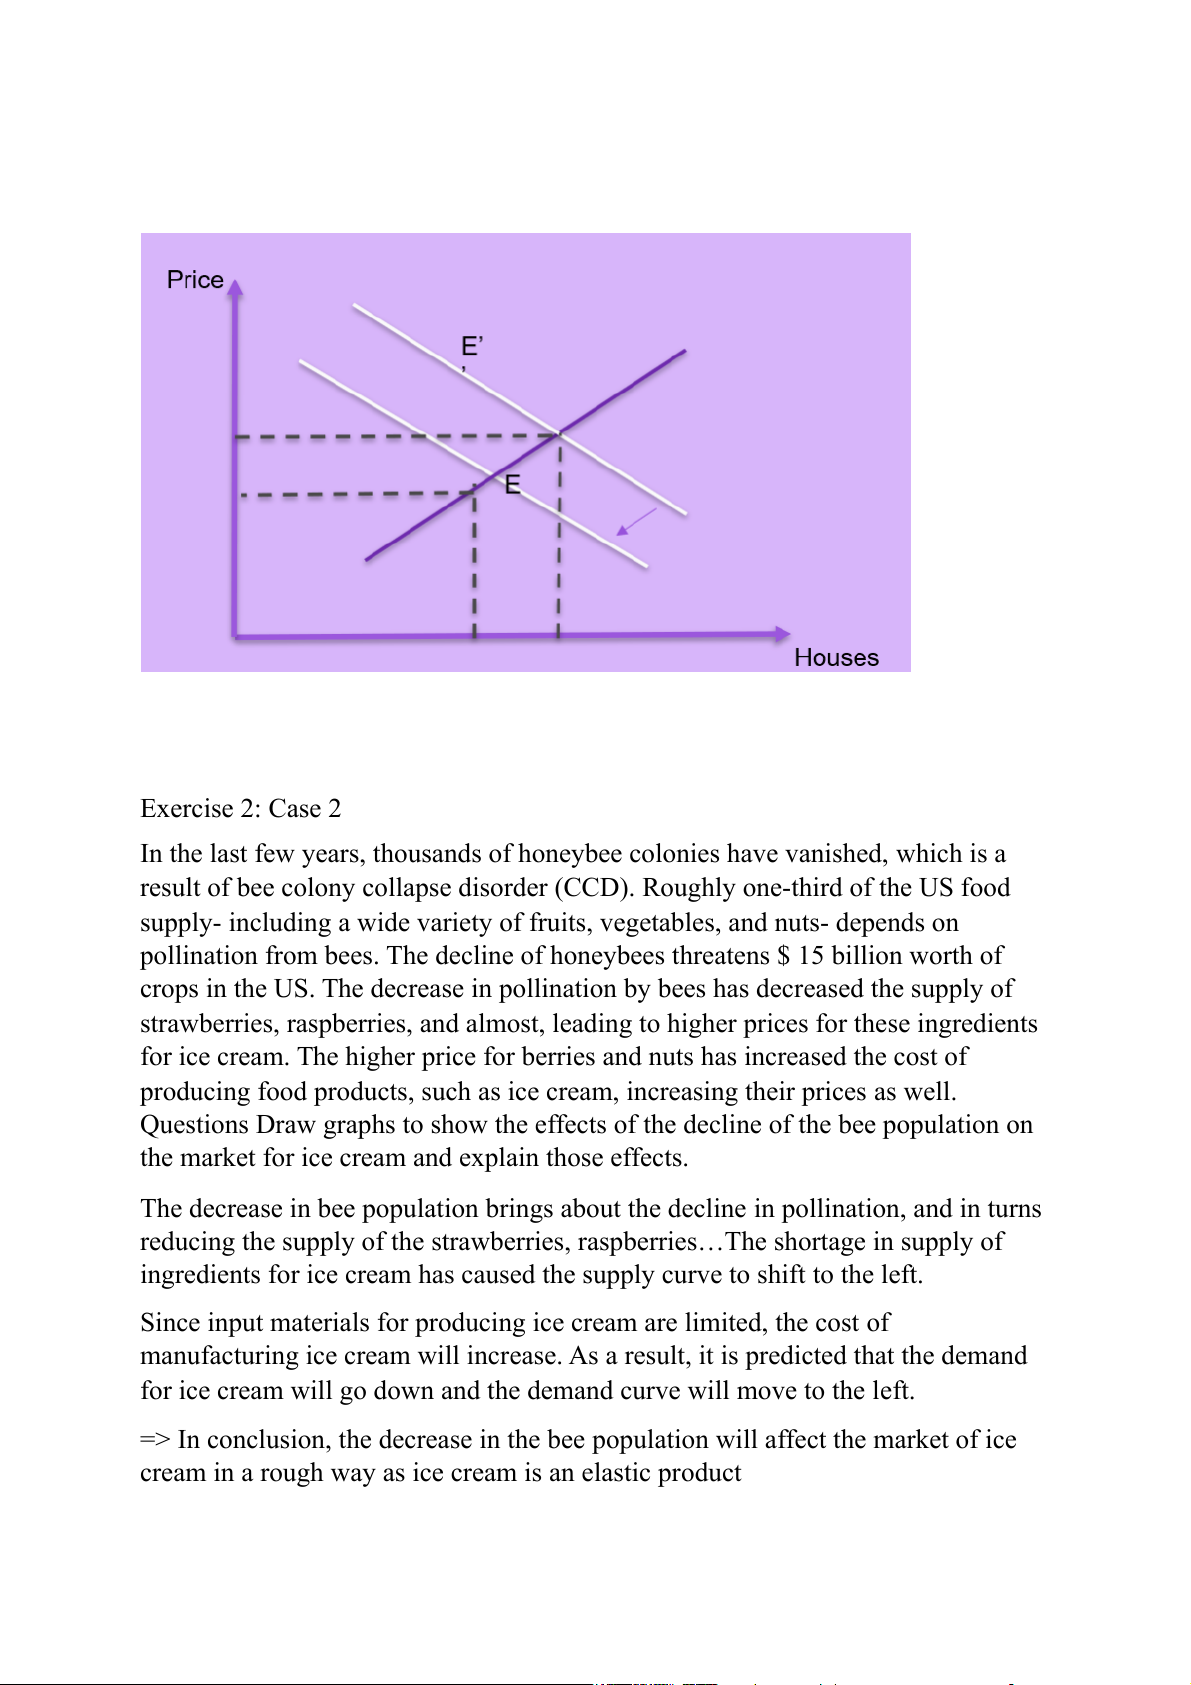
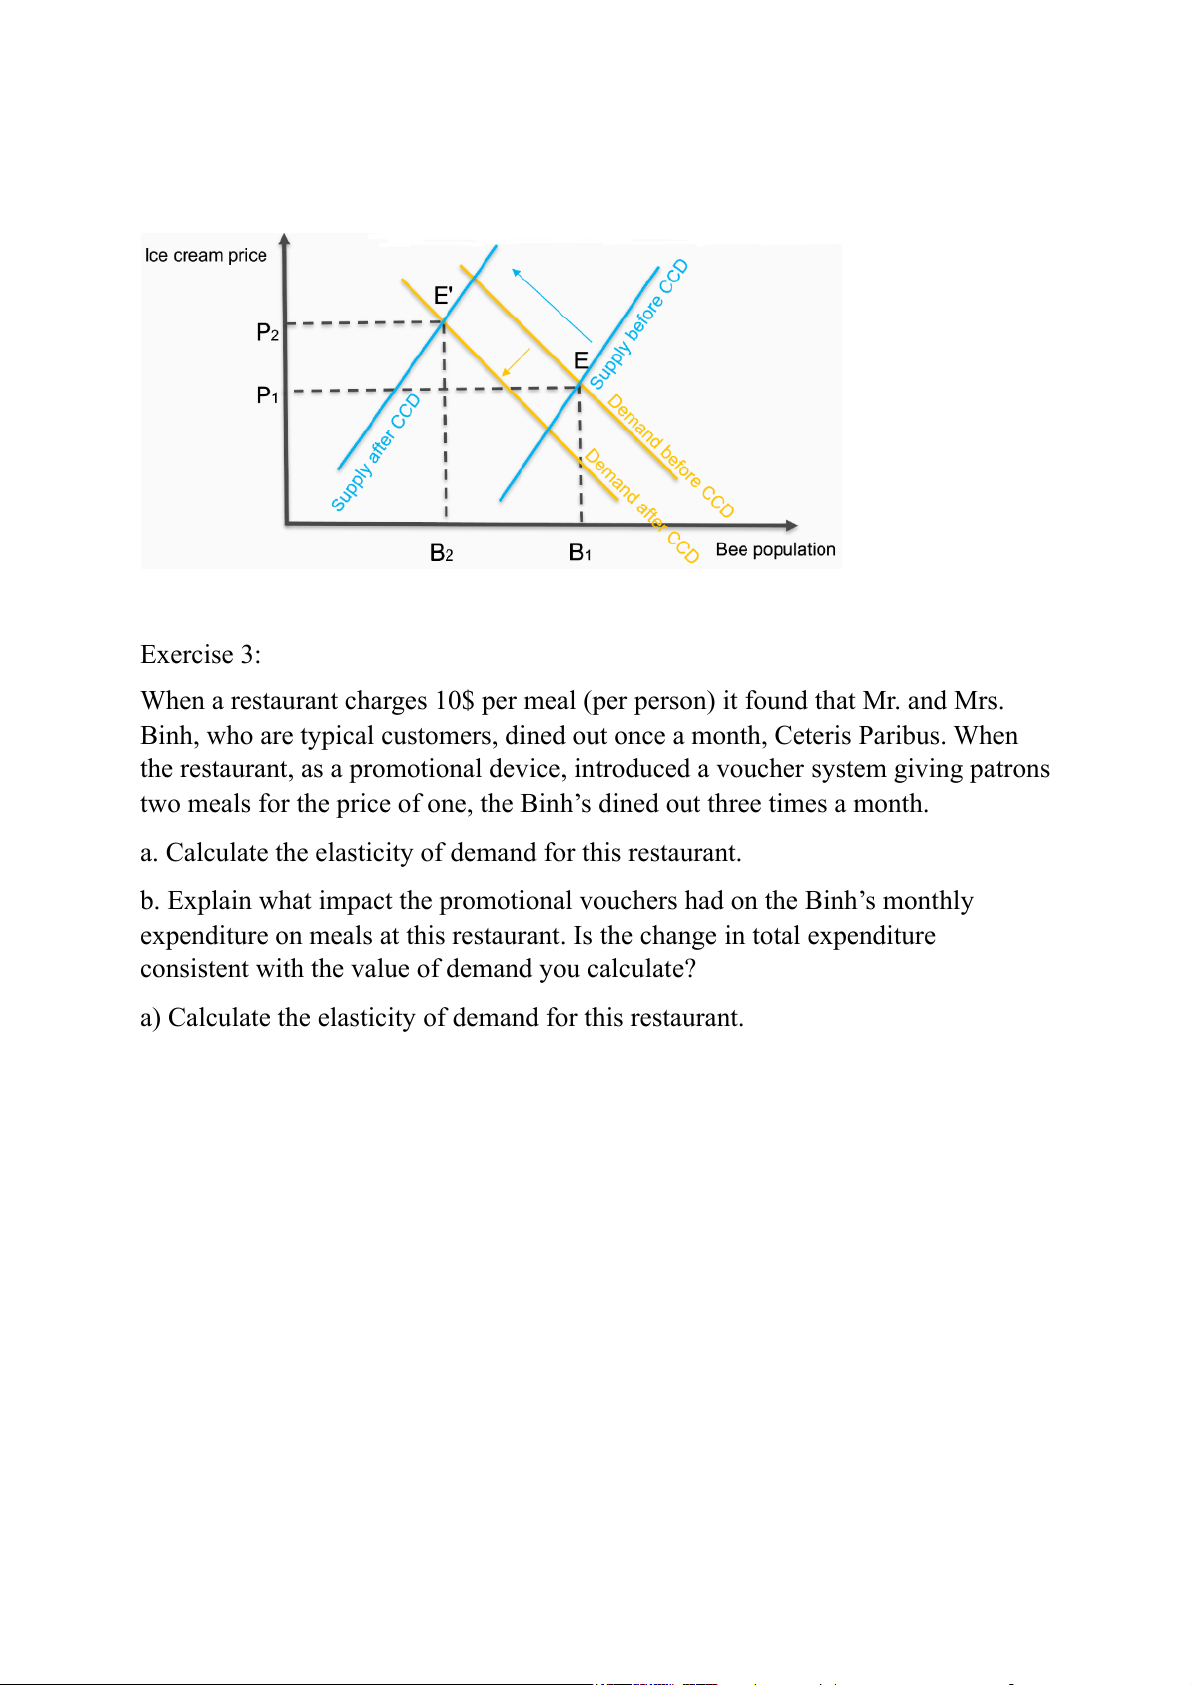
The decrease in bee population brings about the decline in pollination, and in turns
reducing the supply of the strawberries, raspberries…The shortage in supply of
ingredients for ice cream has caused the supply curve to shift to the left.
Since input materials for producing ice cream are limited, the cost of
manufacturing ice cream will increase. As a result, it is predicted that the demand
for ice cream will go down and the demand curve will move to the left.
=> In conclusion, the decrease in the bee population will affect the market of ice
cream in a rough way as ice cream is an elastic product Exercise 3:
When a restaurant charges 10$ per meal (per person) it found that Mr. and Mrs.
Binh, who are typical customers, dined out once a month, Ceteris Paribus. When
the restaurant, as a promotional device, introduced a voucher system giving patrons
two meals for the price of one, the Binh’s dined out three times a month.
a. Calculate the elasticity of demand for this restaurant.
b. Explain what impact the promotional vouchers had on the Binh’s monthly
expenditure on meals at this restaurant. Is the change in total expenditure
consistent with the value of demand you calculate?
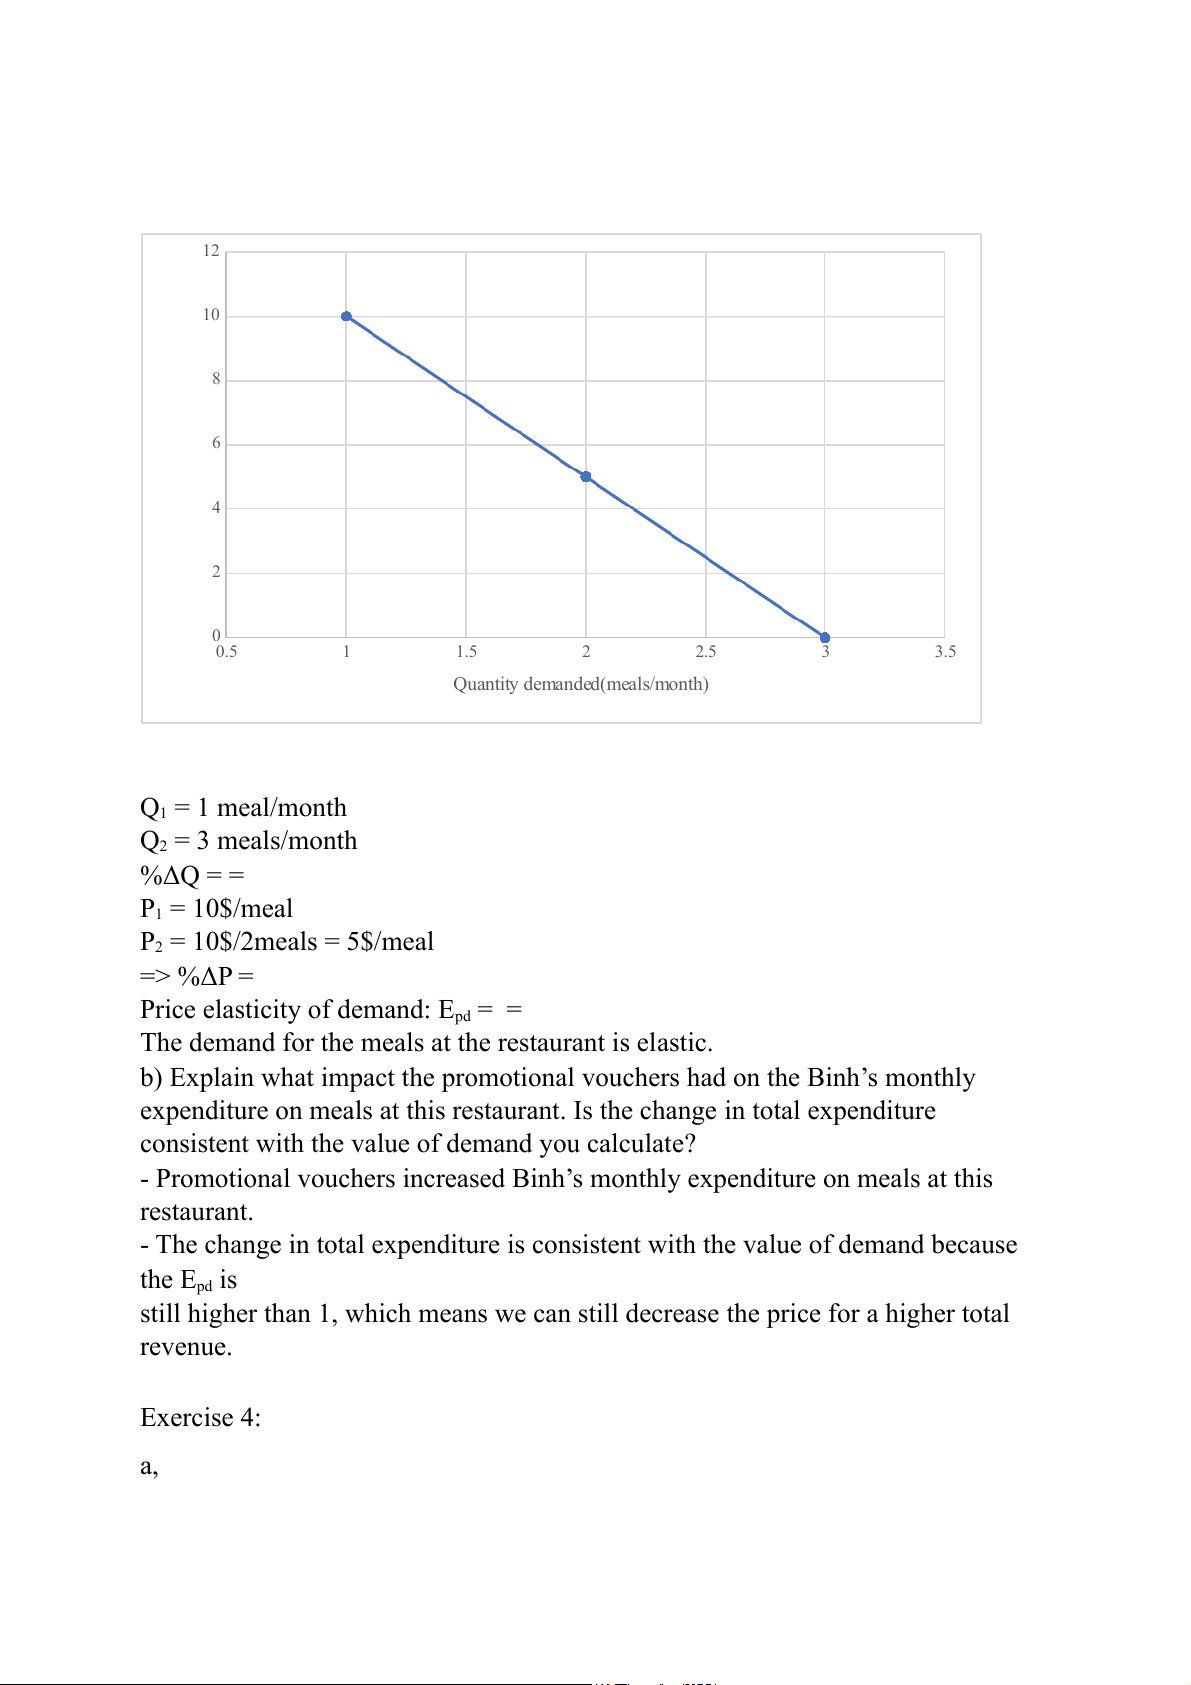
a) Calculate the elasticity of demand for this restaurant. 12 10 8 ) e($ 6 ic Pr 4 2 00.5 1 1.5 2 2.5 3 3.5 Quantity demanded(meals/month) Q1 = 1 meal/month Q2 = 3 meals/month %ΔQ = = P1 = 10$/meal P2 = 10$/2meals = 5$/meal => %ΔP =
Price elasticity of demand: Epd = =
The demand for the meals at the restaurant is elastic.
b) Explain what impact the promotional vouchers had on the Binh’s monthly
expenditure on meals at this restaurant. Is the change in total expenditure
consistent with the value of demand you calculate?
- Promotional vouchers increased Binh’s monthly expenditure on meals at this restaurant.
- The change in total expenditure is consistent with the value of demand because the Epd is
still higher than 1, which means we can still decrease the price for a higher total revenue. Exercise 4: a, DEMAND
The price elasticity of demand for apartments is 1.0 → E D P = 1.0
It means that when % P ↑↓ 1 %, % Qd ↓↑ 1%
The initial price of rental apartments is $400 and the initial quantity is 1000 apartments.
When the price of rental apartments increases 1%, then PC (the price of rental
apartments at that time) is $404. The quantity decreases 1% and becomes QC = 990 apartments.
Similarly, PB (the price of rental decreases 1%) = $396. QB (the quantity at that time) = 1010 apartments. P Q a 400 1000 P 396 1010 C 404 990 C P SUPPLY
The price elasticity of sully of apartments is 0.5 -> E S P =0.5. It means that when %P 2%, %Qs ↑↓ 1% ↑↓
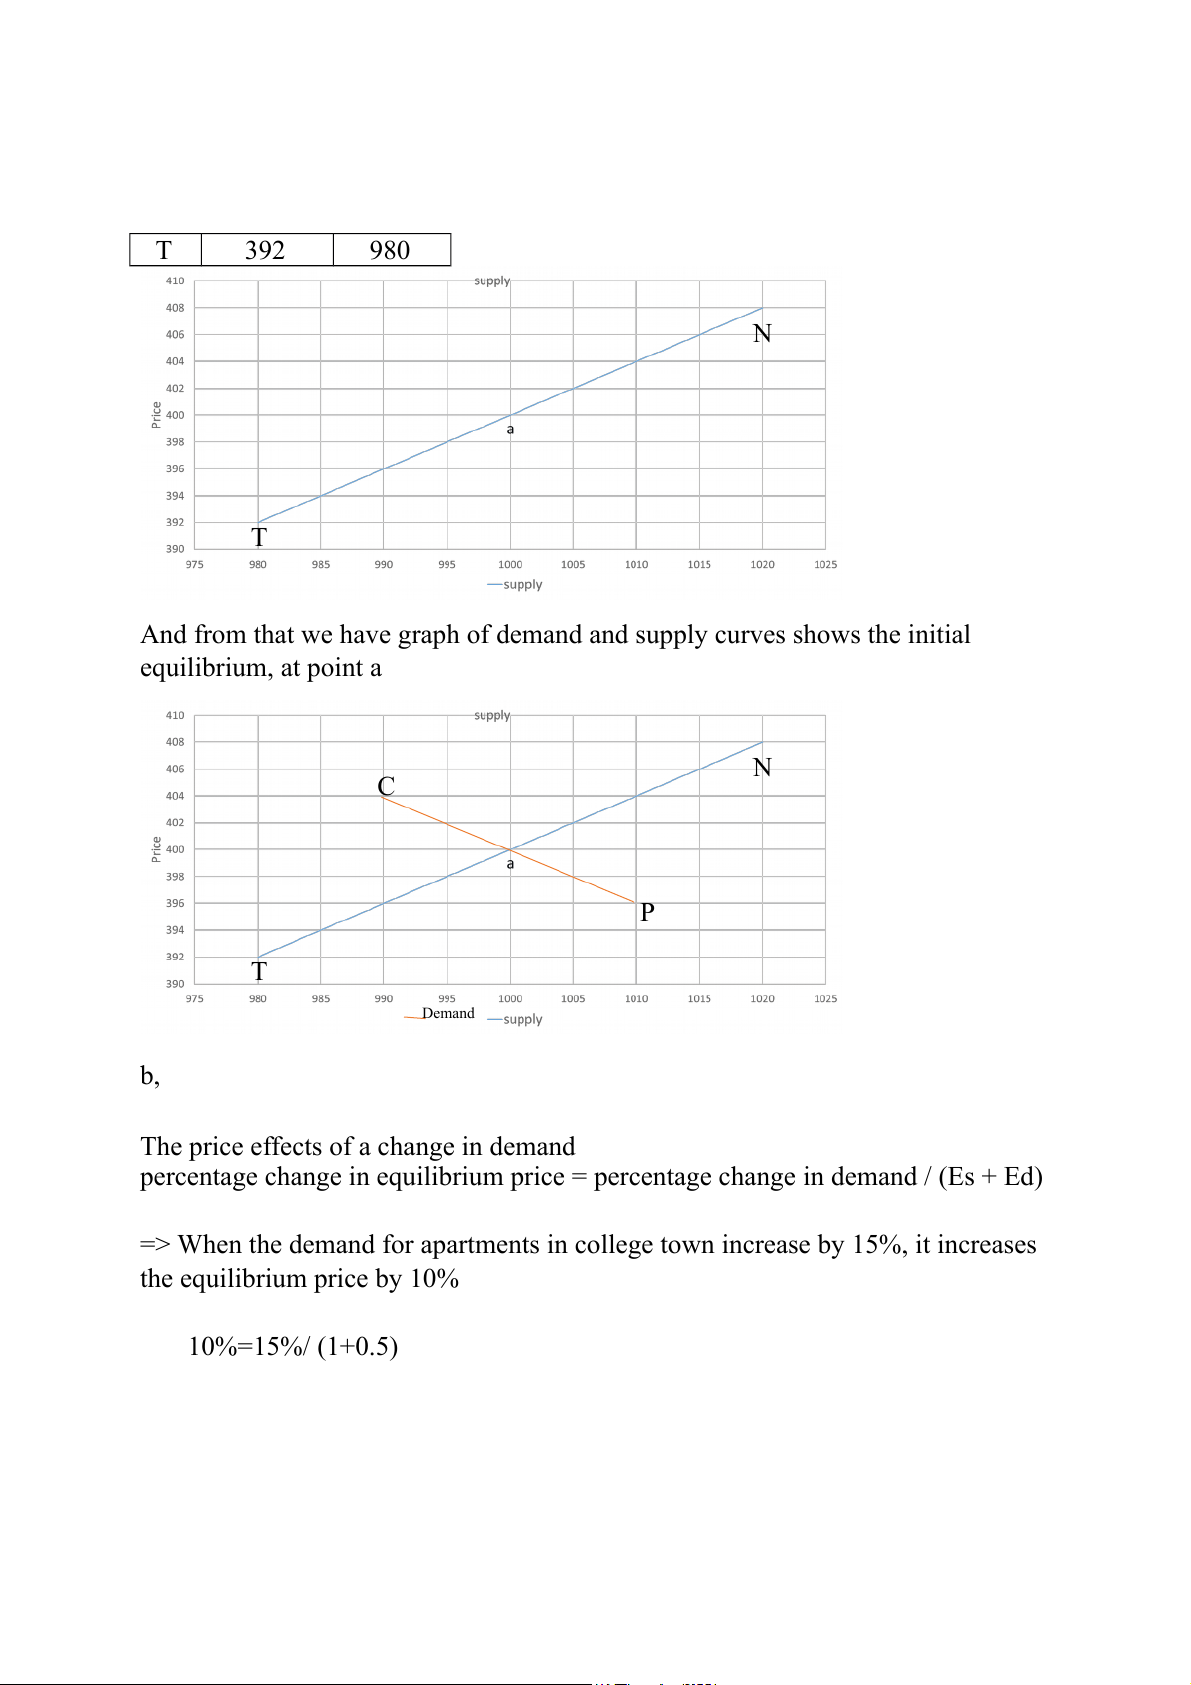
Similarly with demand, we have the following table for supply P Q a 400 1000 N 408 1020 T 392 980 N T
And from that we have graph of demand and supply curves shows the initial equilibrium, at point a N C P T Demand b,
The price effects of a change in demand
percentage change in equilibrium price = percentage change in demand / (Es + Ed)
=> When the demand for apartments in college town increase by 15%, it increases the equilibrium price by 10% 10%=15%/ (1+0.5) W N C b a Q T P
c. Predict the effect of the increase in demand on the equilibrium price of apartments.
Percentage change in equilibrium price is %15/(1+0.5) = 10%
So, if an increase in college enrollment is expected to increase the demand for
apartments in college town by 15%, new equilibrium price of apartments is: 400. (100%+10%) = 440 $
The initial demand equation is P = 800 - 0.4Qd
=> The after-demand equation is: 1.1P = 800 - 0.4*1.15Qd => P = 800/11 - 23/50Qd Exercise 5:
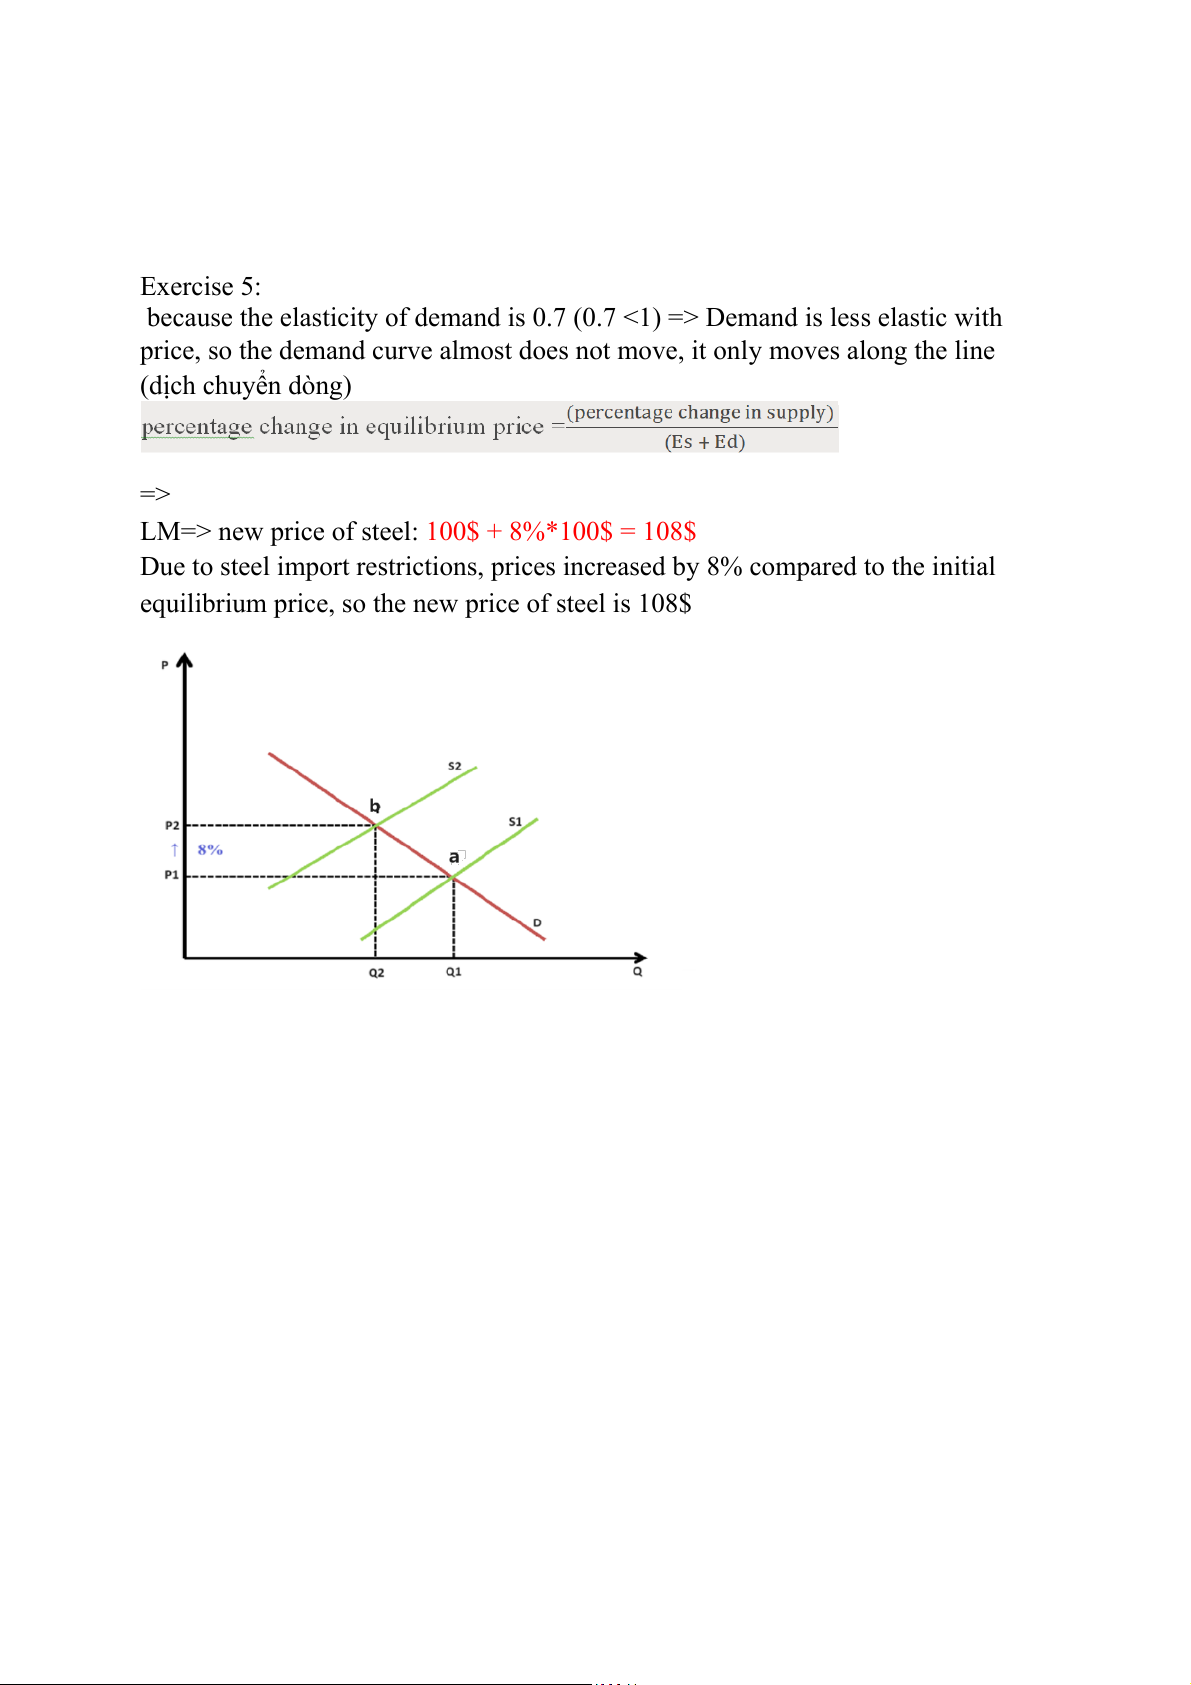
because the elasticity of demand is 0.7 (0.7 <1) => Demand is less elastic with
price, so the demand curve almost does not move, it only moves along the line (dịch chuyển dòng) =>
LM=> new price of steel: 100$ + 8%*100$ = 108$
Due to steel import restrictions, prices increased by 8% compared to the initial
equilibrium price, so the new price of steel is 108$
Tài liệu liên quan:
-

Chương 3: độ co giãn và các nhân tố ảnh hưởng | Microeconomics | Trường Đại học Quốc tế, Đại học Quốc gia Thành phố Hồ Chí Minh
4 2 -

Microeconomics Syllabus | Microeconomics | Trường Đại học Quốc tế, Đại học Quốc gia Thành phố Hồ Chí Minh
4 2 -

Microeconomics Course Syllabus & Assessment Details | Microeconomics | Trường Đại học Quốc tế, Đại học Quốc gia Thành phố Hồ Chí Minh
4 2 -

Assignment 3 - Elasticity MCQs and Key Concepts | Microeconomics | Trường Đại học Quốc tế, Đại học Quốc gia Thành phố Hồ Chí Minh
4 2 -

Assignment 2 - Economic Equilibrium Analysis of Fridges and Motorcycles | Microeconomics | Trường Đại học Quốc tế, Đại học Quốc gia Thành phố Hồ Chí Minh
4 2