Bài kiểm tra số 5_Bùi Thị Hoài| BT Tin học ứng dụng trong QLCL| Trường Đại học Bách Khoa Hà Nội

Bài kiểm tra số 5_Bùi Thị Hoài| BT Tin học ứng dụng trong QLCL| Trường Đại học Bách Khoa Hà Nội. Tài liệu gồm 7 trang giúp bạn ôn tập và đạt kết quả cao trong kỳ thi sắp tới. Mời bạn đọc đón xem.

Trường:

Đại học Bách Khoa Hà Nội 2.8 K tài liệu

Thông tin:
7 trang 4 tháng trước

Bình luận

Vui lòng đăng nhập hoặc đăng ký để gửi bình luận.

Bài kiểm tra số 5_Bùi Thị Hoài| BT Tin học ứng dụng trong QLCL| Trường Đại học Bách Khoa Hà Nội

Bài kiểm tra số 5_Bùi Thị Hoài| BT Tin học ứng dụng trong QLCL| Trường Đại học Bách Khoa Hà Nội. Tài liệu gồm 7 trang giúp bạn ôn tập và đạt kết quả cao trong kỳ thi sắp tới. Mời bạn đọc đón xem.

61 31 lượt tải Tải xuống
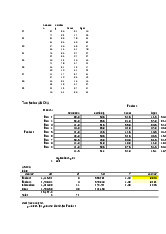
heineken
carsberg
hanoi
tiger
S1
61
68
64
48
71
39
41
35
S2
64
66
70
52
54
65
58
62
S3
27
58
56
57
55
45
54
70
S4
15
65
31
37
31
65
31
37
S5
28
29
28
25
14
70
57
22
S6
25
64
49
47
53
43
54
32
S7
44
47
61
54
57
43
65
49
S8
25
62
45
45
59
46
51
37
S9
34
49
67
57
48
52
68
52
Two factor ANOVA
Factor 2
Means:
carsberg
hanoi
tiger
Row 1
66.0
53.5
52.5
41.5
53.4
Row 2
59.0
65.5
64.0
57.0
61.4
Row 3
41.0
51.5
55.0
63.5
52.8
Row 4
23.0
65.0
31.0
37.0
39.0
Factor 1
Row 5
21.0
49.5
42.5
23.5
34.1
Row 6
39.0
53.5
51.5
39.5
45.9
Row 7
50.5
45.0
63.0
51.5
52.5
Row 8
42.0
54.0
48.0
41.0
46.3
Row 9
41.0
50.5
67.5
54.5
53.4
54.2
52.8
45.4
48.7
2
ANOVA
table
Source
SS
MS
F
p-value
Factor 1
4,445.61
555.701
4.20
.0013
Factor 2
1,730.82
576.940
4.36
.0102
Interaction
4,313.06
179.711
1.36
.1995
Error
4,768.50
132.458
Total
15,257.99
Post hoc analysis
p-values for pairwise t-tests for Factor 1
Row 4
Row 6
Row 8
Row
7
39.0
45.9
46.3
52.5
Row 5
34.1
Row 4
39.0
.4025
Row 6
45.9
.0485
.2400
Row 8
46.3
.0421
.2158
.9484
Row 7
52.5
.0029
.0246
.2572
.2847
Row 3
52.8
.0026
.0222
.2400
.2661
.9656
Row 1
53.4
.0019
.0172
.2007
.2237
.8800
Row 9
53.4
.0019
.0172
.2007
.2237
.8800
Row 2
61.4
3.36E-05
.0004
.0107
.0125
.1318
Tukey simultaneous comparison t-values (d.f. = 36)
Row 4
Row 6
Row 8
Row
7
39.0
45.9
46.3
52.5
Row 5
34.1
Row 4
39.0
0.85
Row 6
45.9
2.04
1.19
Row 8
46.3
2.11
1.26
0.07
Row 7
52.5
3.19
2.35
1.15
1.09
Row 3
52.8
3.24
2.39
1.19
1.13
0.04
Row 1
53.4
3.35
2.50
1.30
1.24
0.15
Row 9
53.4
3.35
2.50
1.30
1.24
0.15
Row 2
61.4
4.74
3.89
2.69
2.63
1.54
critical values for experimentwise error rate:
3.30
3.93
Post hoc analysis
p-values for pairwise t-tests for Factor 2
tiger
hanoi
carsberg
45.4
52.8
54.2
heineken
42.5
tiger
45.4
.4478
hanoi
52.8
.0111
.0639
carsberg
54.2
.0042
.0281
.7087
Tukey simultaneous comparison t-values (d.f. = 36)
tiger
hanoi
carsberg
45.4
52.8
54.2
heineken
42.5
tiger
45.4
0.77
hanoi
52.8
2.68
1.91
carsberg
54.2
3.06
2.29
0.38
critical values for experimentwise error rate:
2.70
3.35
2. Ch tiêu sourness
heineken
carsber
g
hanoi
tiger
s1
45
31
68
70
23
81
69
67
s2
71
60
60
83
62
69
68
68
s3
69
67
64
78
64
60
70
70
s4
50
68
54
49
56
68
54
49
s5
75
53
54
46
56
68
28
57
s6
35
58
61
73
62
30
57
28
s7
72
61
60
69
53
70
50
65
s8
45
61
57
78
58
36
63
35
s9
78
65
62
65
Phân tích s liu:
Two factor ANOVA
Factor 2
Means:
heineken
carsber
g
hanoi
tiger
s1
34.0
56.0
68.5
68.5
56.8
s2
66.5
64.5
64.0
75.5
67.6
s3
66.5
63.5
67.0
74.0
67.8
s4
53.0
68.0
54.0
49.0
56.0
Factor 1
s5
65.5
60.5
41.0
51.5
54.6
s6
48.5
44.0
59.0
50.5
50.5
s7
62.5
65.5
55.0
67.0
62.5
s8
51.5
48.5
60.0
56.5
54.1
s9
63.5
65.0
59.5
69.0
64.3
56.8
59.5
58.7
62.4
59.3
2
replications per
cell
ANOVA
table
Source
SS
df
MS
F
p-
value
Factor 1
2,551.1
9
8
318.89
9
1.80
.1095
Factor 2
289.04
3
96.347
0.54
.6555
Interaction
3,356.5
8
24
139.85
8
0.79
.7255
Error
6,379.5
0
36
177.20
8
Total
12,576.
32
71
Nhn xét: Các mu bia không khác nhau v ch tiêu sourness
3. Chỉ tiêu Bitterness
Two factor
ANOVA
Factor 2
Means
:
heineken
carsberg
hanoi
tiger
S1
58,0
43,0
49,5
56,5
51,8
S2
60,5
47,5
52,0
51,0
52,8
S3
54,5
59,0
56,0
56,5
56,5
S4
62,5
55,0
60,0
60,0
59,4
Factor 1
S5
57,5
47,5
52,0
58,5
53,9
S6
70,0
64,0
60,0
72,0
66,5
S7
60,5
51,0
56,5
58,0
56,5
S8
67,0
64,5
56,5
72,5
65,1
S9
55,5
57,0
55,5
58,0
56,5
60,7
54,3
55,3
60,3
57,7
2
replications per
cell
ANOVA
table
Source
SS
df
MS
F
p-
value
Factor 1
1.713,
69
8
214,212
2,16
,0552
Factor 2
594,71
3
198,236
2,00
,1319
Interaction
665,42
24
27,726
0,28
,9992
Error
3.574,
50
36
99,292
Total
6.548,
32
71
NhNha xét: Các loại bia không khác nhua về chỉ tiêu chất lượng Bitterness.
| 1/7

Preview text:

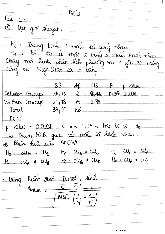
heineken carsberg hanoi tiger S1 61 68 64 48 71 39 41 35 S2 64 66 70 52 54 65 58 62 S3 27 58 56 57 55 45 54 70 S4 15 65 31 37 31 65 31 37 S5 28 29 28 25 14 70 57 22 S6 25 64 49 47 53 43 54 32 S7 44 47 61 54 57 43 65 49 S8 25 62 45 45 59 46 51 37 S9 34 49 67 57 48 52 68 52 Two factor ANOVA Factor 2 Means: heineken carsberg hanoi tiger Row 1 66.0 53.5 52.5 41.5 53.4 Row 2 59.0 65.5 64.0 57.0 61.4 Row 3 41.0 51.5 55.0 63.5 52.8 Row 4 23.0 65.0 31.0 37.0 39.0 Factor 1 Row 5 21.0 49.5 42.5 23.5 34.1 Row 6 39.0 53.5 51.5 39.5 45.9 Row 7 50.5 45.0 63.0 51.5 52.5 Row 8 42.0 54.0 48.0 41.0 46.3 Row 9 41.0 50.5 67.5 54.5 53.4 42.5 54.2 52.8 45.4 48.7 2 replications per cell ANOVA table Source SS df MS F p-value Factor 1 4,445.61 8 555.701 4.20 .0013 Factor 2 1,730.82 3 576.940 4.36 .0102 Interaction 4,313.06 24 179.711 1.36 .1995 Error 4,768.50 36 132.458 Total 15,257.99 71
Post hoc analysis
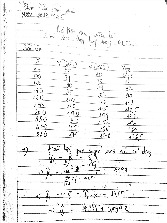
p-values for pairwise t-tests for Factor 1 Row Row 5 Row 4 Row 6 Row 8 7 34.1 39.0 45.9 46.3 52.5 Row 5 34.1 Row 4 39.0 .4025 Row 6 45.9 .0485 .2400 Row 8 46.3 .0421 .2158 .9484 Row 7 52.5 .0029 .0246 .2572 .2847 Row 3 52.8 .0026 .0222 .2400 .2661 .9656 Row 1 53.4 .0019 .0172 .2007 .2237 .8800 Row 9 53.4 .0019 .0172 .2007 .2237 .8800 Row 2 61.4 3.36E-05 .0004 .0107 .0125 .1318
Tukey simultaneous comparison t-values (d.f. = 36) Row Row 5 Row 4 Row 6 Row 8 7 34.1 39.0 45.9 46.3 52.5 Row 5 34.1 Row 4 39.0 0.85 Row 6 45.9 2.04 1.19 Row 8 46.3 2.11 1.26 0.07 Row 7 52.5 3.19 2.35 1.15 1.09 Row 3 52.8 3.24 2.39 1.19 1.13 0.04 Row 1 53.4 3.35 2.50 1.30 1.24 0.15 Row 9 53.4 3.35 2.50 1.30 1.24 0.15 Row 2 61.4 4.74 3.89 2.69 2.63 1.54
critical values for experimentwise error rate: 0.05 3.30 0.01 3.93
Post hoc analysis
p-values for pairwise t-tests for Factor 2 heineken tiger hanoi carsberg 42.5 45.4 52.8 54.2 heineken 42.5 tiger 45.4 .4478 hanoi 52.8 .0111 .0639 carsberg 54.2 .0042 .0281 .7087
Tukey simultaneous comparison t-values (d.f. = 36) heineken tiger hanoi carsberg 42.5 45.4 52.8 54.2 heineken 42.5 tiger 45.4 0.77 hanoi 52.8 2.68 1.91 carsberg 54.2 3.06 2.29 0.38
critical values for experimentwise error rate: 0.05 2.70 0.01 3.35
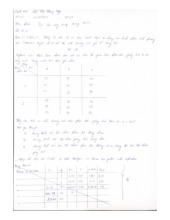
2. Chỉ tiêu sourness carsber heineken g hanoi tiger s1 45 31 68 70 23 81 69 67 s2 71 60 60 83 62 69 68 68 s3 69 67 64 78 64 60 70 70 s4 50 68 54 49 56 68 54 49 s5 75 53 54 46 56 68 28 57 s6 35 58 61 73 62 30 57 28 s7 72 61 60 69 53 70 50 65 s8 45 61 57 78 58 36 63 35 s9 78 65 62 65 Phân tích số liệu: Two factor ANOVA Factor 2 Means: carsber heineken g hanoi tiger s1 34.0 56.0 68.5 68.5 56.8 s2 66.5 64.5 64.0 75.5 67.6 s3 66.5 63.5 67.0 74.0 67.8 s4 53.0 68.0 54.0 49.0 56.0 Factor 1 s5 65.5 60.5 41.0 51.5 54.6 s6 48.5 44.0 59.0 50.5 50.5 s7 62.5 65.5 55.0 67.0 62.5 s8 51.5 48.5 60.0 56.5 54.1 s9 63.5 65.0 59.5 69.0 64.3 56.8 59.5 58.7 62.4 59.3 replications per 2 cell ANOVA table p- Source SS df MS F value 2,551.1 318.89 Factor 1 9 8 9 1.80 .1095 Factor 2 289.04 3 96.347 0.54 .6555 3,356.5 139.85 Interaction 8 24 8 0.79 .7255 6,379.5 177.20 Error 0 36 8 12,576. Total 32 71
Nhận xét: Các mẫu bia không khác nhau về chỉ tiêu sourness
3. Chỉ tiêu Bitterness Two factor ANOVA Factor 2 Means : heineken carsberg hanoi tiger S1 58,0 43,0 49,5 56,5 51,8 S2 60,5 47,5 52,0 51,0 52,8 S3 54,5 59,0 56,0 56,5 56,5 S4 62,5 55,0 60,0 60,0 59,4 Factor 1 S5 57,5 47,5 52,0 58,5 53,9 S6 70,0 64,0 60,0 72,0 66,5 S7 60,5 51,0 56,5 58,0 56,5 S8 67,0 64,5 56,5 72,5 65,1 S9 55,5 57,0 55,5 58,0 56,5 60,7 54,3 55,3 60,3 57,7 replications per 2 cell ANOVA table p- Source SS df MS F value 1.713, Factor 1 69 8 214,212 2,16 ,0552 Factor 2 594,71 3 198,236 2,00 ,1319 Interaction 665,42 24 27,726 0,28 ,9992 3.574, Error 50 36 99,292 6.548, Total 32 71 Two factor ANOVA Factor 2 Means : heineken carsberg hanoi tiger S1 58,0 43,0 49,5 56,5 51,8 S2 60,5 47,5 52,0 51,0 52,8 S3 54,5 59,0 56,0 56,5 56,5 S4 62,5 55,0 60,0 60,0 59,4 Factor 1 S5 57,5 47,5 52,0 58,5 53,9 S6 70,0 64,0 60,0 72,0 66,5 S7 60,5 51,0 56,5 58,0 56,5 S8 67,0 64,5 56,5 72,5 65,1 S9 55,5 57,0 55,5 58,0 56,5 60,7 54,3 55,3 60,3 57,7 replications per 2 cell ANOVA table p- Source SS df MS F value 1.713, Factor 1 69 8 214,212 2,16 ,0552 Factor 2 594,71 3 198,236 2,00 ,1319 Interaction 665,42 24 27,726 0,28 ,9992 3.574, Error 50 36 99,292 6.548, Total 32 71
NhNha xét: Các loại bia không khác nhua về chỉ tiêu chất lượng Bitterness.