Bài tập lớn: Tác động của chính sách tiền tệ đến tăng trưởng GDP môn Kinh tế vĩ mô | Học viện Ngân hàng
An economic growth rate is the percentage change in the value of all of the goods and services produced in a nation during a specific period of time, as compared to an earlier period (investopedia). Tài liệu được sưu tầm gồm 15 trang, giúp các bạn ôn luyện và phục vụ cho việc học tập, đạt kết quả tốt. Mời các bạn đón xem!
Môn: Kinh tế vĩ mô (ECO02A) 135 tài liệu
Trường: Học viện Ngân hàng 2.3 K tài liệu
Tác giả:


Preview text:
China's GDP Growth and Monetary Policy from 2010-2020 CHAPTER 1: THEORETICAL BASIS 1.1 GDP Growth 1.1.1 Definition
An economic growth rate is the percentage change in the value of all of the goods and services
produced in a nation during a specific period of time, as compared to an earlier period
(investopedia). The economic growth rate is used to measure the comparative health of an
economy over time. The numbers are usually compiled and reported quarterly and annually.
(investopedia, By James Chen Updated September 25, 2023)
1.1.2 Causes of GDP Growth (economicshelp 27 October 2019 by Tejvan Pettinger)
Monetary policy: Lower interest rates boost consumer spending and investment.
Higher wages: Increases disposable income, stimulating consumption.
Government spending: Directly raises demand and output.
Exchange rate changes: Devaluation boosts exports and reduces imports.
Consumer confidence: Encourages spending by reducing savings.
Tax reductions: Increase disposable income, driving consumption.
Rising asset prices: Create wealth effects, stimulating spending.
Financial stability: Promotes investment through better lending conditions. 1.1.3. Types of GDP Growth
Extensive Growth: This type is driven by increasing the quantity of inputs like labor and capital. For
instance, expanding the workforce or acquiring more machinery raises production. However, it may face
diminishing returns unless efÏciency improves.( imf.org by Michael Sarel)
Intensive Growth: This type results from enhancing productivity and efÏciency of existing resources
through technology, innovation, or better management. Intensive growth is more sustainable in the long
run, as it focuses on optimizing the use of current inputs rather than merely adding more.( imf.org, Michael Sarel ) 1.1.4
The impact of GDP growth on the economy Positive Impacts:
Increased Prosperity: Economic growth leads to higher production and consumption, resulting
in greater prosperity and improved living standards.( investopedia By The Investopedia Team Updated June 05, 2024)
Job Creation: Growth fosters job creation, reducing unemployment and boosting income levels.
Innovation and Technology: Economic expansion encourages innovation and technological
advancements, enhancing infrastructure and global competitiveness.( investopedia By The
Investopedia Team Updated June 05, 2024 ) Negative Impacts:
Resource Strain: Rapid growth can deplete finite resources, leading to environmental
degradation.( investopedia By The Investopedia Team Updated June 05, 2024)
Income Inequality: Economic growth can exacerbate income inequality, benefiting the wealthy more than the poor.
Inflation: Excessive growth can cause inflation, reducing purchasing power and potentially
leading to economic instabilit.( investopedia By The Investopedia Team Updated June 05, 2024) 1.2 Monetary Policy 1.2.1 Definition
Monetary policy is a set of tools used by a nation's central bank to control the overall money
supply and promote economic growth and employ strategies such as revising interest rates and
changing bank reserve requirements.( investopedia By The Investopedia Team Updated June 05, 2024) 1.2.2 Type of Monetary Policy Expansionary Monetary Policy:
Purpose: Implemented during recessions to combat high unemployment.
Mechanisms: Increases aggregate demand by lowering interest rates and increasing the
money supply through methods like buying government bonds and reducing reserve requirements. ( investopedia )
Effects: Stimulates consumer spending, increases private sector borrowing, reduces
unemployment, and promotes overall economic growth. Known as "easy monetary policy." (investopedia )
Risks: Potential for inflation, time lags in policy effects, and the challenge of knowing
when to transition to contractionary measures.( investopedia )
Contractionary Monetary Policy:
Purpose: Used when inflation is a concern to slow down the economy.( investopedia )
Mechanisms: Decreases the money supply and consumer spending by raising interest
rates, making borrowing more expensive. (investopedia )
Effects: Aims to control inflation and stabilize the economy. ( investopedia )
Risks: Can lead to economic slowdown and higher unemployment if implemented too aggressively. (investopedia)
1.2.3 Impact of China's Monetary Policy Domestic Impact:
Economic Stability: China's monetary policy aims to maintain economic stability by controlling
inflation and managing liquidity
Financial Markets: The People's Bank of China (PBOC) uses both interest rates and quantity-
based instruments to influence financial markets.
Growth and Investment: Policies can stimulate or cool down economic growth, affecting
investment and consumption patterns within China.( investopedia By Will Kenton Updated October 02, 2023) Global Impact:
Trade and Investment: Changes in China's monetary policy can influence global trade and
investment flows, given China's role as a major economic player
Commodity Markets: China's investment demand can affect commodity prices worldwide4
Economic Coordination: China's policy decisions can have spillover effects on other economies,
especially in Asia. (investopedia By Will Kenton Updated October 02, 2023)
Chapter 2 Analysis of China's GDP Growth and Monetary Policy from 2010-2020
2.1 China's GDP Growth and Monetary Policy from 2010 to 2020 2.1.1 from 2010 to 2015 GDP Growth
During this period, China's GDP growth gradually decreased from 10.6% in 2010 to 7.0% in
2015(World Bank Open Data,2024). After the global financial crisis, China experienced a strong
recovery thanks to large economic stimulus packages. However, starting in 2011, the
government began implementing measures to control inflation and mitigate asset bubbles,
resulting in a decline in growth to 9.6%. In 2012, GDP further dropped to 7.9% as the country
began restructuring its economy, shifting focus from exports and public investment to more
sustainable growth. By 2015, GDP had fallen to 7.0%, reflecting the difficulties in economic
restructuring, along with a weakening real estate market and increasing public debt (World Bank Open Data,2024). Monetary Policy
Post-Financial Crisis Recovery (2010-2012): China implemented stimulus measures to stabilize
the economy and support growth. The People's Bank of China (PBOC) focused on maintaining
economic stability by adjusting interest rates and reserve requirements.( The World Bank
Development Economics Vice Presidency Office of the Chief Economist October 2012)
Structural Reforms (2013-2015): Efforts were made to shift towards a more sustainable growth
model, reducing reliance on exports and investment-driven growth. The PBOC also dealt with
the effects of capital outflows and currency depreciation.( Asiasociety,2021) 2.2.2 From 2015 to 2020 GDP Growth
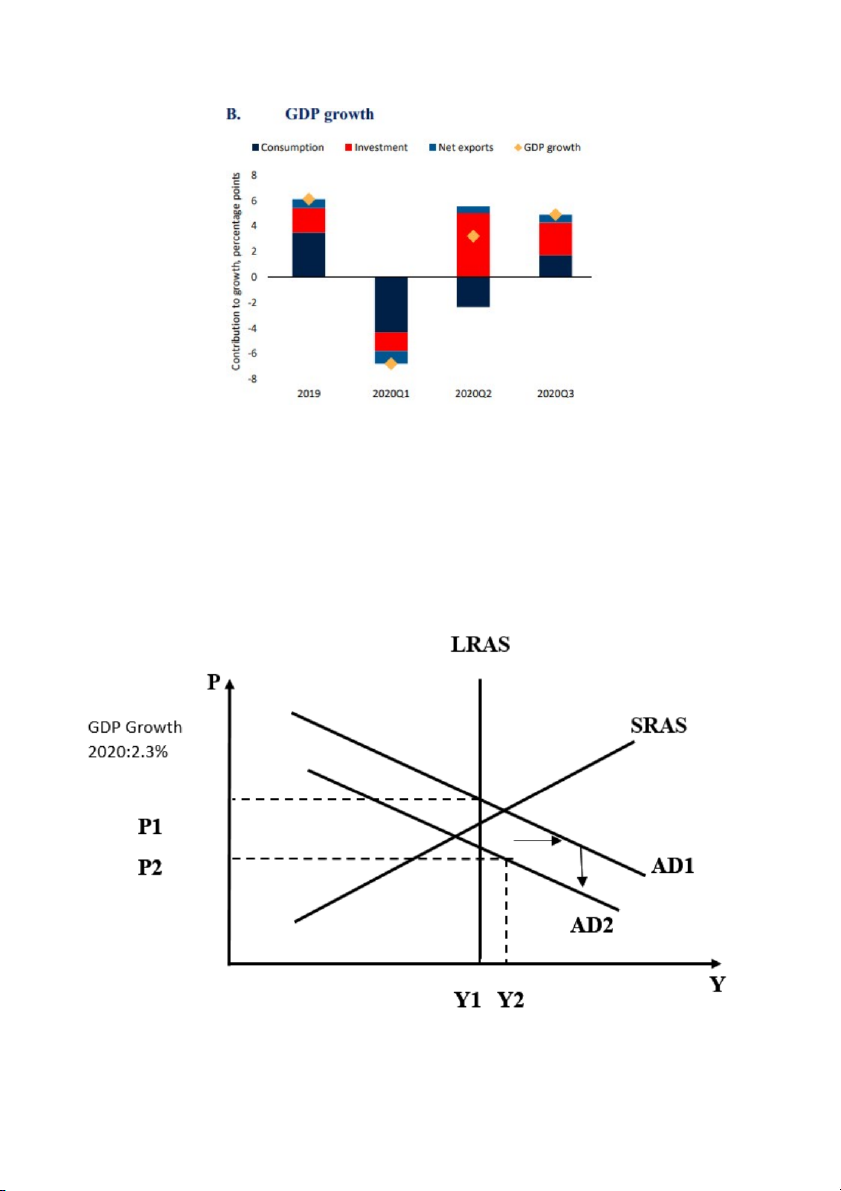
From 2015 to 2020, China's economy continued to slow down, with growth rates decreasing from 7.0% in
2015 to just 2.3% in 2020(Csis,2020). During this period, the government continued to promote economic
reforms and maintain strict financial controls, leading to a slight decline in growth to 6.8% in 2016, which
remained stable around this level until 2019(Merics,2019). However, trade tensions with the United
States in 2019 caused growth to drop to 6.1%, heavily impacting exports(Merics,2019).. By 2020, due to
the COVID-19 pandemic, China's GDP fell sharply to only 2.3%, marking the lowest growth rate of the
decade, as strict lockdowns and restrictions caused a significant economic downturn. (english.gov.cn,2021) Monetary Policy
2015-2016:Currency Devaluation: The People's Bank of China (PBOC) undertook a strategic
devaluation of the yuan with the objective of enhancing export competitiveness and addressing
the challenges posed by decelerating economic growth.
Monetary easing measures, encompassing the reduction of interest rates and the relaxation of
reserve requirements, were enacted to stimulate economic activity.( cigionline,2015)
Economic Slowdown: The growth rate of GDP experienced a deceleration to 6.8% in 2016,
attributable to the global economic downturn and inherent domestic structural challenges. ( investopedia,2023).
The graph illustrates the impact of China's devaluation of the yuan and monetary easing in 2015-
2016. The AD curve shifts to the right (from AD₁ to AD ₂
) due to economic stimulus measures:
devaluation increases export competitiveness, while interest rate cuts and reductions in reserve
requirements stimulate domestic investment and consumption. The new equilibrium point E ₁
shows higher output (Y₁ > Y ₀
), but GDP growth still slowed to 6.8% in 2016 due to the impact
of the global economic downturn and internal structural challenges in the Chinese economy. 2017:
Slight Recovery: The GDP growth rate exhibited a modest improvement, rising to 6.9% as a
consequence of the implementation of financial and monetary stimulus measures .( scmp,2021)
Focus on Financial Risks: The PBOC prioritized the management of financial risks while
simultaneously advocating for structural reforms within the financial sector.(scmp,2021).
The graph shows China's economic recovery in 2017 using the AD-AS model. Monetary and
fiscal stimulus shifted the AD curve to the right (from AD₁ to AD ₂
). At the same time, structural
reforms in the financial sector and better risk management efforts improved production
efficiency, as shown by the shift of the SRAS curve to the right. The new equilibrium point E ₂
represents higher output (Y₂ > Y₁) and more stable prices (P₂ < P ₁ ), reflected in an improved
GDP growth rate of 6.9%, while still ensuring the goal of controlling financial risks. 2018-2019:
Trade Tensions: Economic growth experienced a decline to 6.6% as a direct result of escalating
trade tensions with the United States. .(scmp,2021)
Government Investment: There was a notable increase in government investment directed toward
infrastructure projects, aimed at mitigating the adverse effects of trade tensions.2019: . (scmp,2021)
Further Deceleration: The growth rate of Gross Domestic Product (GDP) declined to 6.1% in the
context of persistent trade disputes and diminishing global demand.( jpmorgan,2019)
Monetary Accommodation: The People's Bank of China (PBOC) enacted a series of measures
aimed at bolstering the economy, which included reductions in interest rates and enhancements
in liquidity provision.(jpmorgan,2019).
The graph reflects the impact of US-China trade tensions and China's policy response in 2018-
2019. Trade tensions caused a negative supply shock, shifting the SRAS curve to the left due to
increased production costs and disruptions in the supply chain. In response, the Chinese
government increased investment in infrastructure, shifting the AD curve to the right (from AD ₁
to AD₂). The new equilibrium E shows lower output (Y ₂ < Y ₂ ) and higher prices (P ₁ > P ₂₁ ),
reflected in a slowdown in GDP growth to 6.6%. Although government stimulus measures
helped mitigate the negative impact of trade tensions, they could not prevent a slowdown in economic growth. 2020:
Consequences of COVID-19: The global pandemic precipitated a contraction in GDP growth to
2.3%, marking the lowest level observed in over forty years.( think.ing,2024)
Economic Revitalization: The PBOC initiated substantial liquidity provisions and interest rate
reductions to alleviate the adverse economic repercussions.2.2 Impact of Monetary Policy on GDP Growth. ( think.ing,2024).
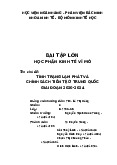
The graph illustrates the impact of the COVID-19 pandemic and China's policy response in
2020. Initially, the pandemic caused a severe supply shock, shifting the SRAS curve sharply to
the left due to lockdown measures and supply chain disruptions. The PBOC implemented a
strong monetary policy easing through liquidity injections and interest rate cuts, shifting the AD
curve significantly to the right (from AD₁ to AD ₂
). These measures, combined with effective
epidemic control, led to a partial recovery of the SRAS curve (to SRAS₃). As a result, the
economy reached a new equilibrium point E₃, with output lower than before the crisis but higher
than the crisis trough (Y < Y ₂₃₁
< Y ), reflected in a GDP growth rate of 2.3% - the lowest in
more than 40 years but still a remarkable achievement in the context of a global pandemic.
2.2 Impact of Monetary Policy on GDP Growth 2.2.1 From 2010 to 2012
From 2010 to 2011, the People's Republic of China (PRC) experienced robust GDP growth of
10.1%, driven by strong exports and significant government infrastructure investments as part of
a stimulus program to mitigate the impacts of the global financial crisis ( think.ing,2024).
However, in 2011, as inflation peaked at 6.5%, the People's Bank of China (PBOC) responded
by tightening monetary policy, increasing the reserve requirement ratio to 21.5% for major banks
and raising benchmark interest rates to 6.56%( think.ing,2024). These measures moderated GDP
growth to 9.2%, with slowed investment and potential dampening of overall economic
momentum despite continued strong consumption( think.ing,2024). In December 2011, the
Annual Central Economic Work Conference marked a policy shift toward prioritizing stable
economic growth over curbing inflation, maintaining an expansionary fiscal stance with a
projected fiscal deficit of 1.7% of GDP in 2012 to bolster domestic demand and social programs. ( think.ing,2024)
The aggregate supply-aggregate demand (AS-AD) model is a fundamental macroeconomic framework
that illustrates the relationship between price levels and real GDP through three critical curves: the Long-
run Aggregate Supply (LRAS), represented by a vertical blue line indicating potential GDP; the Short-run
Aggregate Supply (SRAS), shown as an upward-sloping blue curve; and the Aggregate Demand (AD),
depicted as downward-sloping red curves with both initial (AD ) and shifted (AD ₁₂ ) positions. The model
identifies crucial equilibrium points and measurements, including E , which marks the initial equilibrium ₁
where AD₁, SRAS, and LRAS intersect, along with corresponding price levels (P and P ₁₂ ) and real GDP measurements (Y₁ and Y ₂
). A notable feature of this framework is its ability to demonstrate economic
adjustments, such as a leftward shift in the AD curve from AD to AD ₁₂
, which results in both a decrease
in equilibrium output (from Y₁ to Y₂) and a reduction in price level (from P to P ₁₂ ). This comprehensive
model serves as an invaluable tool for economic analysis, enabling economists and policymakers to
understand and evaluate macroeconomic equilibrium, assess the impacts of economic shocks, analyze
price level and output adjustments, and distinguish between short-run and long-run effects of economic
changes, making it an essential framework for macroeconomic policy analysis and decision-making. 2.2.2 from 2013 to 2014
From 2013 to 2015, the People's Republic of China (PRC) focused on achieving sustainable growth and
reform, with GDP growth projected at
in 2013, supported by strong investment and consumption. 8.5%
The People's Bank of China (PBOC) adopted a relatively expansionary monetary policy, targeting 14%
growth in money supply (M2) and setting lending goals at CNY 8 trillion, while also regulating off-
balance-sheet credit activities to maintain financial stability(imf,2021). This accommodative policy
played a crucial role in driving high levels of fixed asset investment and private consumption, essential
for sustaining GDP growth. The government aimed to transition to a more market-based approach to
interest rates, aligning with the objectives of the 12th Five-Year Plan. Although the growth target was lowered to
to promote inclusive and environmentally sus 7.5%
tainable growth, actual GDP growth
surpassed expectations, reaching 8.7% in 2013(imf,2021). Meanwhile, inflation was projected to decline to approximately
due to moderating global commodity prices, fac 4.0% ilitating continued domestic
demand support without overheating the economy.( worldbank,2022).
During 2013-2015, China's macroeconomic landscape was shaped by significant policy initiatives and
structural reforms, beginning with the PBOC's implementation of an expansionary monetary policy that
targeted 14% M2 growth and established ambitious lending goals of CNY 8 trillion, while setting initial
GDP growth targets at 8.5% (later adjusted to 7.5%) and maintaining an inflation target of 4.0%. The
policy transmission mechanism manifested through a rightward shift in the aggregate demand curve (AD₁
to AD₂), driven by several key factors including increased money supply through M2 growth, elevated
lending levels, robust fixed asset investment, and strong private consumption. These policy measures led
to notable economic outcomes, evidenced by the movement from equilibrium E to E ₁₂ , with GDP growth
surpassing expectations at 8.7% (versus the 7.5% target), accompanied by moderate price level increases (P₁ to P ₂
) and significant output expansion (Y ₁ to Y ₂
), while inflation remained well-controlled due to
moderating global commodity prices, effective monetary policy management, and a balanced approach to
growth. The structural implications of this policy framework were far-reaching, supporting crucial
transitions toward market-based interest rates, promoting environmental sustainability goals, fostering
inclusive growth objectives, and maintaining financial stability through careful regulation of off-balance-
sheet activities, ultimately demonstrating China's commitment to balanced and sustainable economic
development while managing the complex interplay between growth objectives and structural reforms. 2.2.3 From 2015 to 2017
In 2015, the People's Bank of China (PBOC) devalued the yuan, cut interest rates, and reduced
reserve requirements to combat slowing growth. This resulted in GDP growth of 7%, the lowest
in 25 years(pbc.gov.cn,2015). By 2016, the PBOC continued its easing measures, which included
further interest rate cuts and reserve requirement reductions. This helped maintain GDP growth
at 6.8%, while the focus shifted towards economic reforms and reducing financial
risks(imf,2022). In 2017, these financial and monetary stimulus efforts bore fruit, leading to a
recovery with GDP growth improving to 6.9%.(imf,2022).
Since 2015, when GDP growth dropped to 7%—the lowest in 25 years—the People's Bank of China
(PBOC) implemented measures such as Yuan devaluation, interest rate cuts, and reductions in reserve
requirements to support the economy (initial equilibrium at E with AD ₁₁ ). In 2016, monetary easing
continued with further interest rate and reserve requirement cuts, along with reforms aimed at reducing
risk. This shifted the AD curve from AD to AD ₁₂
, stabilizing GDP growth at 6.8% (equilibrium at E ₂ ). By
2017, the policy measures’ effects became evident, with GDP growth improving to 6.9%, and AD
continued to shift rightward to AD₃, reaching equi ₃
librium at E . Key economic outcomes included
gradual output expansion (Y₁ → Y₂ → Y₃), moderate price level adjustments (P → P ₁₂₃ → P ), and stable
growth rates achieved through a balance between economic stimulus and reform. 2.2.4 From 2018 to 2019
China's GDP growth in 2018-2019 showed a slowdown in the economy, with growth reaching
only 6.1%, the lowest in nearly 30 years(countryeconomy,2019). This slowdown not only
reflected internal factors but was also affected by the global environment, especially trade
tensions. In response, the People's Bank of China implemented a loose monetary policy,
including cutting interest rates and reducing banks' reserve requirement ratios. These measures
were aimed at stimulating investment and consumption, two important factors contributing to
GDP growth. (countryeconomy,2019).
The graph shows the Chinese economic situation in 2018-2019 through the AD-AS model. The
AD curve shifted to the left (from AD₁ to AD ₂
) reflecting the decline in aggregate demand due to
global trade tensions and internal factors. In response, the People's Bank of China implemented a
loose monetary policy, including cutting interest rates and reserve requirement ratios to stimulate
investment and consumption. However, the GDP growth rate still only reached 6.1% - the lowest
level in nearly 30 years, reflected in the new equilibrium point located at the lower end of the SRAS curve. 2.2.5 From 2020
In 2020, China's economy recorded a GDP growth of 2.3%, a remarkable achievement in the
context of the COVID-19 pandemic that has severely impacted many other countries(imf,2021).
This growth is mainly due to the loose monetary policy implemented by the People's Bank of
China. Specifically, the bank has cut interest rates and increased money supply, helping
businesses overcome difficult times. These measures not only boost domestic consumption but
also encourage investment, especially in the infrastructure and technology sectors. However,
besides these successes, the article also warns of potential financial risks from maintaining loose
policies for too long, such as increasing debt or asset bubbles. Therefore, careful management of
monetary policy is essential to ensure sustainable growth in the future.(imf,2021).
The graph reflects the Chinese economy in 2020 through the AD-AS model. Initially, the COVID-19
pandemic caused a supply shock, shifting the SRAS curve to the left (SRAS to SRAS ₁₂ ). In response, the
People's Bank of China implemented a strong monetary easing policy, including cutting interest rates and
increasing money supply, shifting the AD curve to the right (from AD to AD ₁₂ ). These measures helped
stimulate consumption and investment, especially in the infrastructure and technology sectors, helping
China achieve a GDP growth rate of 2.3% - a remarkable achievement in the context of the pandemic.
However, maintaining a prolonged easing policy could lead to financial risks such as debt accumulation and asset bubbles.
https://www.investopedia.com/terms/e/economicgrowthrate.asp
https://www.economicshelp.org/macroeconomics/economic-growth/causes-economic-growth/
https://www.wallstreetmojo.com/gross-domestic-product-gdp/
https://www.financespiders.com/blog/the-positive-and-negative-impacts-of-economic-growth
https://www.investopedia.com/terms/m/monetarypolicy.asp
https://www.imf.org/en/Publications/WP/Issues/2022/04/29/Monetary-Policy-Transmission-and-
Policy-Coordination-in-China-517443
https://www.globaldata.com/data-insights/macroeconomic/real-gdp-growth-of-china-2089242/
http://www.pbc.gov.cn/eportal/fileDir/image_public/UserFiles/english/upload/File/MPR- 2015Q1-after%20nancy.pdf
https://muse.jhu.edu/article/856417
http://www.pbc.gov.cn/en/3688229/3688353/3688362/4211764/index.html
https://www.adb.org/sites/default/files/linked-documents/cps-prc-2011-2015-ea.pdf
https://www.frbsf.org/economic-research/wp-content/uploads/sites/4/Sun_slides_2017AEPC.pdf
https://www.reuters.com/article/business/instant-view-chinas-economic-growth-slows-to-61-in-
2019-near-30-year-low-idUSKBN1ZG092/
https://english.www.gov.cn/archive/statistics/202102/28/
content_WS603b3a56c6d0719374af9b5a.html
China GDP - Gross Domestic Product 2019 | countryeconomy.com
China's caution about loosening cross-border capital flows | Merics
Buyer Beware: China’s Uneven Financial Market Reform Presents Risks for Foreign Investors | New Perspectives on Asia | CSIS World Bank Document
https://www.scmp.com/economy/china-economy/article/3144769/chinas-2015-yuan-reform-sent- shock-waves-through-financial
Tài liệu liên quan:
-

Thực trạng tăng trưởng và chính sách tài khoá giai đoạn 2019-2022 của việt nam môn kinh tế vĩ mô| Học viện Ngân hàng
61 31 -

Bài tập lớn: Tác động chính sách tài khóa 2021-2024 môn Kinh tế vĩ mô | Học viện Ngân hàng
80 40 -
Bài tập lớn: Phân tích tình trạng lạm phát & chính sách tiền tệ 2020-2024 môn Kinh tế vĩ mô | Học viện Ngân hàng
69 35 -
Chương 2 - Dữ liệu Kinh tế Vĩ mô và đo lường GDP môn Kinh tế vĩ mô | Học viện Ngân hàng
52 26 -

Chương 4: Nền kinh tế mở - Khái niệm cơ bản và xuất nhập khẩu môn Kinh tế vĩ mô | Học viện Ngân hàng
48 24