Bài tập nhóm: Lý thuyết PPF & Cơ hội sản xuất | Microeconomics | Trường Đại học Quốc tế, Đại học Quốc gia Thành phố Hồ Chí Minh
If the economy is currently at point C: The opportunity to produce an additional 2 million vehicles from C to D is 9 thousand guided missiles. The additional cost of one million vehicles is nine of 2 = 4.5 thousand guided missiles The opportunity cost of producing six thousand more guided missiles from C to B is two million vehicles. Tài liệu được sưu tầm và soạn thảo dưới dạng file PDF để gửi tới các bạn cùng tham khảo, ôn tập đầy đủ kiến thức, chuẩn bị cho các buổi học thật tốt. Mời bạn đọc đón xem!
Môn: Microeconomics 635 tài liệu
Trường: Trường Đại học Quốc tế, Đại học Quốc gia Thành phố Hồ Chí Minh 1.9 K tài liệu
Tác giả:
Preview text:
Họ tên: Đặng Ngọc Mai. MSV: 11224009 Lớp: E-BDB4
Group assignment presentation 1
Exercise 1. Use the following production possibilities table for war goods and
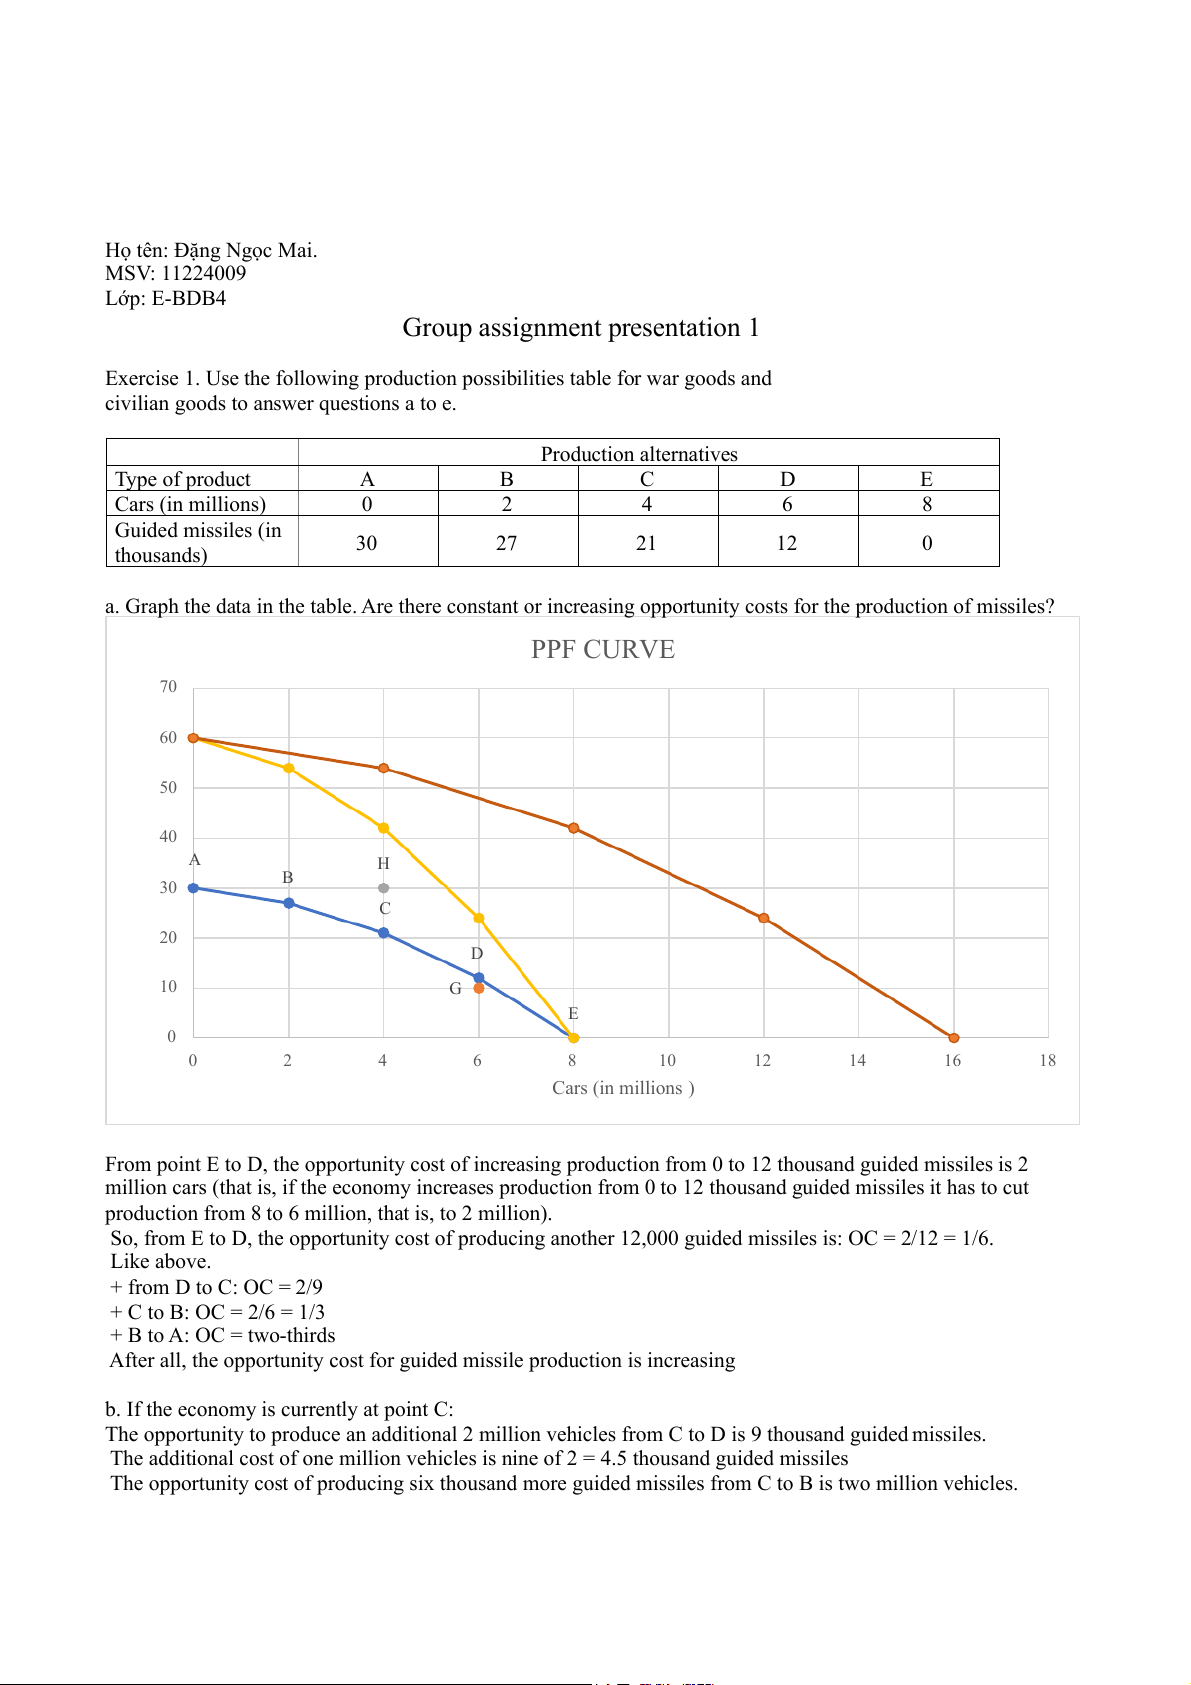
civilian goods to answer questions a to e. Production alternatives Type of product A B C D E Cars (in millions) 0 2 4 6 8 Guided missiles (in thousands) 30 27 21 12 0
a. Graph the data in the table. Are there constant or increasing opportunity costs for the production of missiles? PPF CURVE 70 60 50 40 A H B 30 issiles ( in thousands ) C 20 D ided m Gu 10 G E 0 0 2 4 6 8 10 12 14 16 18 Cars (in millions )
From point E to D, the opportunity cost of increasing production from 0 to 12 thousand guided missiles is 2
million cars (that is, if the economy increases production from 0 to 12 thousand guided missiles it has to cut
production from 8 to 6 million, that is, to 2 million).
So, from E to D, the opportunity cost of producing another 12,000 guided missiles is: OC = 2/12 = 1/6. Like above. + from D to C: OC = 2/9 + C to B: OC = 2/6 = 1/3 + B to A: OC = two-thirds
After all, the opportunity cost for guided missile production is increasing
b. If the economy is currently at point C:
The opportunity to produce an additional 2 million vehicles from C to D is 9 thousand guided missiles.
The additional cost of one million vehicles is nine of 2 = 4.5 thousand guided missiles
The opportunity cost of producing six thousand more guided missiles from C to B is two million vehicles.
Thus the cost of another thousand guided missiles is 2/6 = 0. (3) Million vehiclesc. Label a point G inside the
curve of the graph. What does it indicate?
c) Suppose Point G indicates that the economic output of cars and guided missiles is 6 million cars and 10,000
guided missiles. This means that the economy is inefficient in its production. Because if it makes six million cars,
the vast majority of its rockets could produce 12,000 guided missiles.
d) Suppose Point H indicates that the economic output of cars and guided missiles is 4 million cars and 30 thousand guided missiles.
It indicates the inability to use fixed resources of production. Because if it makes four million cars, the vast
majority of its missiles would be built at 22,000 guided missiles.
- Economies can achieve production levels at specified H points when and only if the availability of input factors
(such as human capital, technology, materials, etc.) transform inputs into outputs. For example, technological
advances may improve some aspects of automotive and missile alignment. If the economy takes modern
technology it can raise production to point H.
e) When technology is produced:
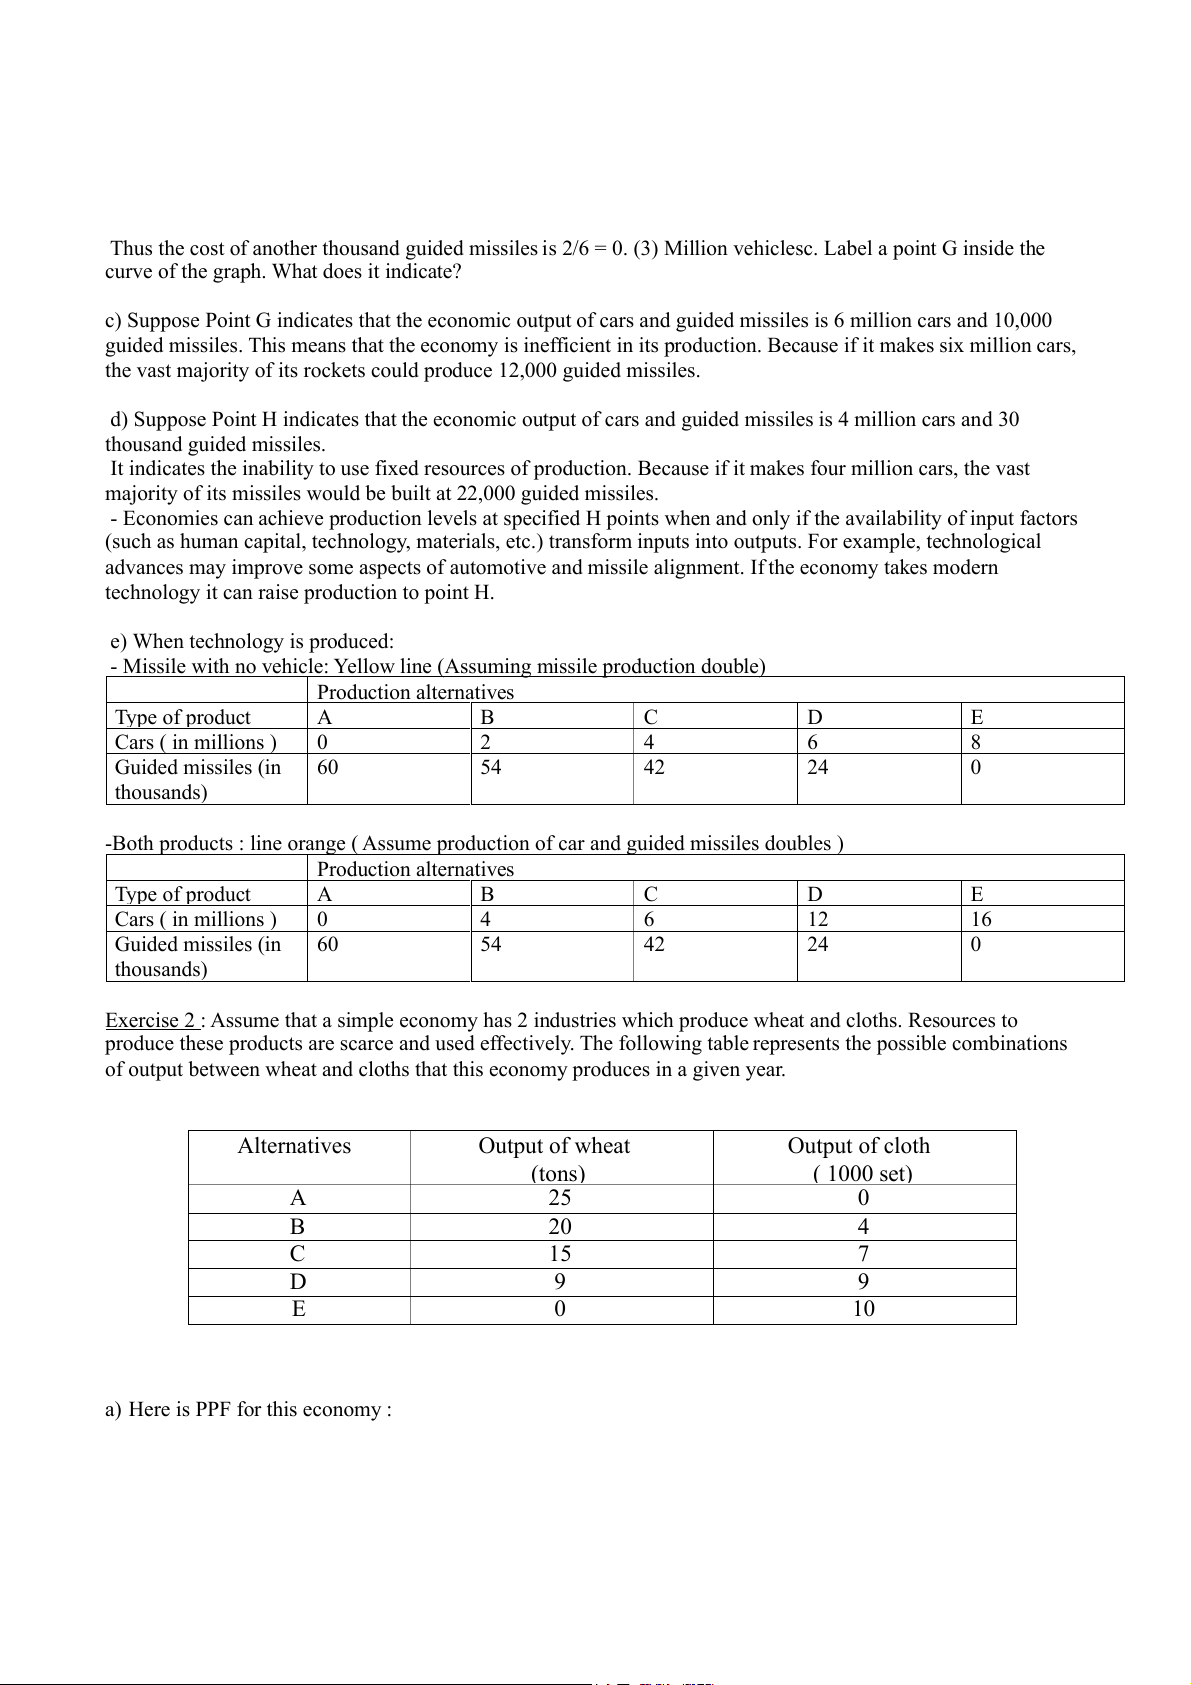
- Missile with no vehicle: Yellow line (Assuming missile production double) Production alternatives Type of product A B C D E Cars ( in millions ) 0 2 4 6 8 Guided missiles (in 60 54 42 24 0 thousands)
-Both products : line orange ( Assume production of car and guided missiles doubles ) Production alternatives Type of product A B C D E Cars ( in millions ) 0 4 6 12 16 Guided missiles (in 60 54 42 24 0 thousands)
Exercise 2 : Assume that a simple economy has 2 industries which produce wheat and cloths. Resources to
produce these products are scarce and used effectively. The following table represents the possible combinations
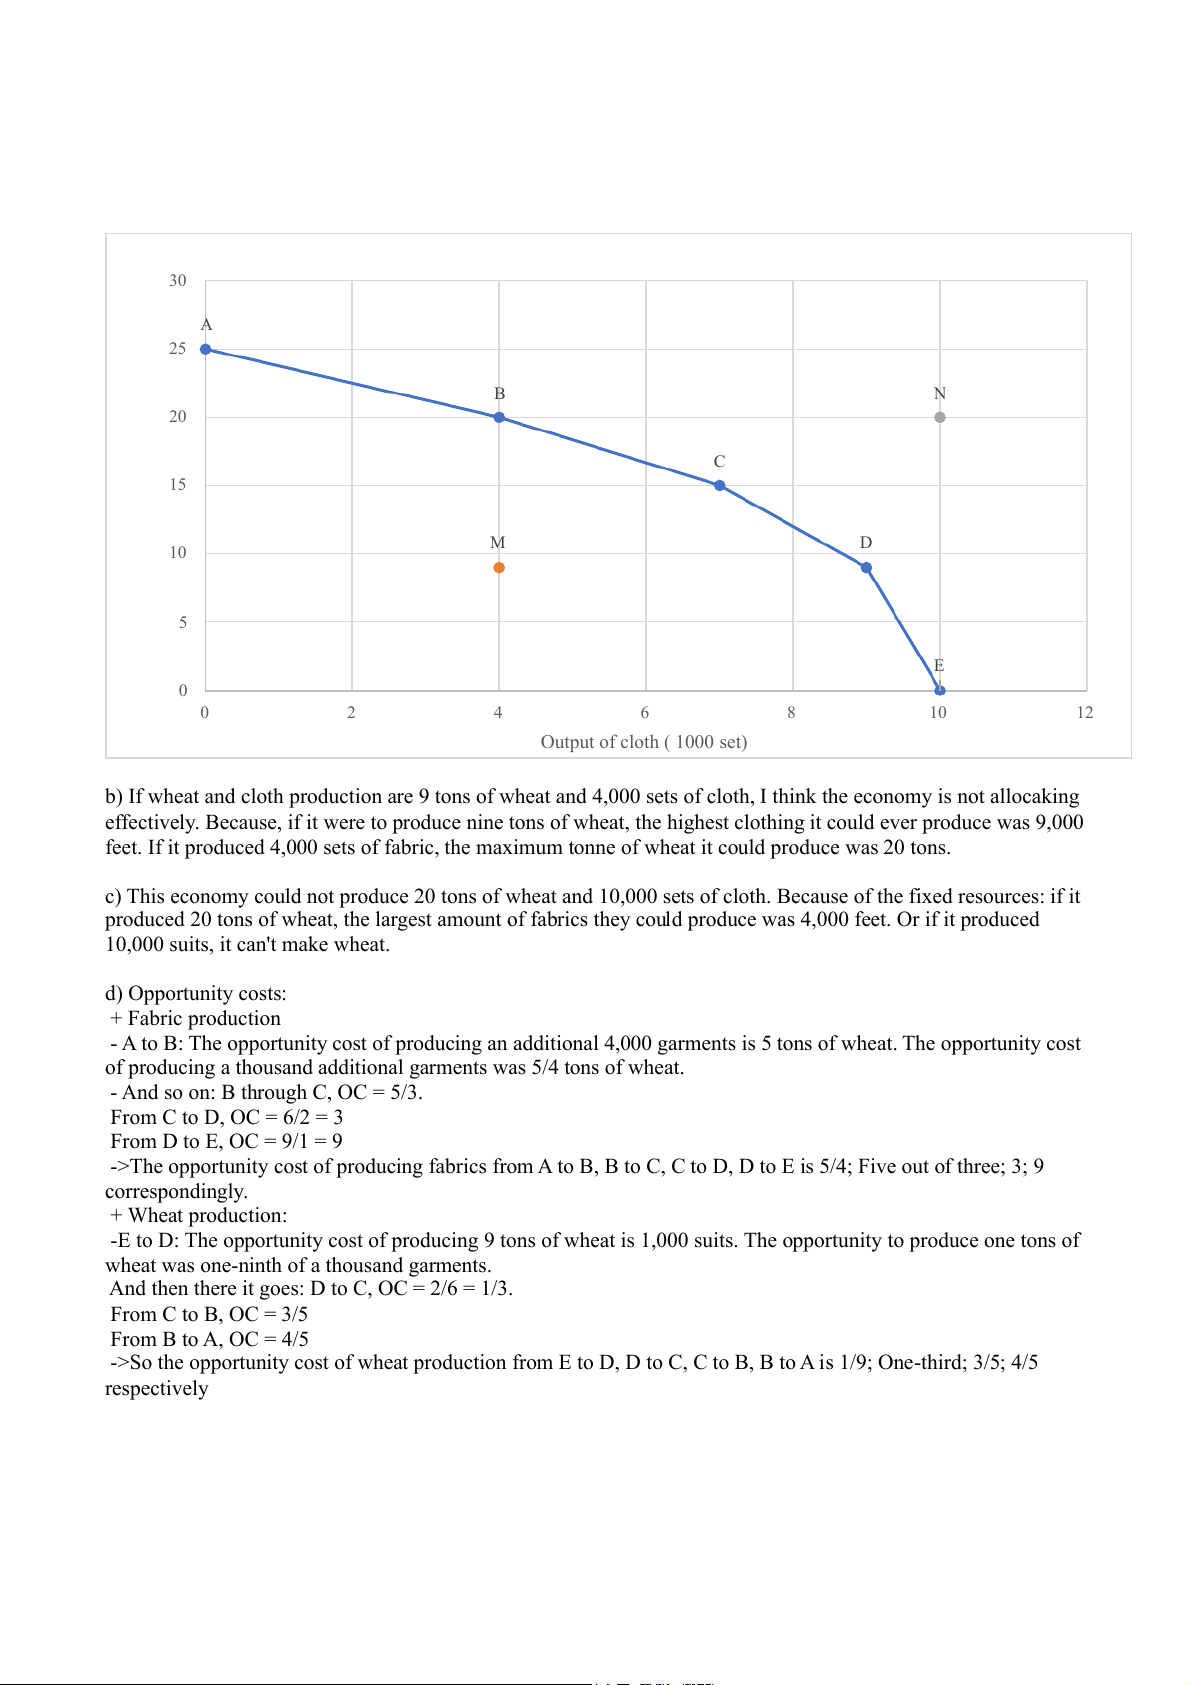
of output between wheat and cloths that this economy produces in a given year. Alternatives Output of wheat Output of cloth (tons) ( 1000 set) A 25 0 B 20 4 C 15 7 D 9 9 E 0 10
a) Here is PPF for this economy : 30 A 25 B N 20 C heat (tons) 15 M D utput of w 10 O 5 E 0 0 2 4 6 8 10 12 Output of cloth ( 1000 set)
b) If wheat and cloth production are 9 tons of wheat and 4,000 sets of cloth, I think the economy is not allocaking
effectively. Because, if it were to produce nine tons of wheat, the highest clothing it could ever produce was 9,000
feet. If it produced 4,000 sets of fabric, the maximum tonne of wheat it could produce was 20 tons.
c) This economy could not produce 20 tons of wheat and 10,000 sets of cloth. Because of the fixed resources: if it
produced 20 tons of wheat, the largest amount of fabrics they could produce was 4,000 feet. Or if it produced
10,000 suits, it can't make wheat. d) Opportunity costs: + Fabric production
- A to B: The opportunity cost of producing an additional 4,000 garments is 5 tons of wheat. The opportunity cost
of producing a thousand additional garments was 5/4 tons of wheat.
- And so on: B through C, OC = 5/3. From C to D, OC = 6/2 = 3 From D to E, OC = 9/1 = 9
->The opportunity cost of producing fabrics from A to B, B to C, C to D, D to E is 5/4; Five out of three; 3; 9 correspondingly. + Wheat production:
-E to D: The opportunity cost of producing 9 tons of wheat is 1,000 suits. The opportunity to produce one tons of
wheat was one-ninth of a thousand garments.
And then there it goes: D to C, OC = 2/6 = 1/3. From C to B, OC = 3/5 From B to A, OC = 4/5
->So the opportunity cost of wheat production from E to D, D to C, C to B, B to A is 1/9; One-third; 3/5; 4/5 respectively
Tài liệu liên quan:
-

Chương 3: độ co giãn và các nhân tố ảnh hưởng | Microeconomics | Trường Đại học Quốc tế, Đại học Quốc gia Thành phố Hồ Chí Minh
3 2 -

Microeconomics Syllabus | Microeconomics | Trường Đại học Quốc tế, Đại học Quốc gia Thành phố Hồ Chí Minh
3 2 -

Microeconomics Course Syllabus & Assessment Details | Microeconomics | Trường Đại học Quốc tế, Đại học Quốc gia Thành phố Hồ Chí Minh
3 2 -

Assignment 3 - Elasticity MCQs and Key Concepts | Microeconomics | Trường Đại học Quốc tế, Đại học Quốc gia Thành phố Hồ Chí Minh
3 2 -

Assignment 2 - Economic Equilibrium Analysis of Fridges and Motorcycles | Microeconomics | Trường Đại học Quốc tế, Đại học Quốc gia Thành phố Hồ Chí Minh
3 2