Chapter 15 - International Trade and Policy Insights | Microeconomics | Trường Đại học Quốc tế, Đại học Quốc gia Thành phố Hồ Chí Minh
The principle of comparative advantage tells us that we can all enjoy more goods and services when each country produces according to its comparative advantage, and then trades with other countries. Tài liệu được sưu tầm và soạn thảo dưới dạng file PDF với mục đích hỗ trợ học tập và tham khảo. Nội dung tài liệu được trình bày rõ ràng, dễ tiếp cận, phù hợp cho việc ôn tập và củng cố kiến thức trong quá trình học đại học. Đây sẽ là nguồn tư liệu hữu ích giúp các bạn sinh viên chuẩn bị tốt hơn cho các buổi học, đồng thời mở rộng thêm hiểu biết về môn học. Hy vọng tài liệu này sẽ mang lại nhiều giá trị và hỗ trợ các bạn trong hành trình học tập. Mời bạn đọc cùng tham khảo!
Môn: Microeconomics 635 tài liệu
Trường: Trường Đại học Quốc tế, Đại học Quốc gia Thành phố Hồ Chí Minh 1.9 K tài liệu
Tác giả:

Preview text:
Chapter 15
International Trade and Trade Policy
©2022 McGraw Hill. All rights reserved. Authorized only for instructor use in the classroom. No reproduction or distribution without the prior written consent of McGraw Hill. Learning Objectives
1. Explain and apply the concept of comparative advantage as a basis for trade.
2. Contrast the production and consumption opportunities in
a closed economy with that of an open economy using
the production possibilities curve.
3. Explain how the price of a tradable good is set in a
closed versus an open economy, how the quantities of
imports or exports are determined, and discuss who are
the winners and losers from trade.
4. Illustrate why trade is often politically controversial even
though it promises to increase total income. 2 ©2022 McGraw Hill.
Comparative Advantage as a Basis for Trade
• The principle of comparative advantage tells us that
we can all enjoy more goods and services when each
country produces according to its comparative
advantage, and then trades with other countries. 3 ©2022 McGraw Hill.
Production and Consumption Possibilities and the Benefits of Trade • Closed Economy
– An economy that does not trade with the rest of the world • Open Economy
– An economy that trades with other countries 4 ©2022 McGraw Hill.
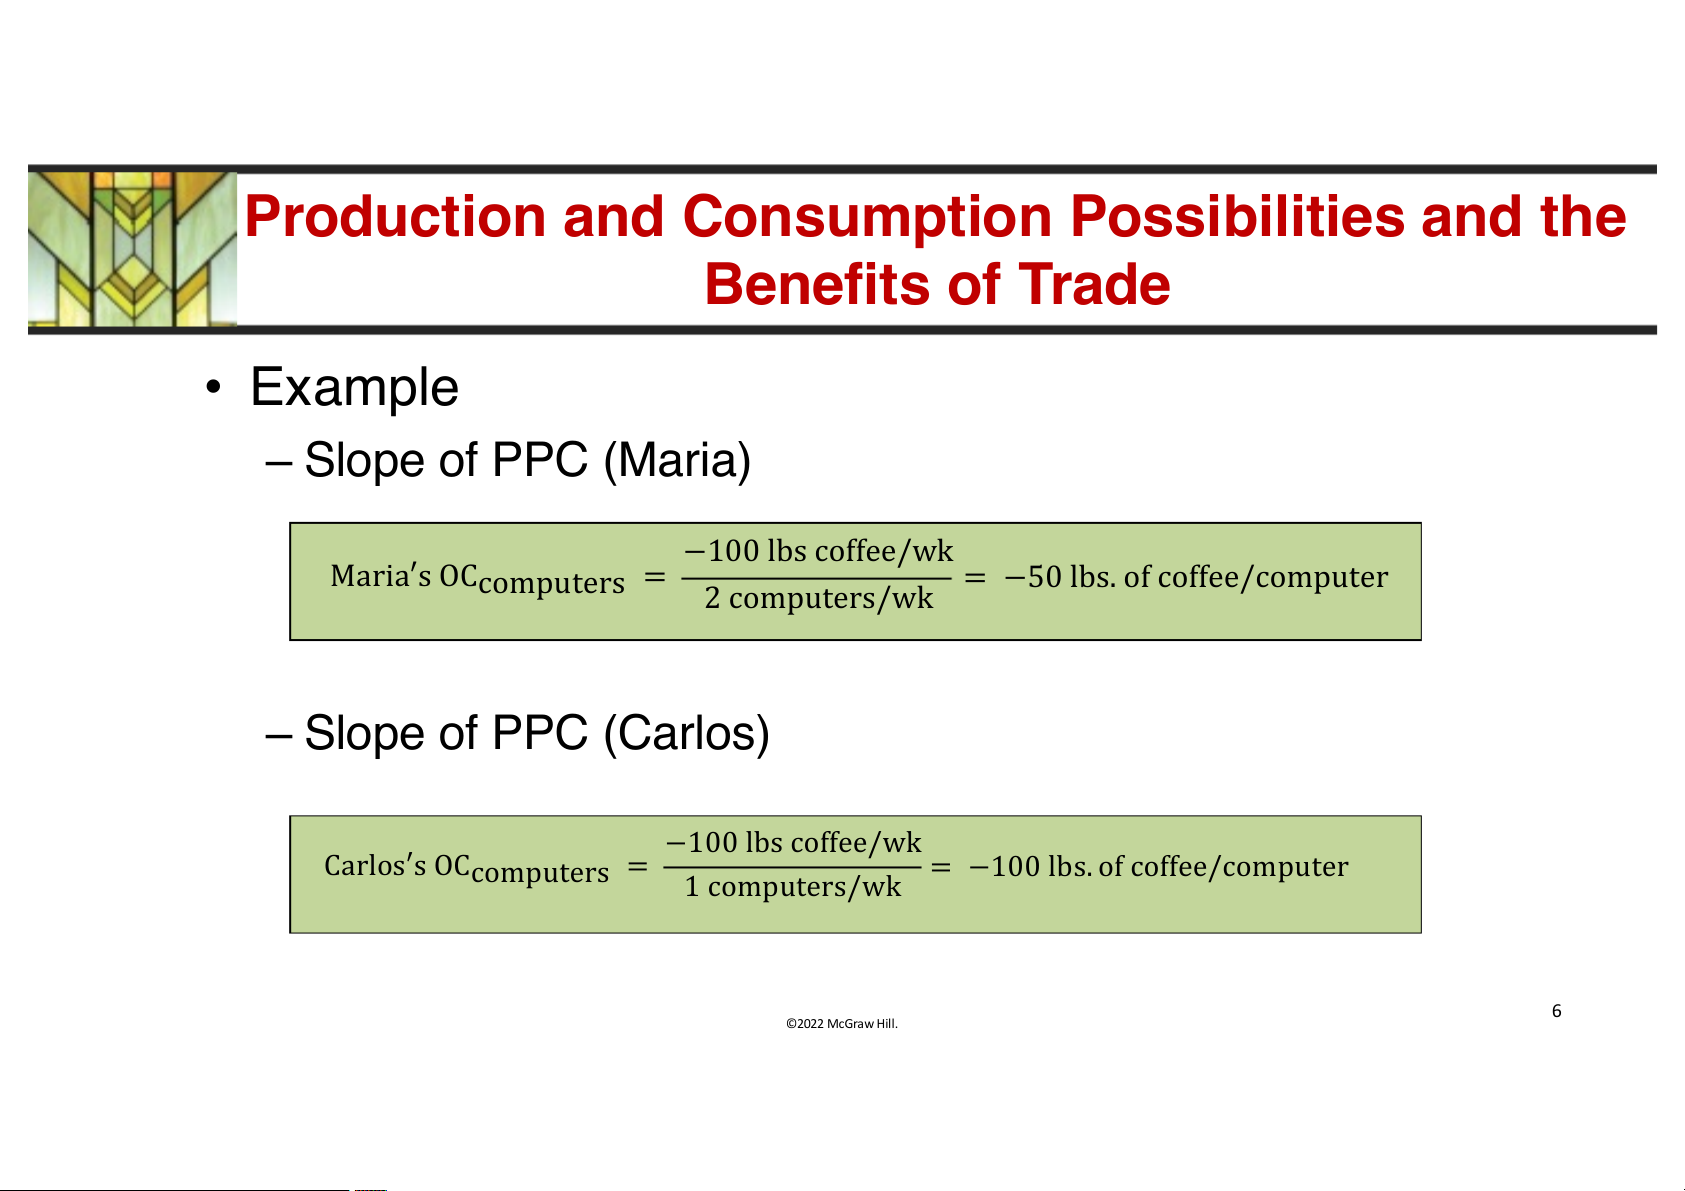
Production and Consumption Possibilities and the Benefits of Trade • Example
– Two good economy (Costa Rica) -- computers and coffee
– Two workers who work 50 weeks/year • Carlos
– Can produce 100 pounds/week or 1 computer • Maria
– Can produce 100 pounds/week or 2 computers 5 ©2022 McGraw Hill.
Production and Consumption Possibilities and the Benefits of Trade • Example – Slope of PPC (Maria) −100 lbs coffee/wk Maria′s OCcomputers =
= −50 lbs. of coffee/computer 2 computers/wk – Slope of PPC (Carlos) −100 lbs coffee/wk Carlos′s OCcomputers =
= −100 lbs. of coffee/computer 1 computers/wk 6 ©2022 McGraw Hill.
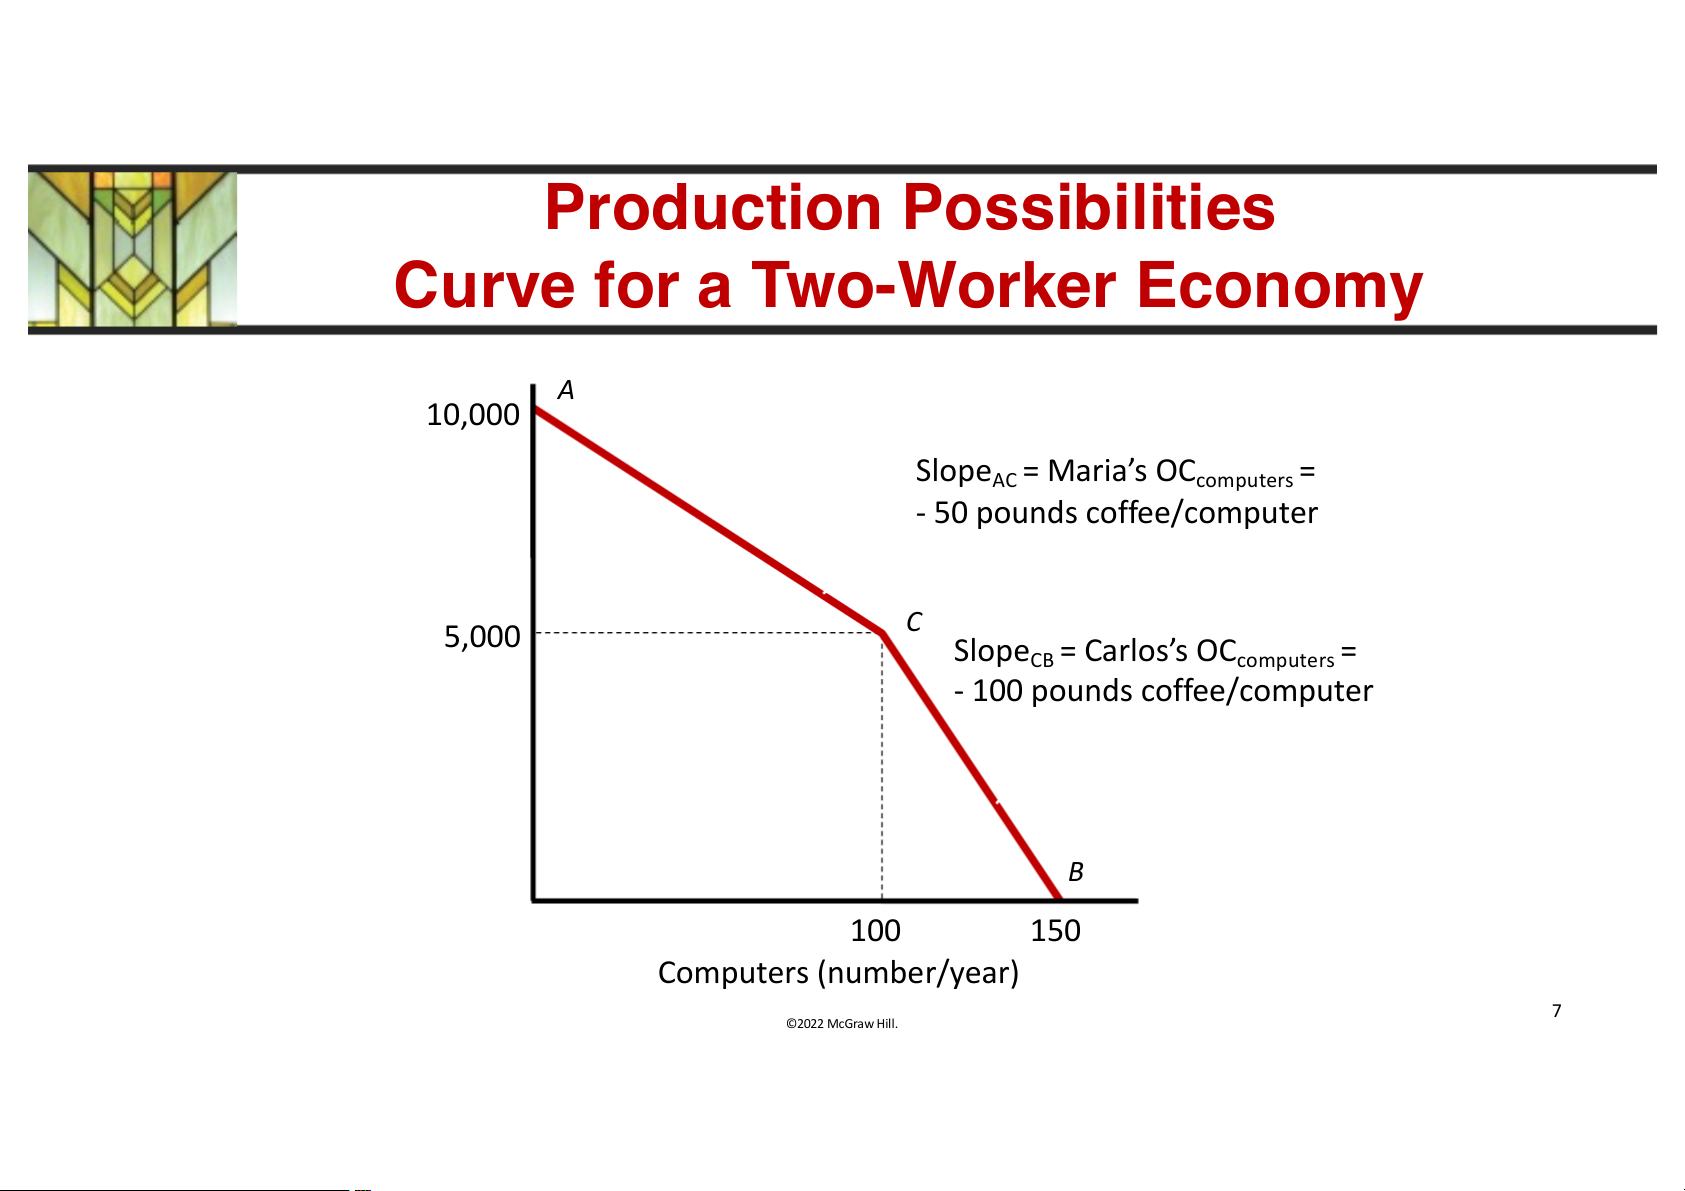
Production Possibilities
Curve for a Two-Worker Economy A 10,000 r) Slope = Maria’s OC = AC computers a e - 50 pounds coffee/computer s/y d n u o C 5,000 (p Slope = Carlos’s OC = CB computers e - 100 pounds coffee/computer ffe o C B 100 150 Computers (number/year) 7 ©2022 McGraw Hill.
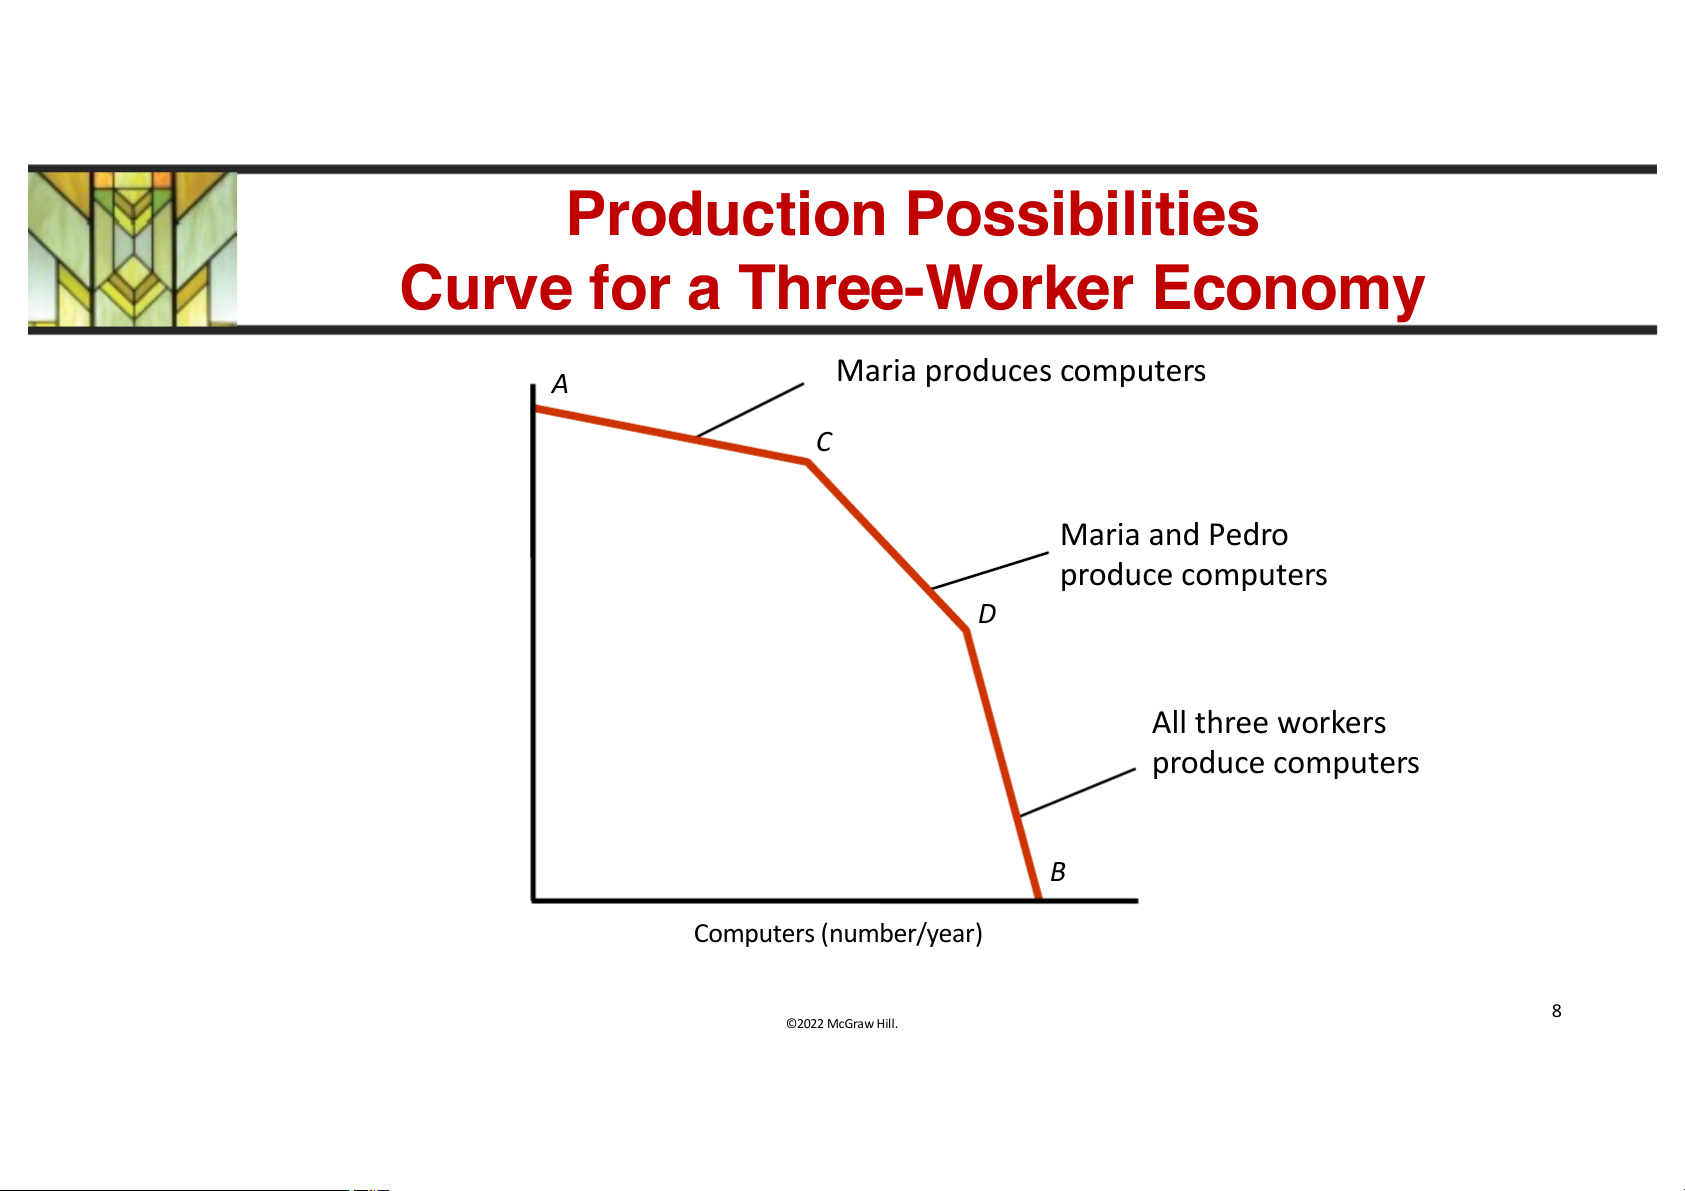
Production Possibilities
Curve for a Three-Worker Economy Maria produces computers A C r) a e Maria and Pedro s/y produce computers d n D u o (p e All three workers ffe o produce computers C B Computers (number/year) 8 ©2022 McGraw Hill.
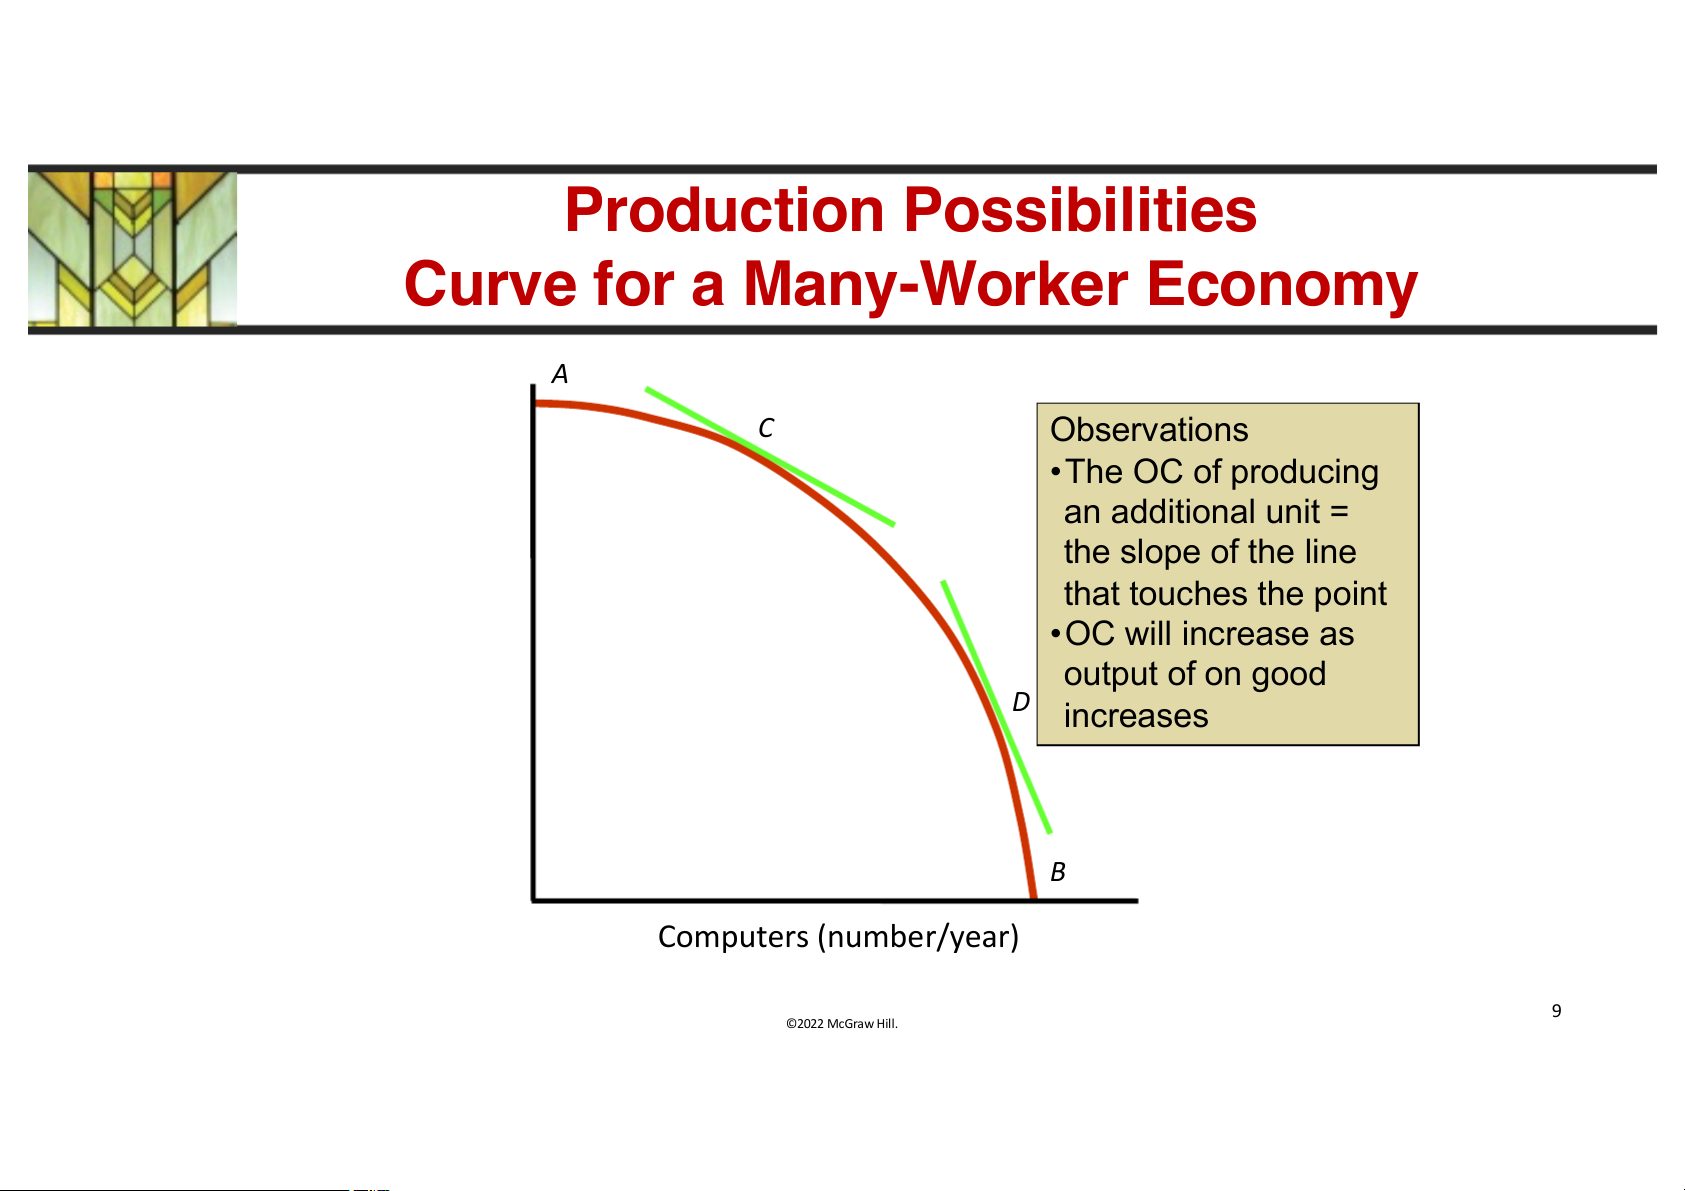
Production Possibilities
Curve for a Many-Worker Economy A C Observations •The OC of producing r) a an additional unit = e the slope of the line s/y d that touches the point n u o • OC will increase as (p output of on good e D increases ffe o C B Computers (number/year) 9 ©2022 McGraw Hill.
Production and Consumption
Possibilities and the Benefits of Trade
• A country’s PPC shows the quantities of different
goods that its economy can produce.
• Consumption Possibilities
– The combinations of goods and services that a country’s
citizens might feasibly consume 10 ©2022 McGraw Hill.
Production and Consumption
Possibilities and the Benefits of Trade • In a closed economy:
– Society’s production possibilities = consumption possibilities.
– If a country is self-sufficient and does not trade, it is called autarky. • In an open economy:
– The society’s consumption possibilities are typically greater
than its production possibilities. 11 ©2022 McGraw Hill.
Costa Rica’s Consumption
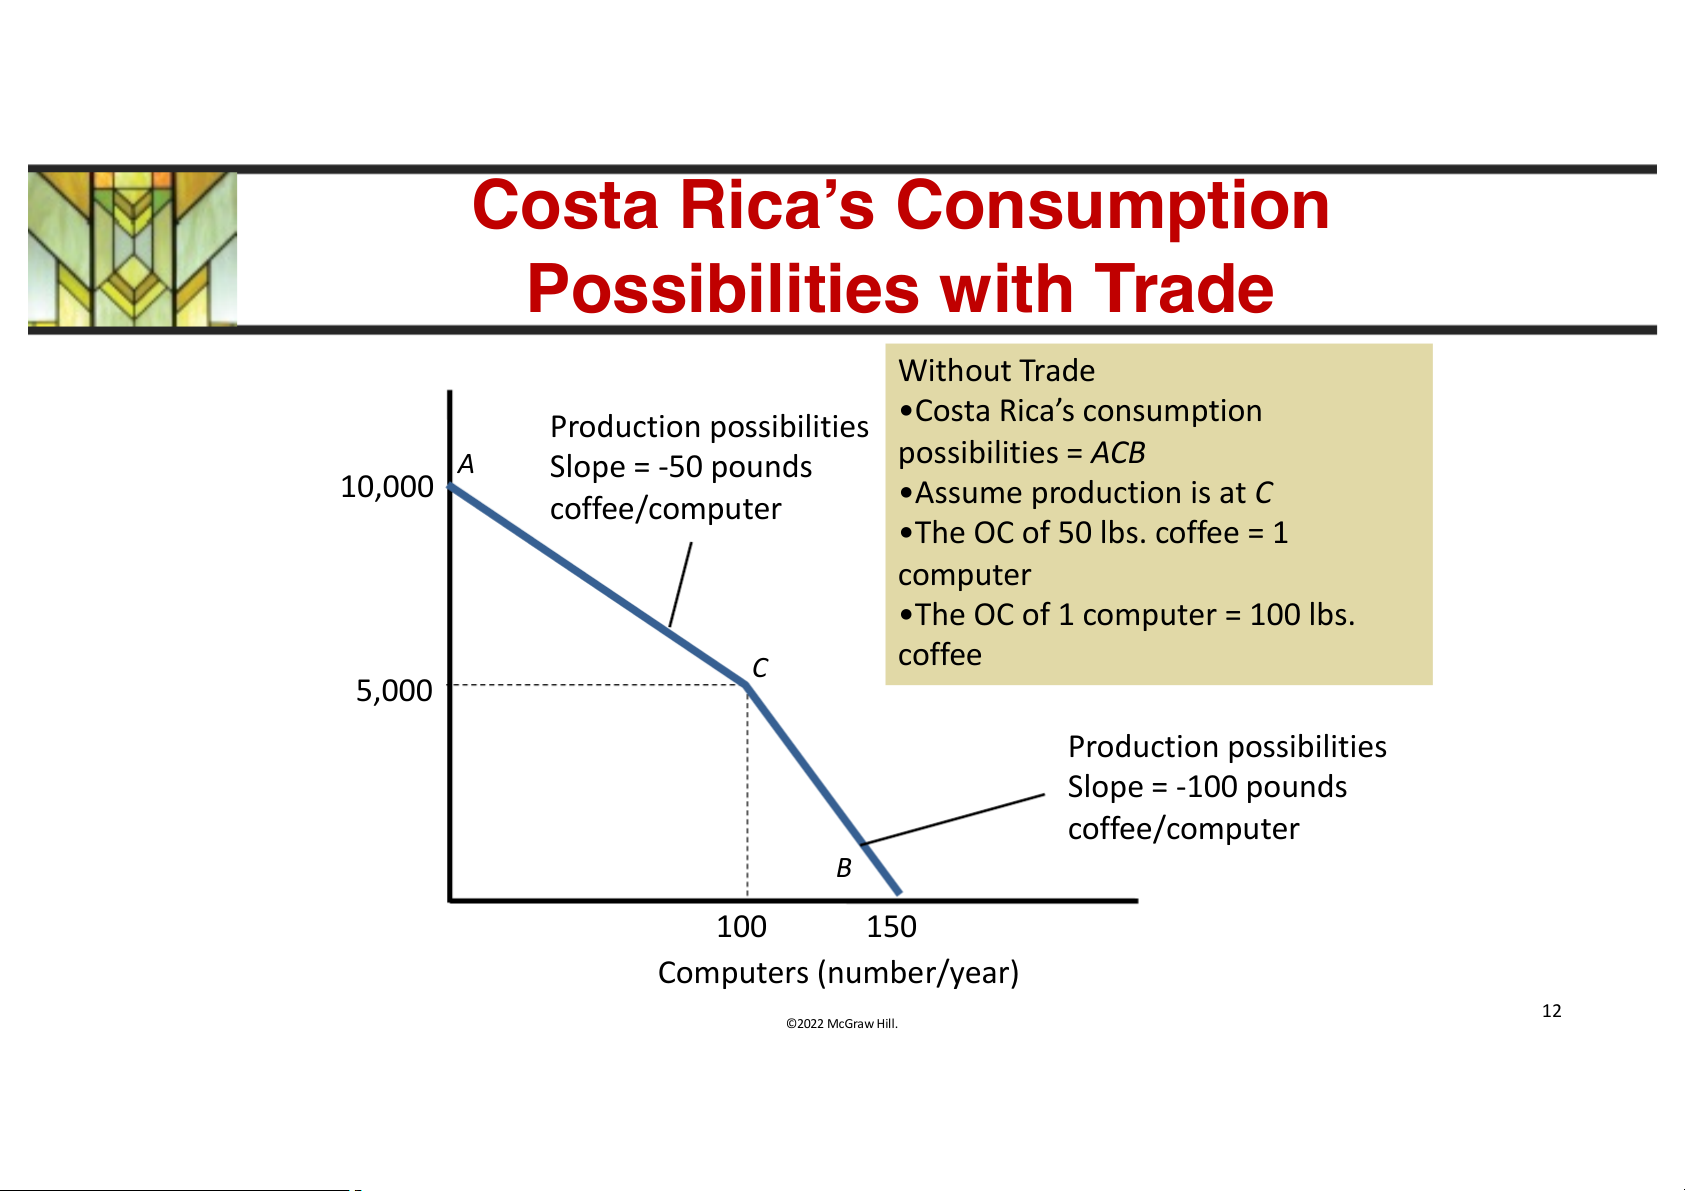
Possibilities with Trade Without Trade •Costa Rica’s consumption Production possibilities r) a A possibilities = ACB e Slope = -50 pounds 10,000
•Assume production is at C s/y coffee/computer d
•The OC of 50 lbs. coffee = 1 n u computer o (p
•The OC of 1 computer = 100 lbs. e coffee C ffe o 5,000 C Production possibilities Slope = -100 pounds coffee/computer B 100 150 Computers (number/year) 12 ©2022 McGraw Hill.
Costa Rica’s Consumption Possibilities with Trade F With Trade 13,000
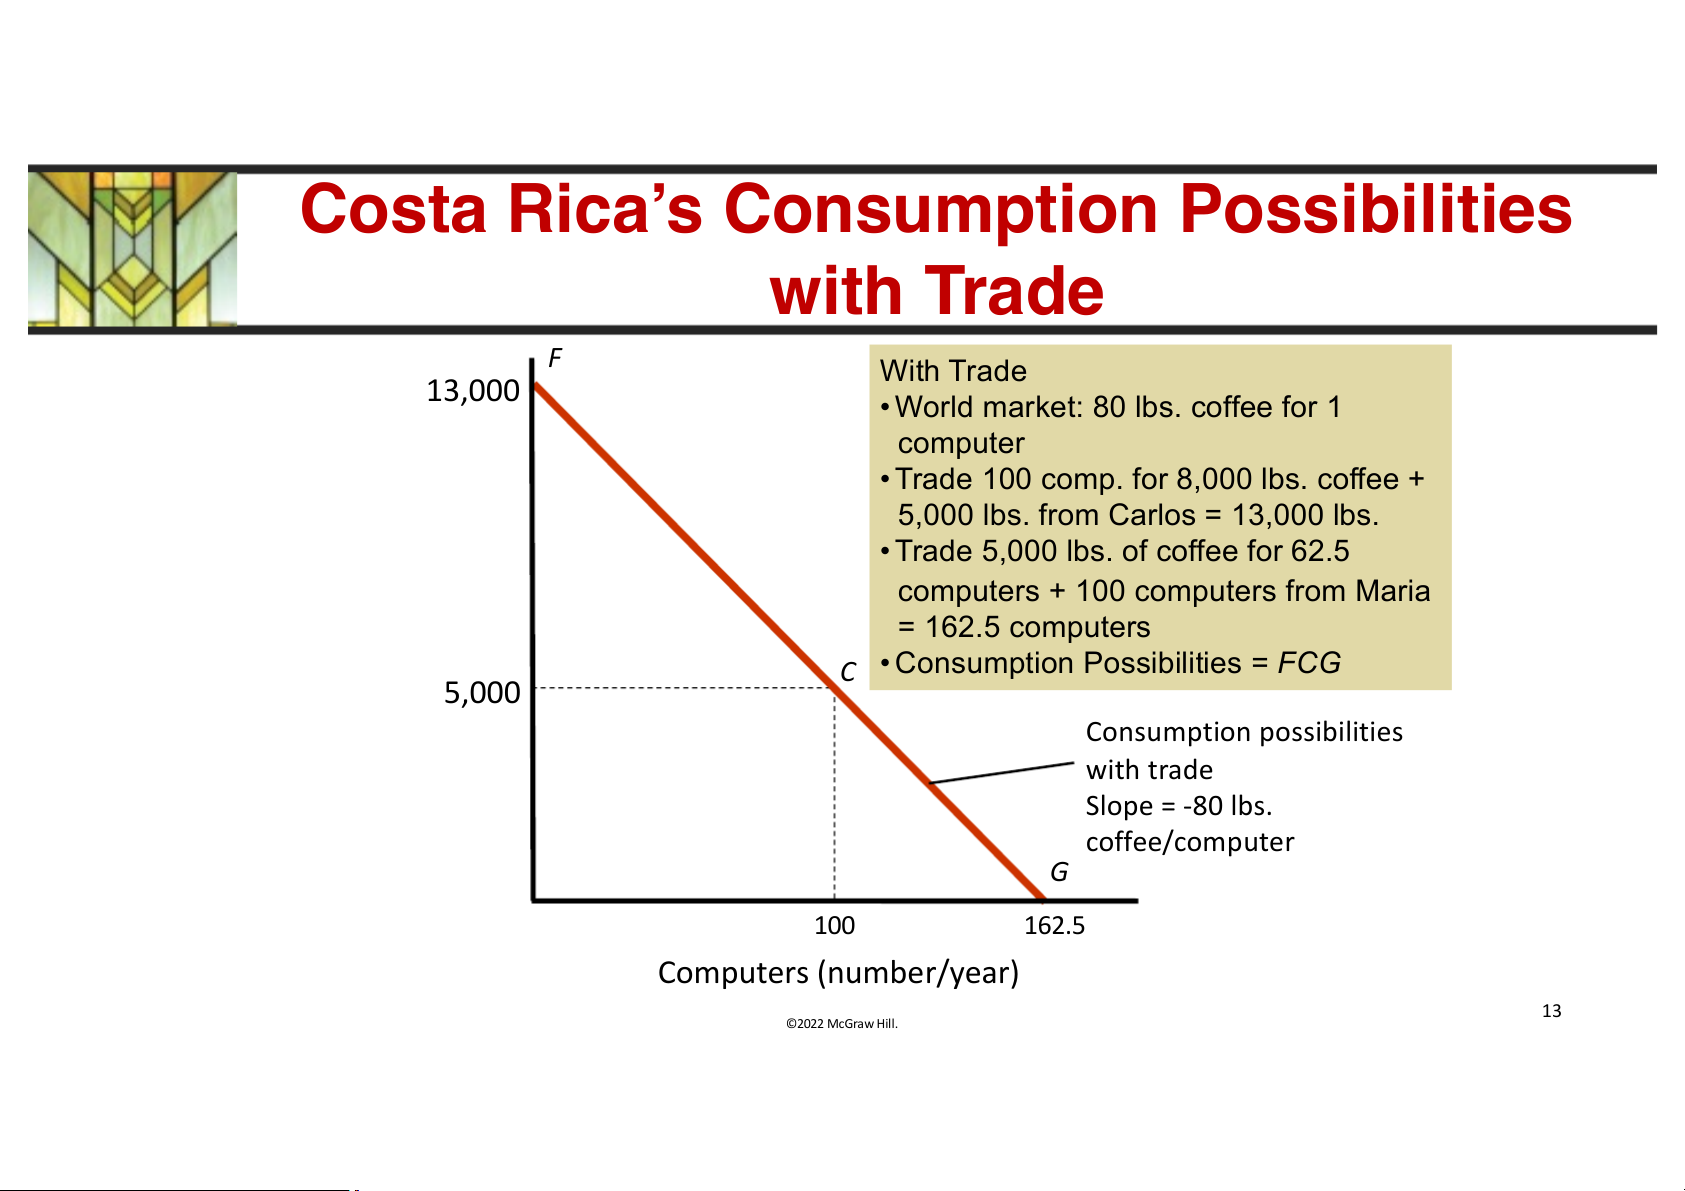
• World market: 80 lbs. coffee for 1 computer r) a
• Trade 100 comp. for 8,000 lbs. coffee + e
5,000 lbs. from Carlos = 13,000 lbs. s/y d
• Trade 5,000 lbs. of coffee for 62.5 n u
computers + 100 computers from Maria o = 162.5 computers (p e C
• Consumption Possibilities = FCG 5,000 ffe o C Consumption possibilities with trade Slope = -80 lbs. coffee/computer G 100 162.5 Computers (number/year) 13 ©2022 McGraw Hill.
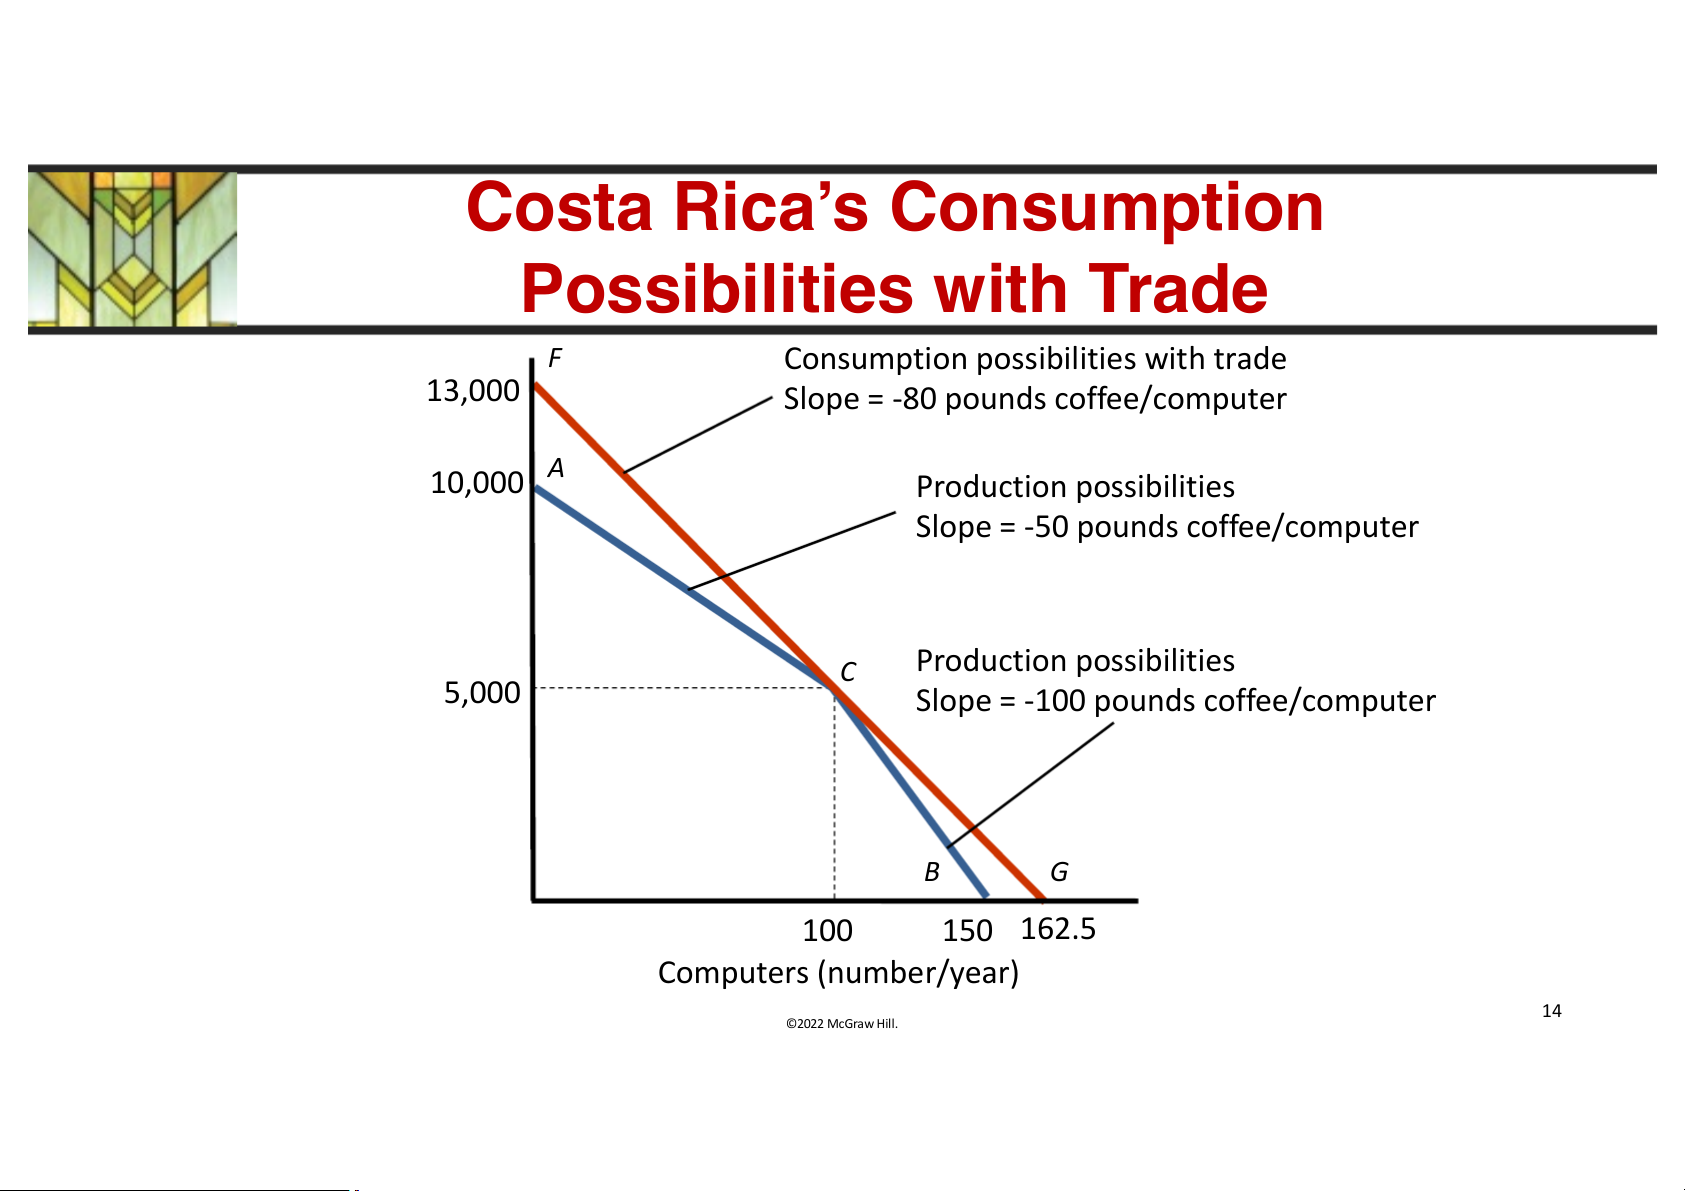
Costa Rica’s Consumption
Possibilities with Trade F
Consumption possibilities with trade 13,000
Slope = -80 pounds coffee/computer r) A a 10,000 Production possibilities e
Slope = -50 pounds coffee/computer s/y d n u o (p e C Production possibilities 5,000 ffe
Slope = -100 pounds coffee/computer o C B G 100 150 162.5 Computers (number/year) 14 ©2022 McGraw Hill.
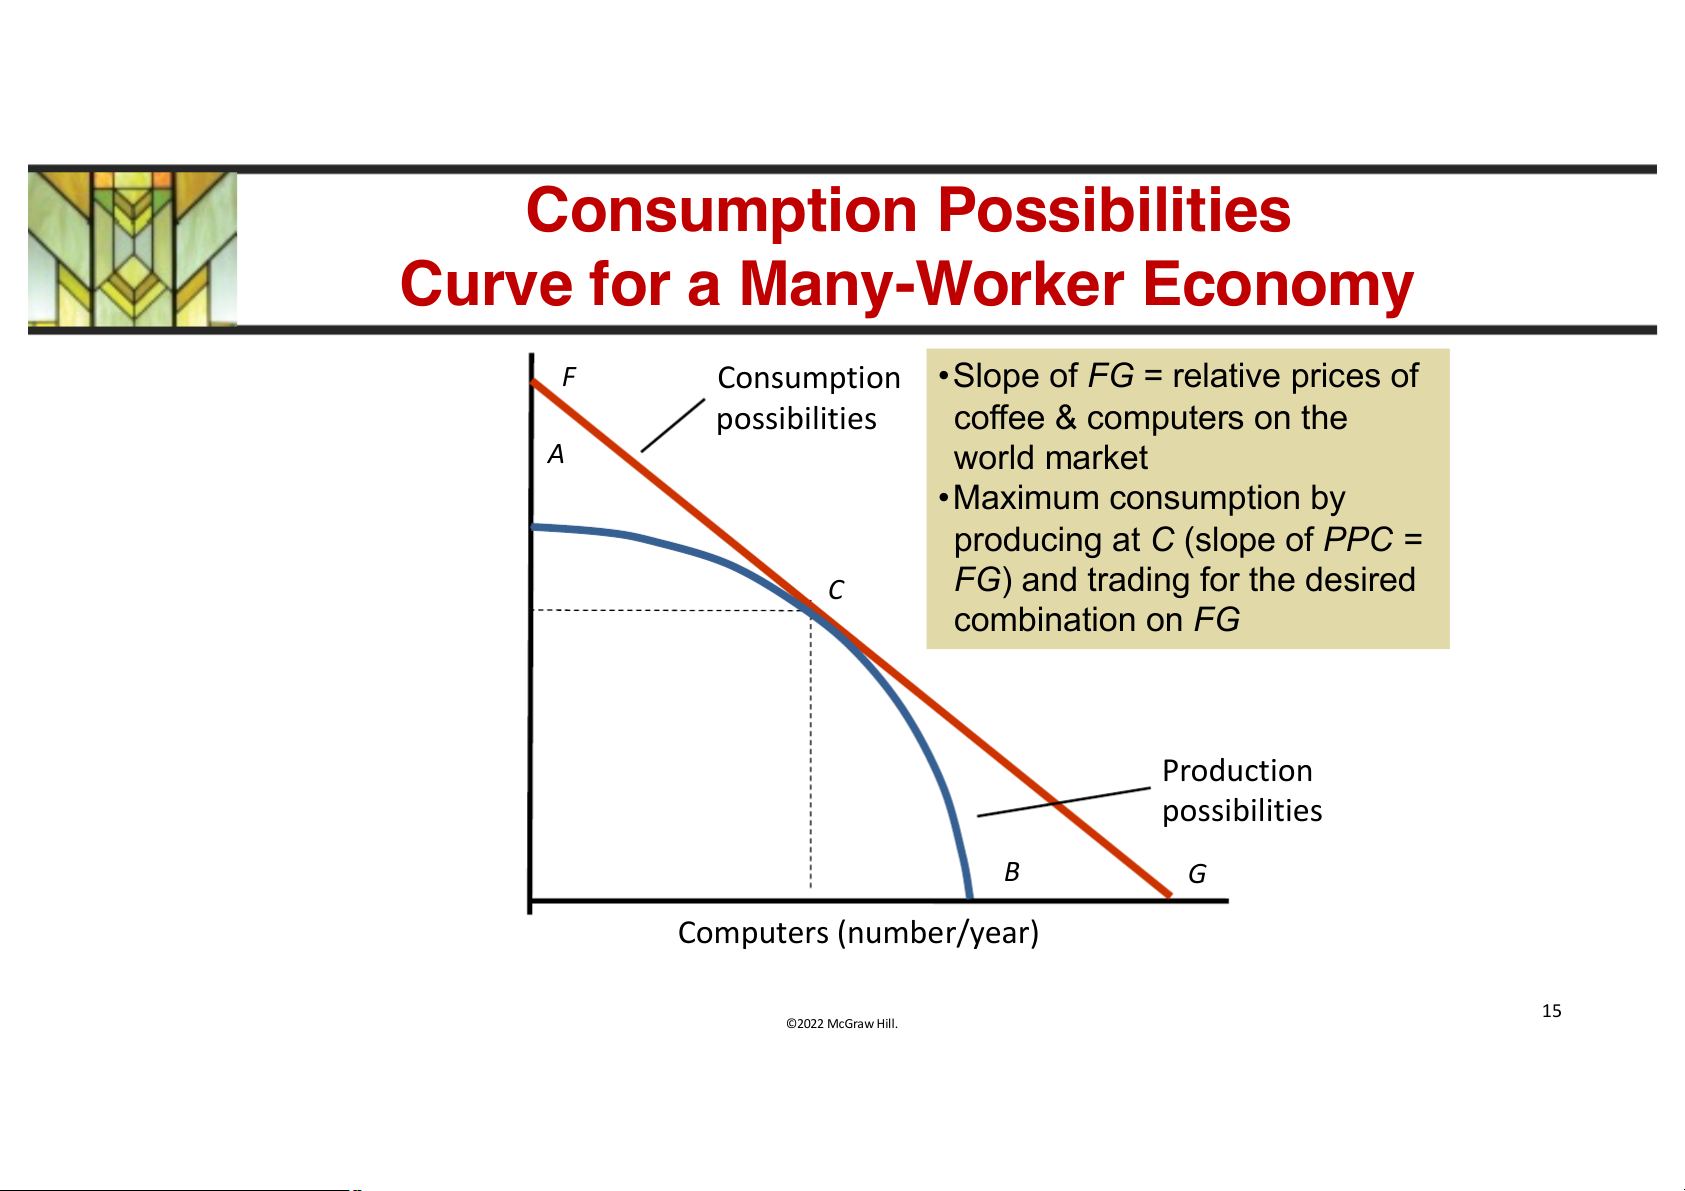
Consumption Possibilities
Curve for a Many-Worker Economy F Consumption
• Slope of FG = relative prices of possibilities coffee & computers on the A r) world market a e • Maximum consumption by s/y
producing at C (slope of PPC = d n
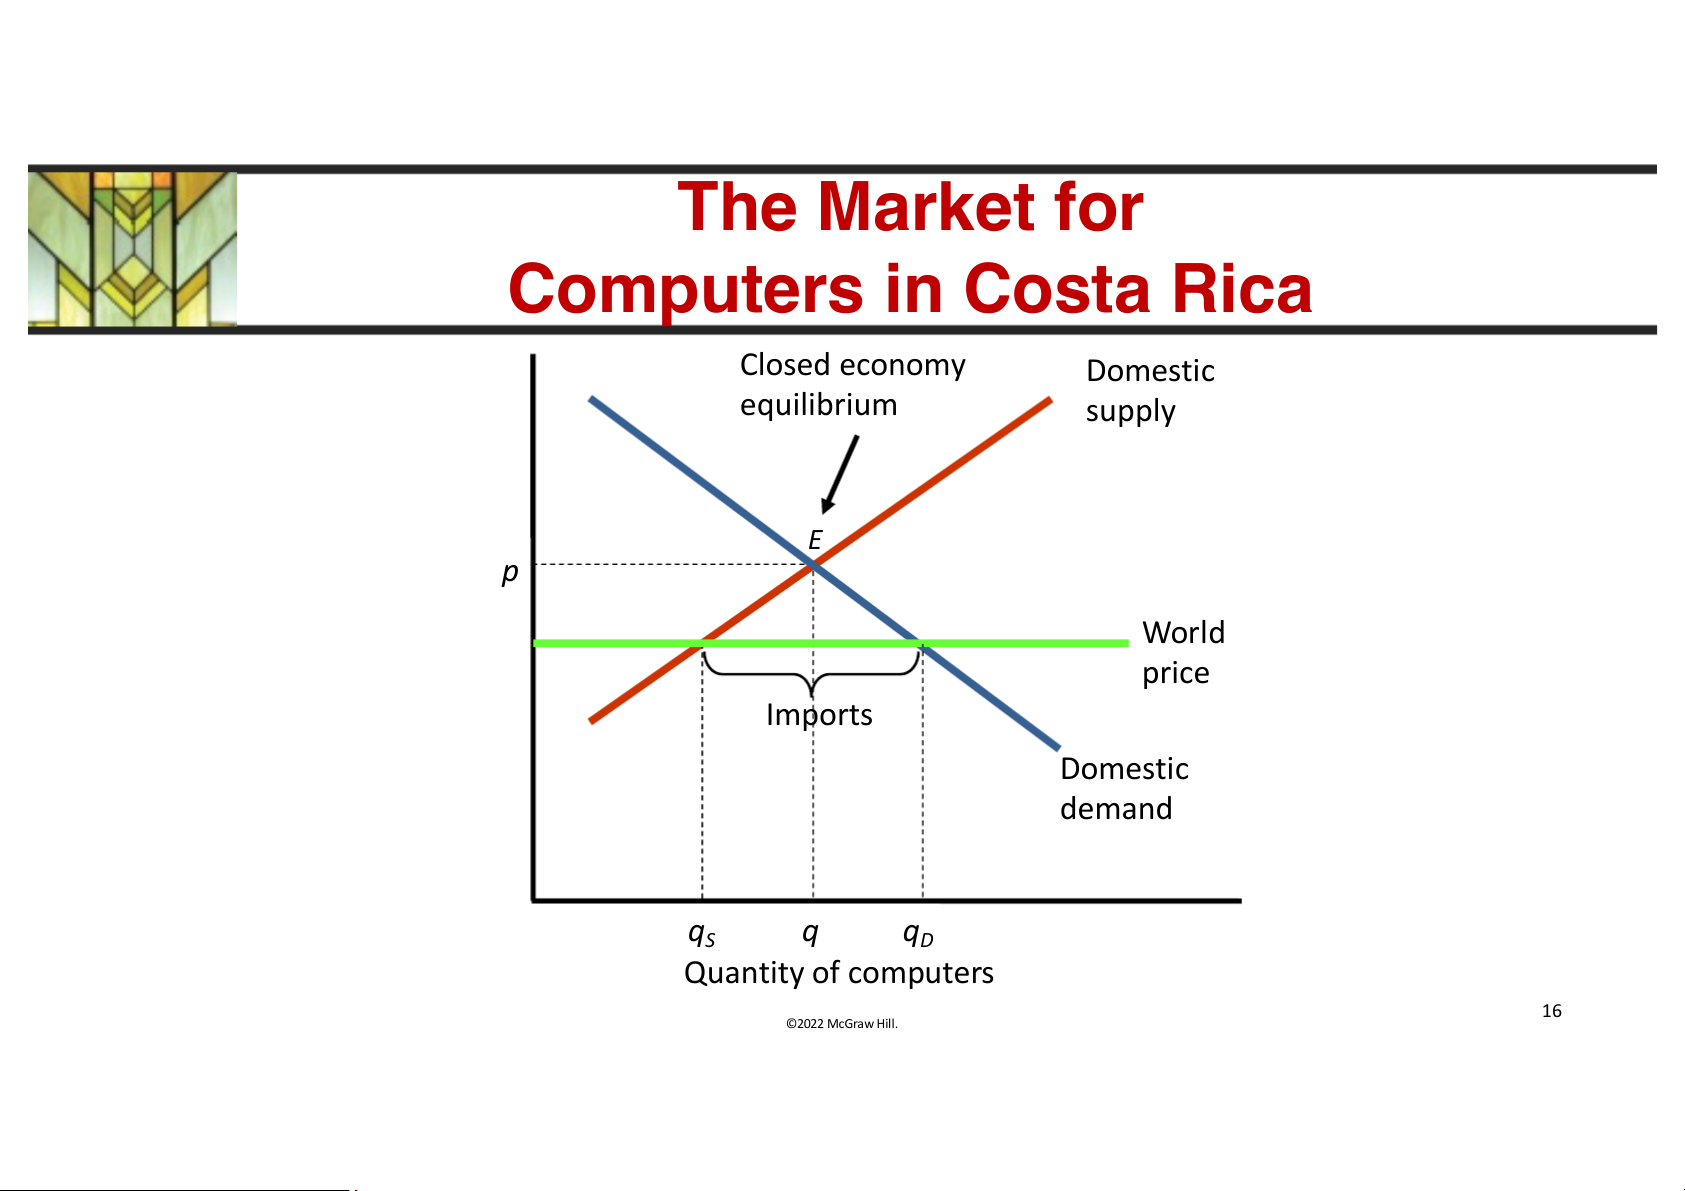
FG) and trading for the desired u C o combination on FG (p e ffe o C Production possibilities B G Computers (number/year) 15 ©2022 McGraw Hill. The Market for Computers in Costa Rica Closed economy Domestic equilibrium supply rs te E u p p m World f co o price Imports rice P Domestic demand qS q qD Quantity of computers 16 ©2022 McGraw Hill. A Supply and Demand Perspective on Trade
• If the price of a good or service in a closed economy is
greater than the world price, and that economy opens
itself to trade, the economy will tend to become a net
importer of that good or service. 17 ©2022 McGraw Hill.
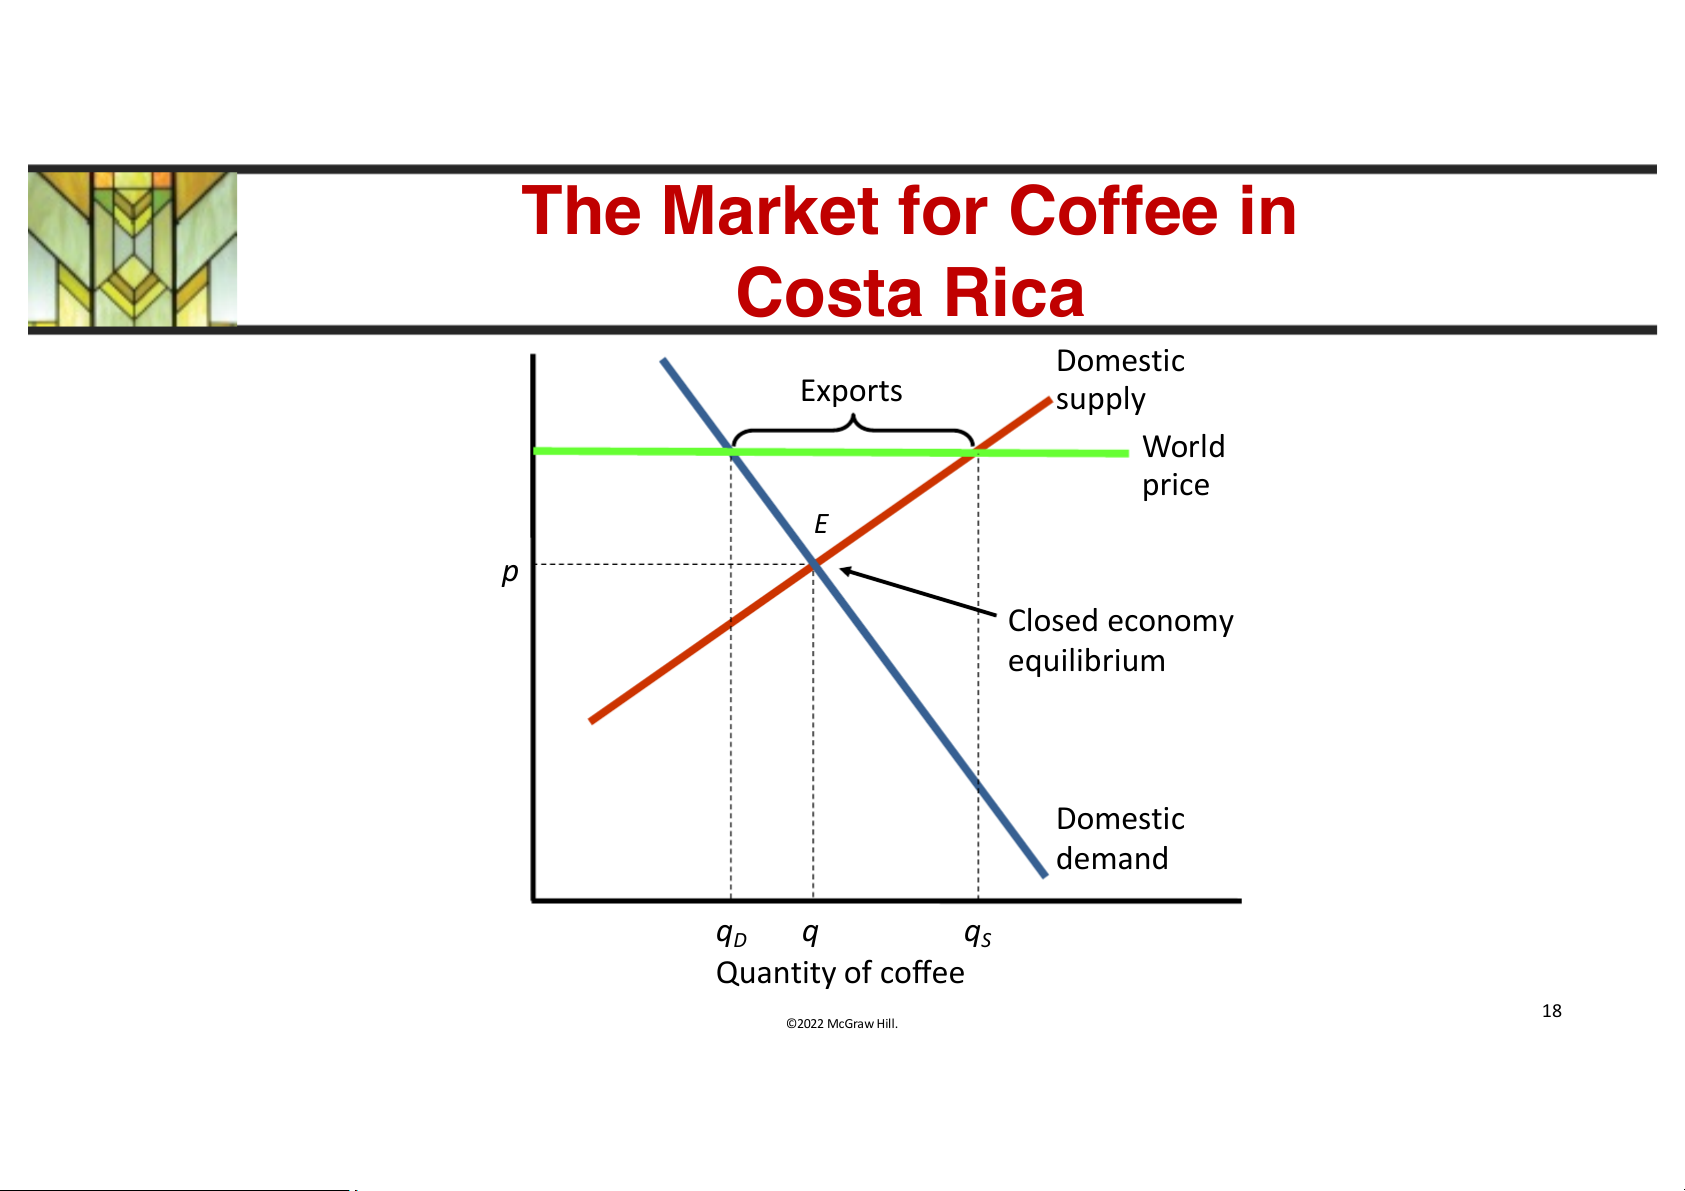
The Market for Coffee in Costa Rica Domestic Exports supply World price E e ffe p f co Closed economy o equilibrium rice P Domestic demand qD q qS Quantity of coffee 18 ©2022 McGraw Hill. A Supply and Demand Perspective on Trade
• If the price of a good or service in a closed economy is
lower than the world price, and that economy opens
itself for trade, the economy will tend to become a net
exporter of that good or service. 19 ©2022 McGraw Hill. A Supply and Demand Perspective on Trade
• Observations of the Mutually Beneficial Gains from Trade
– Countries will profit by exporting the goods and services for
which they have a comparative advantage.
– The revenue from the exports are used to import goods and
services for which they do not have a comparative advantage. 20 ©2022 McGraw Hill.
Tài liệu liên quan:
-

Chương 3: độ co giãn và các nhân tố ảnh hưởng | Microeconomics | Trường Đại học Quốc tế, Đại học Quốc gia Thành phố Hồ Chí Minh
3 2 -

Microeconomics Syllabus | Microeconomics | Trường Đại học Quốc tế, Đại học Quốc gia Thành phố Hồ Chí Minh
3 2 -

Microeconomics Course Syllabus & Assessment Details | Microeconomics | Trường Đại học Quốc tế, Đại học Quốc gia Thành phố Hồ Chí Minh
3 2 -

Assignment 3 - Elasticity MCQs and Key Concepts | Microeconomics | Trường Đại học Quốc tế, Đại học Quốc gia Thành phố Hồ Chí Minh
3 2 -

Assignment 2 - Economic Equilibrium Analysis of Fridges and Motorcycles | Microeconomics | Trường Đại học Quốc tế, Đại học Quốc gia Thành phố Hồ Chí Minh
3 2