Chapter 4: Market Forces of Supply and Demand | Microeconomics | Trường Đại học Quốc tế, Đại học Quốc gia Thành phố Hồ Chí Minh
★ A Market is a group of buyers and sellers of a particular good or service. The buyers, as a group, determine the demand for the product, and the sellers, as a group, choose the supply of the product. Markets take many forms, but more often, markets are less organized. ᯓ★ Economists use the term Competitive Market to describe a market where there are so many buyers and sellers that each has a negligible impact on the market price. Tài liệu được sưu tầm và soạn thảo dưới dạng file PDF để gửi tới các bạn cùng tham khảo, ôn tập đầy đủ kiến thức, chuẩn bị cho các buổi học thật tốt. Mời bạn đọc đón xem!
Môn: Microeconomics 635 tài liệu
Trường: Trường Đại học Quốc tế, Đại học Quốc gia Thành phố Hồ Chí Minh 1.9 K tài liệu
Tác giả:
Preview text:
Chapter 4: The Market Forces of Supply and Demand Friday, October 17, 2025 3:43 PM
symbols: ↓↑ ↳ → ⇒ ✦ ᯓ★ ≠ 01 | markets and competition
ᯓ★ A Market is a group of buyers and sellers of a particular good or service. The buyers, as a group, determine the demand for the product, and
the sellers, as a group, choose the supply of the product. Markets take many forms, but more often, markets are less organized.
ᯓ★ Economists use the term Competitive Market to describe a market where there are so many buyers and sellers that each has a
negligible impact on the market price.
✦ In this chapter, we assume that markets are perfectly competitive. To reach this highest form of competition, a market must have two characteristics:
(1) the goods oered for sale are all the same, and (2) buyers and sel ers are so numerous that none of them has any influence over the market price. 02 | demand
ᯓ★ The Quantity Demand: is the amount of a good that buyers are willing and able to purchase. As we will see, many things determine the
quantity demanded of any good, but there is one determinant that plays a central role: the price of the good.
ᯓ★ The Law of Demand: Other things being equal. When the price of a good rises, the quantity demanded of the good falls, and vice versa.
→ The relationship between the price and the quantity demanded of goods is negative.
↳ There are two exceptions to the Law of Demand
+ A Giffen Good refers to a good that people consume more of as the price rises. A Giffen Good has certain conditions: (1) the good
must be inferior, (2) the good must form a large percentage of consumption, (3) there must be a lack of close substitution.
+ A Veblen Good refers to luxury items for which higher prices increase desirability due to the status they confer (sports car, luxury fashion items, … )
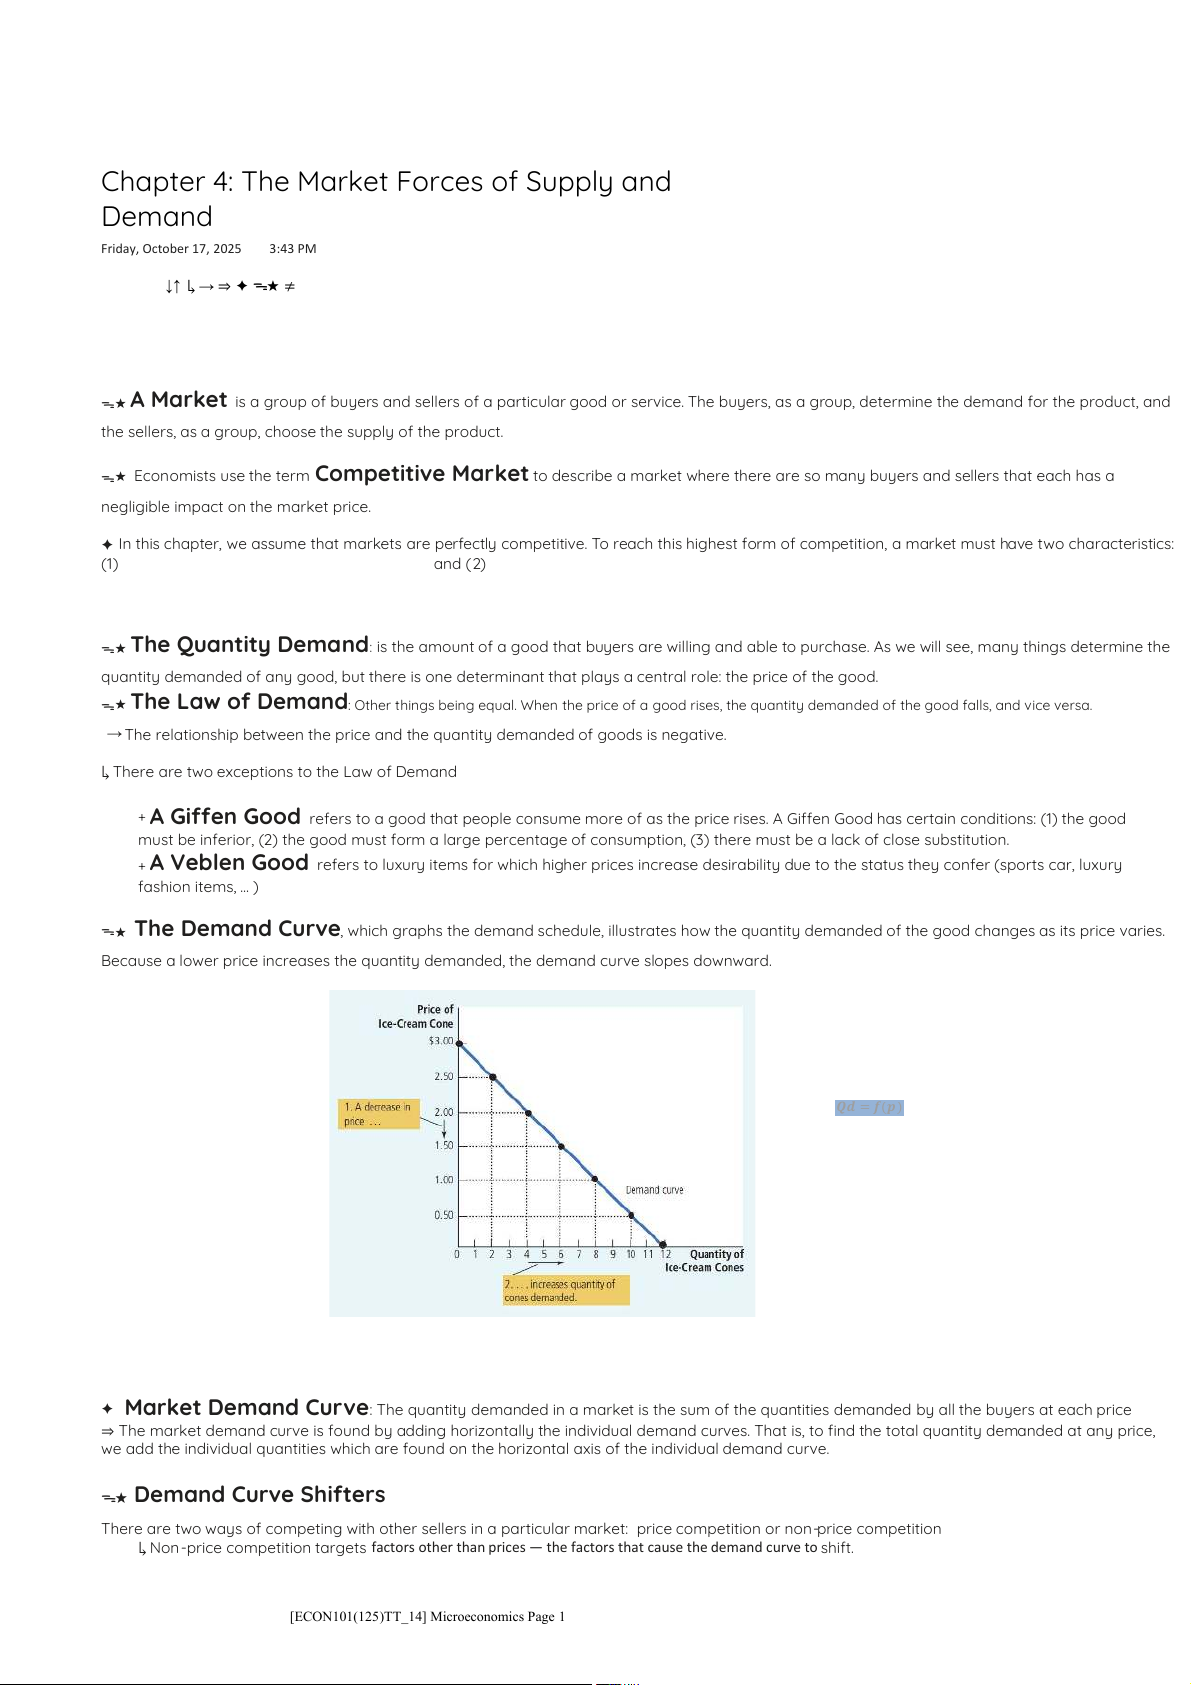
ᯓ★ The Demand Curve, which graphs the demand schedule, illustrates how the quantity demanded of the good changes as its price varies.
Because a lower price increases the quantity demanded, the demand curve slopes downward. 𝑸𝒅 = 𝒇(𝒑)
This is called the Demand Function
+ Qd stands for quantity of demanded good + p stands for price.
To be simple, the demand function can be presented by a linear function: y = a - bp.
✦ Market Demand Curve: The quantity demanded in a market is the sum of the quantities demanded by all the buyers at each price
⇒ The market demand curve is found by adding horizontally the individual demand curves. That is, to find the total quantity demanded at any price,
we add the individual quantities which are found on the horizontal axis of the individual demand curve. ᯓ★ Demand Curve Shifters
There are two ways of competing with other sellers in a particular market: price competition or non-price competition
↳ Non -price competition targets factors other than prices — the factors that cause the demand curve to shift.
[ECON101(125)TT_14] Microeconomics Page 1
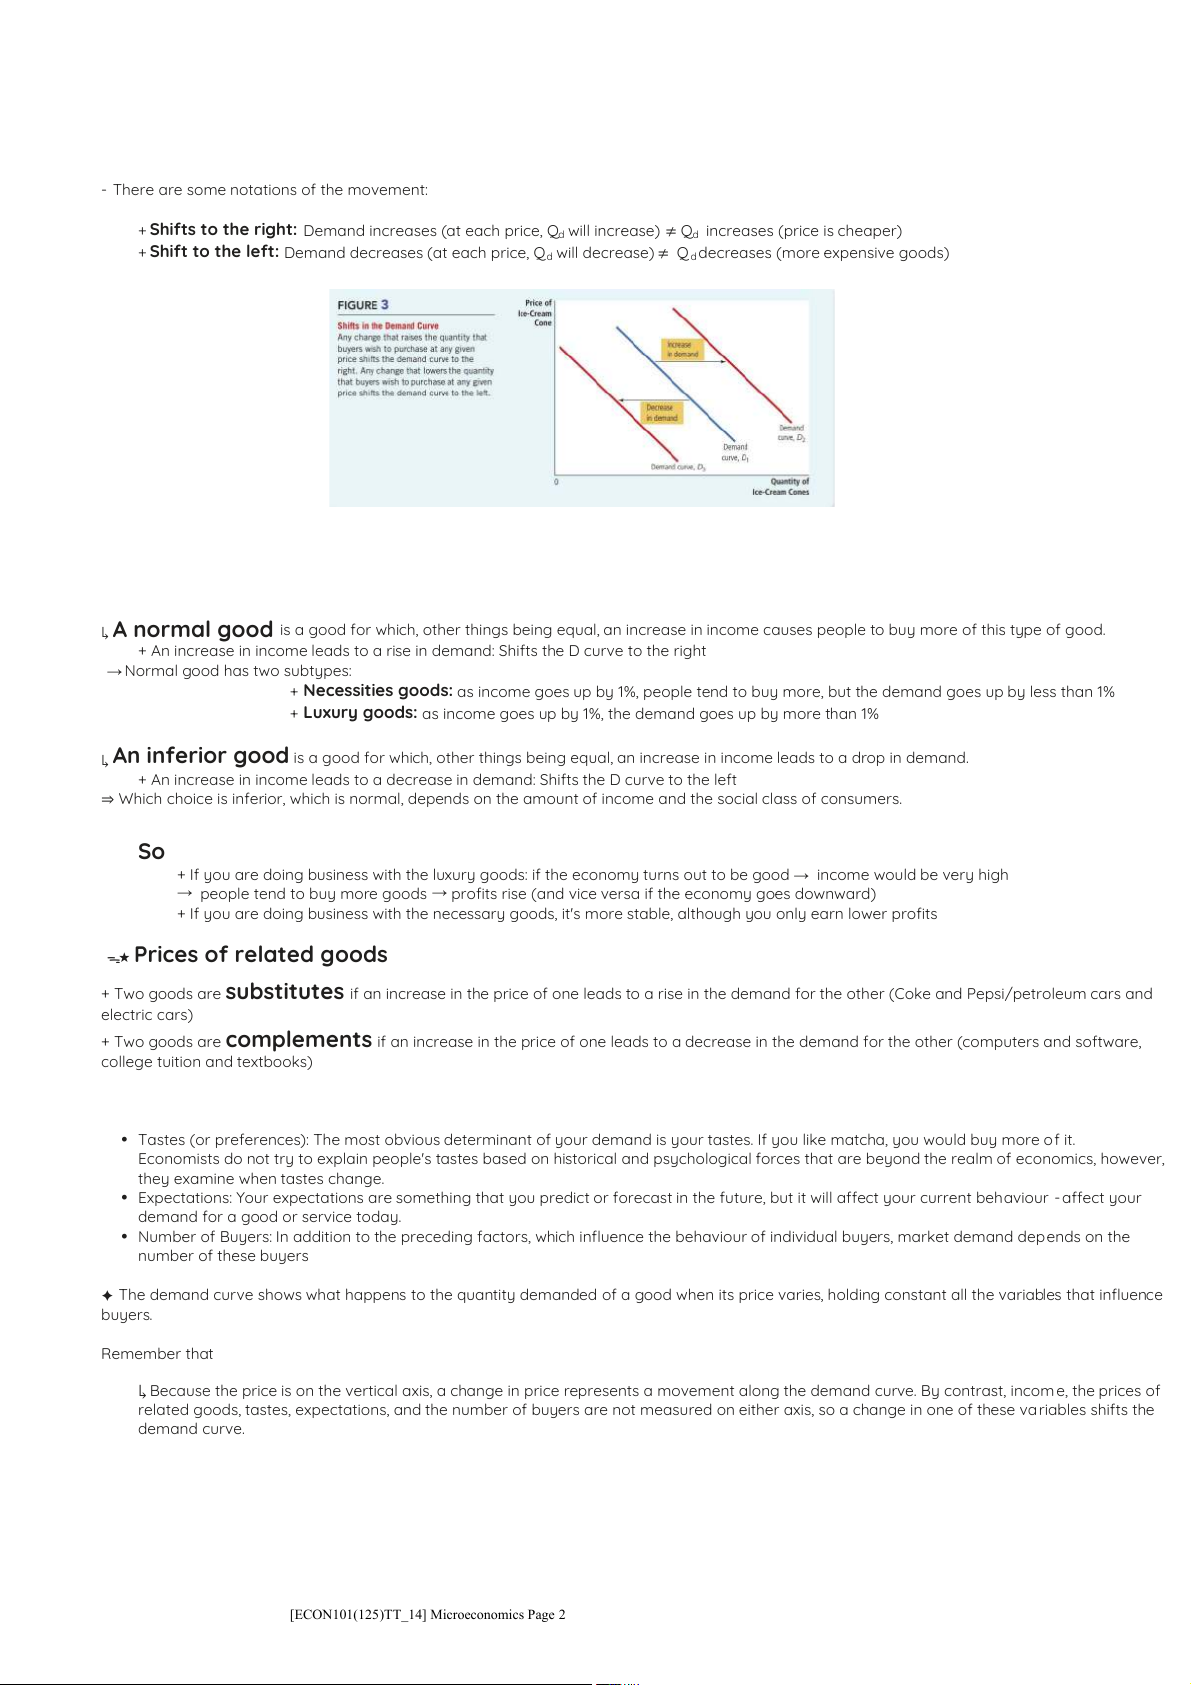
- There are some notations of the movement:
+ Shifts to the right: Demand increases (at each price, Qd will increase) ≠ Qd increases (price is cheaper)
+ Shift to the left: Demand decreases (at each price, Qd will decrease) ≠ Qd decreases (more expensive goods) 03 | income
↳ A normal good is a good for which, other things being equal, an increase in income causes people to buy more of this type of good.
+ An increase in income leads to a rise in demand: Shifts the D curve to the right
→ Normal good has two subtypes:
+ Necessities goods: as income goes up by 1%, people tend to buy more, but the demand goes up by less than 1%
+ Luxury goods: as income goes up by 1%, the demand goes up by more than 1%
↳ An inferior good is a good for which, other things being equal, an increase in income leads to a drop in demand.
+ An increase in income leads to a decrease in demand: Shifts the D curve to the left
⇒ Which choice is inferior, which is normal, depends on the amount of income and the social class of consumers. So
+ If you are doing business with the luxury goods: if the economy turns out to be good → income would be very high
→ people tend to buy more goods → profits rise (and vice versa if the economy goes downward)
+ If you are doing business with the necessary goods, it's more stable, although you only earn lower profits ᯓ★ Prices of related goods
+ Two goods are substitutes if an increase in the price of one leads to a rise in the demand for the other (Coke and Pepsi/petroleum cars and electric cars)
+ Two goods are complements if an increase in the price of one leads to a decrease in the demand for the other (computers and software,
college tuition and textbooks)
There are some determinants of people's demand
• Tastes (or preferences): The most obvious determinant of your demand is your tastes. If you like matcha, you would buy more o f it.
Economists do not try to explain people's tastes based on historical and psychological forces that are beyond the realm of economics, however,
they examine when tastes change.
• Expectations: Your expectations are something that you predict or forecast in the future, but it will affect your current behaviour - affect your
demand for a good or service today.
• Number of Buyers: In addition to the preceding factors, which influence the behaviour of individual buyers, market demand depends on the number of these buyers
✦ The demand curve shows what happens to the quantity demanded of a good when its price varies, holding constant all the variables that influence buyers.
Remember that a curve shifts when there is a change in a relevant variable that is not measured on either axis.
↳ Because the price is on the vertical axis, a change in price represents a movement along the demand curve. By contrast, incom e, the prices of
related goods, tastes, expectations, and the number of buyers are not measured on either axis, so a change in one of these va riables shifts the demand curve.
[ECON101(125)TT_14] Microeconomics Page 2 04 | supply
ᯓ★ The Quantity Supplied of any good or service is the amount that sellers are willing and able to sell. Similar to quantity demanded, there
are many determinants of quantity supplied, but price plays a special role in analysis.
ᯓ★ The Law of Supply assuming that other things equal. When the price of a good rises, the quantity supplied of the good rises, and vice
versa. --> positive relationship → The relationship between the quantity supplied and the price is a positive relationship
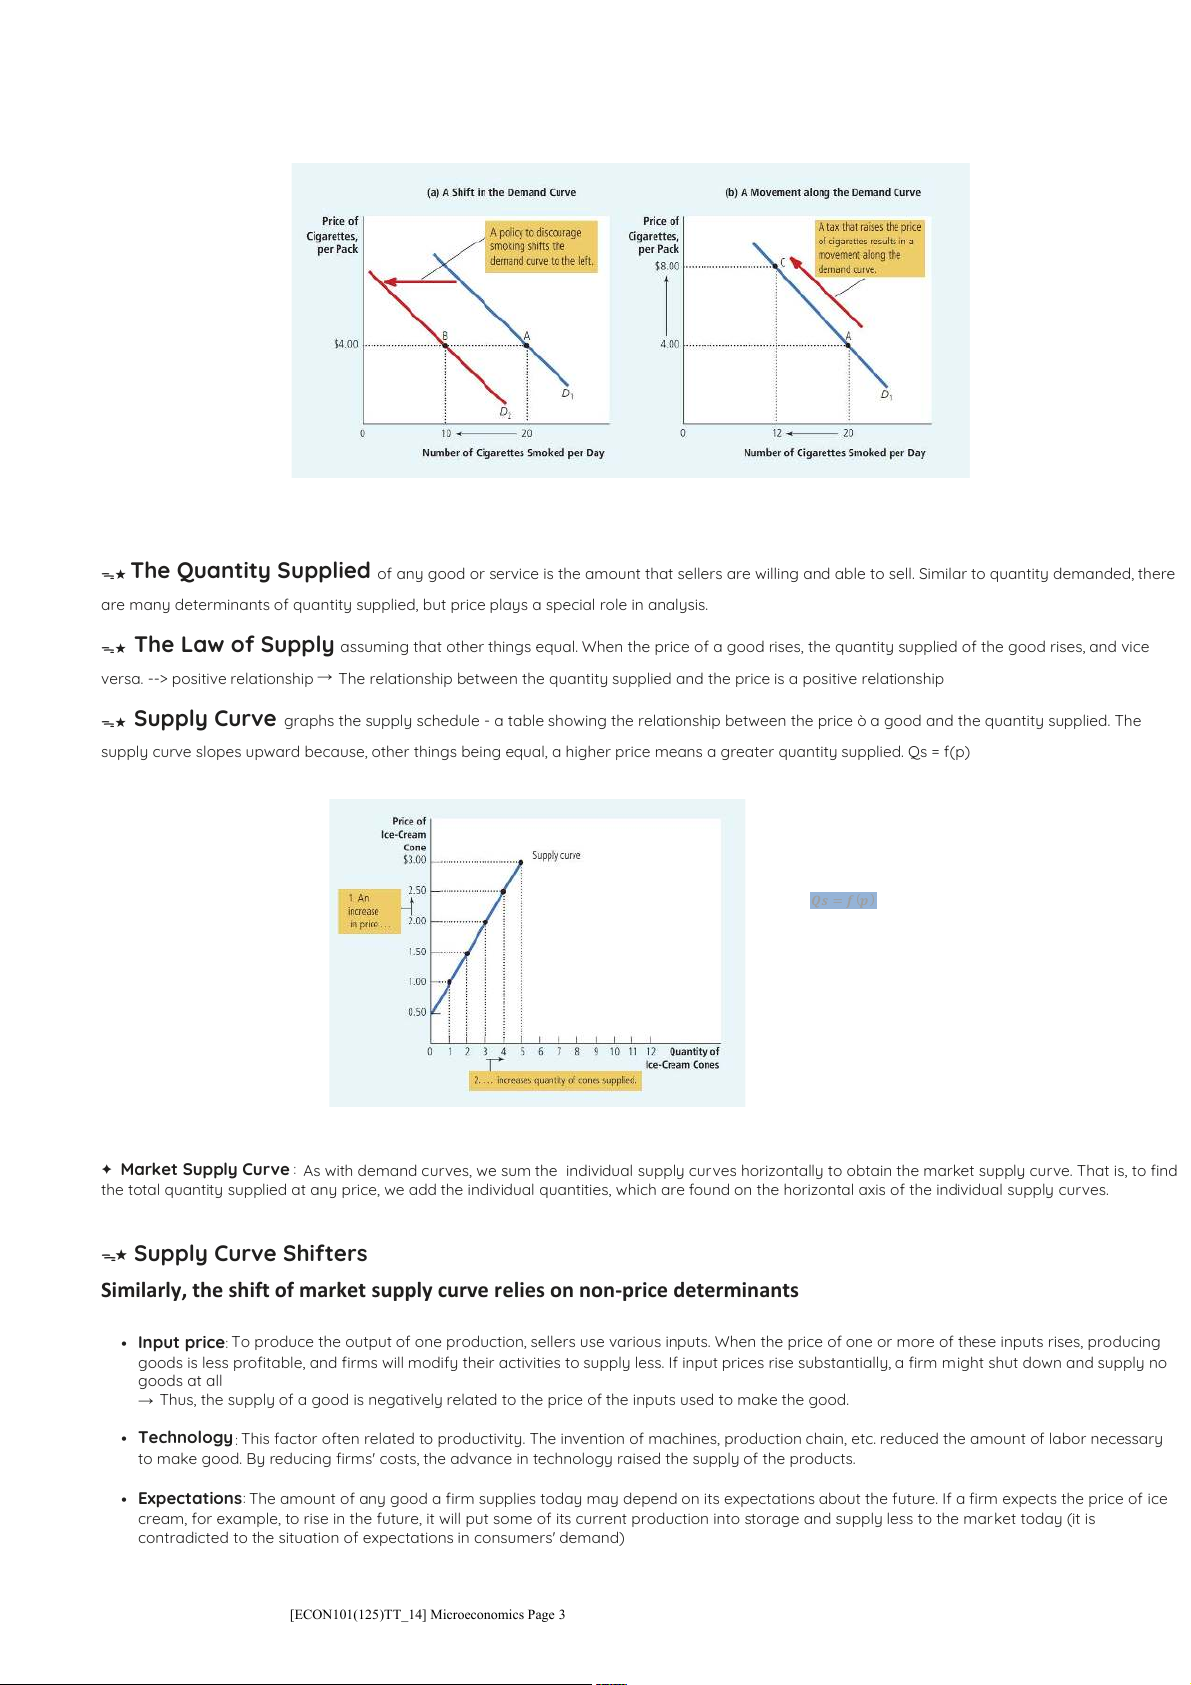
ᯓ★ Supply Curve graphs the supply schedule - a table showing the relationship between the price ò a good and the quantity supplied. The
supply curve slopes upward because, other things being equal, a higher price means a greater quantity supplied. Qs = f(p) 𝑸𝒔 = 𝒇 (𝒑)
This is called the Supply Function
+ Qs stands for quantity of supplied good + p stands for price.
To be simple, the demand function can be presented by a linear function: y = a + bp.
✦ Market Supply Curve : As with demand curves, we sum the individual supply curves horizontal y to obtain the market supply curve. That is, to find
the total quantity supplied at any price, we add the individual quantities, which are found on the horizontal axis of the individual supply curves. ᯓ★ Supply Curve Shifters
Similarly, the shift of market supply curve relies on non-price determinants
• Input price: To produce the output of one production, sellers use various inputs. When the price of one or more of these inputs rises, producing
goods is less profitable, and firms will modify their activities to supply less. If input prices rise substantially, a firm might shut down and supply no goods at all
→ Thus, the supply of a good is negatively related to the price of the inputs used to make the good.
• Technology : This factor often related to productivity. The invention of machines, production chain, etc. reduced the amount of labor necessary
to make good. By reducing firms' costs, the advance in technology raised the supply of the products.
• Expectations: The amount of any good a firm supplies today may depend on its expectations about the future. If a firm expects the price of ice
cream, for example, to rise in the future, it will put some of its current production into storage and supply less to the market today (it is
contradicted to the situation of expectations in consumers' demand)
[ECON101(125)TT_14] Microeconomics Page 3
• Numbers of sellers: In addition to the preceding factors, which influence the behavior of individual sel ers, market supply depends on the
number of these sellers. If any sellers were to retire from the industry, the supply in the market would fall.
✦ The supply curve shows what happens to the quantity supplied of a good when its price varies, holding constant all the other variables that influence
sel ers. When one of these other variables changes, the supply curve shifts.
Keep in mind that a curve shifts only when there is a change in a relevant variable that is not named on either axis. The price Is on vertical axis, so
a change in price represents a movement along the supply curve. By contrast, because input prices, technology, expectations, and the number of
sellers are not measured on either axis, a change in one of these variables shifts the supply curve.
05 | supply and demand together
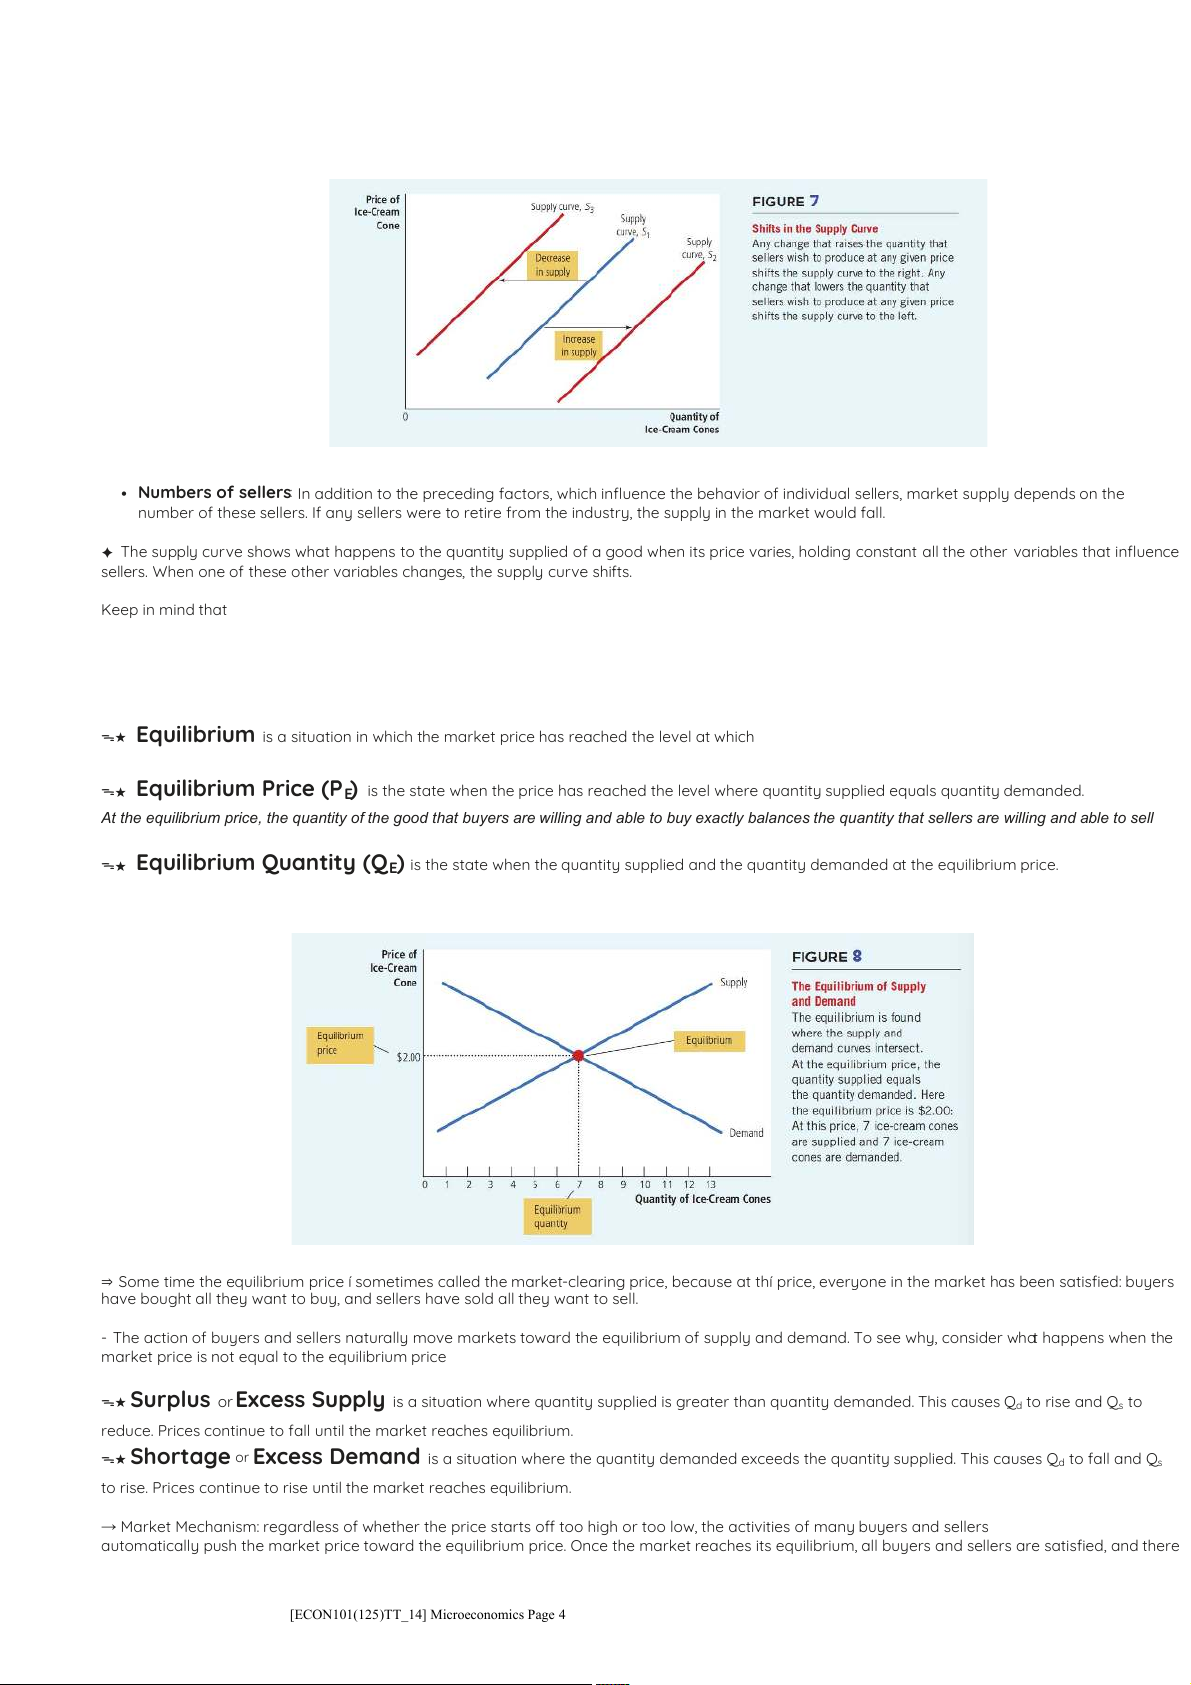
ᯓ★ Equilibrium is a situation in which the market price has reached the level at which quantity supplied equals quantity demanded.
ᯓ★ Equilibrium Price (PE) is the state when the price has reached the level where quantity supplied equals quantity demanded.
At the equilibrium price, the quantity of the good that buyers are willing and able to buy exactly balances the quantity that sellers are willing and able to sell
ᯓ★ Equilibrium Quantity (QE) is the state when the quantity supplied and the quantity demanded at the equilibrium price.
⇒ Some time the equilibrium price í sometimes called the market-clearing price, because at thí price, everyone in the market has been satisfied: buyers
have bought all they want to buy, and sellers have sold all they want to sell.
- The action of buyers and sellers naturally move markets toward the equilibrium of supply and demand. To see why, consider what happens when the
market price is not equal to the equilibrium price
ᯓ★ Surplus or Excess Supply is a situation where quantity supplied is greater than quantity demanded. This causes Qd to rise and Qs to
reduce. Prices continue to fall until the market reaches equilibrium.
ᯓ★ Shortage or Excess Demand is a situation where the quantity demanded exceeds the quantity supplied. This causes Qd to fall and Qs
to rise. Prices continue to rise until the market reaches equilibrium.
→ Market Mechanism: regardless of whether the price starts off too high or too low, the activities of many buyers and sellers
automatically push the market price toward the equilibrium price. Once the market reaches its equilibrium, all buyers and sellers are satisfied, and there
[ECON101(125)TT_14] Microeconomics Page 4
is no upward or downward pressure on the price.
↳ How quickly equilibrium is reached varies from market to market depending on how quickly prices adjust.
↳ In most free markets, surpluses and shortages are only temporary because prices eventually move toward their equilibrium level --- which is called the Law of Supply and Demand.
✦ Three steps to analysing changes in equilibrium
1. Decide whether the event shifts the supply curve, the demand curve, or, in some cases, both curves.
2. Decide whether the curve shifts to the right or to the left
3. Use the supply-and-demand diagram:
+ Compare the initial and the new equilibrium
+ Effects on equilibrium price and quantity.
✦ Shift versus Movement Along the Curve
• Change in supply will cause + A shift in the S curve
+ Occurs when a non-price determinant of supply changes (e.g. technology or costs)
• Change in the quantity supplied will cause
+ A movement along a fixed S curve
+ Occurs when price (P) changes
• Change in demand will cause + A shift in the D curve
+ Occurs when a non-price determinant of demand changes (e.g. income or tastes)
• Change in the quantity demanded will cause
+ A movement along a fixed D curve
+ Occurs when price (P) changes.
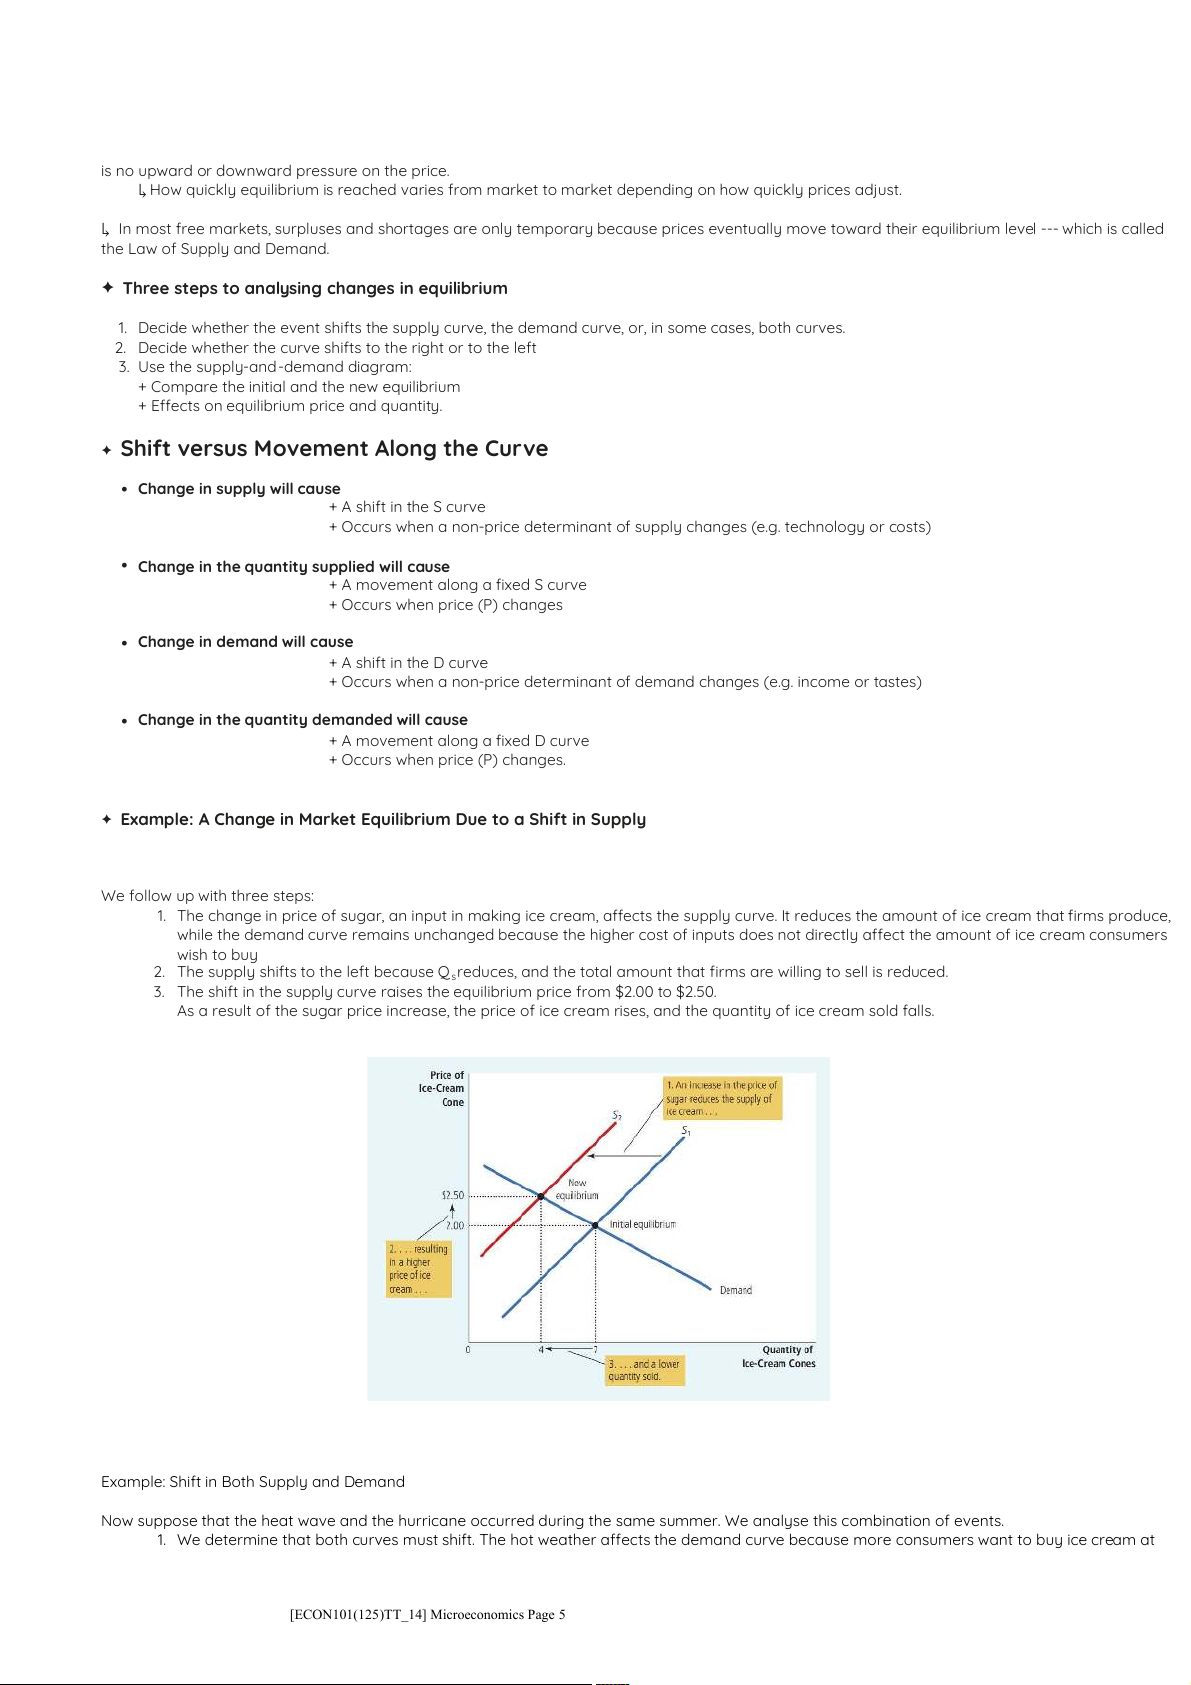
✦ Example: A Change in Market Equilibrium Due to a Shift in Supply
Suppose that during another summer, a hurricane destroys part of the sugarcane crop and drives up the price of sugar.
We follow up with three steps:
1. The change in price of sugar, an input in making ice cream, affects the supply curve. It reduces the amount of ice cream that firms produce,
while the demand curve remains unchanged because the higher cost of inputs does not directly affect the amount of ice cream consumers wish to buy
2. The supply shifts to the left because Qs reduces, and the total amount that firms are willing to sell is reduced.
3. The shift in the supply curve raises the equilibrium price from $2.00 to $2.50.
As a result of the sugar price increase, the price of ice cream rises, and the quantity of ice cream sold falls.
In the situation in which market equilibrium changes due to a shift in Demand, we fol ow the same analysis flow.
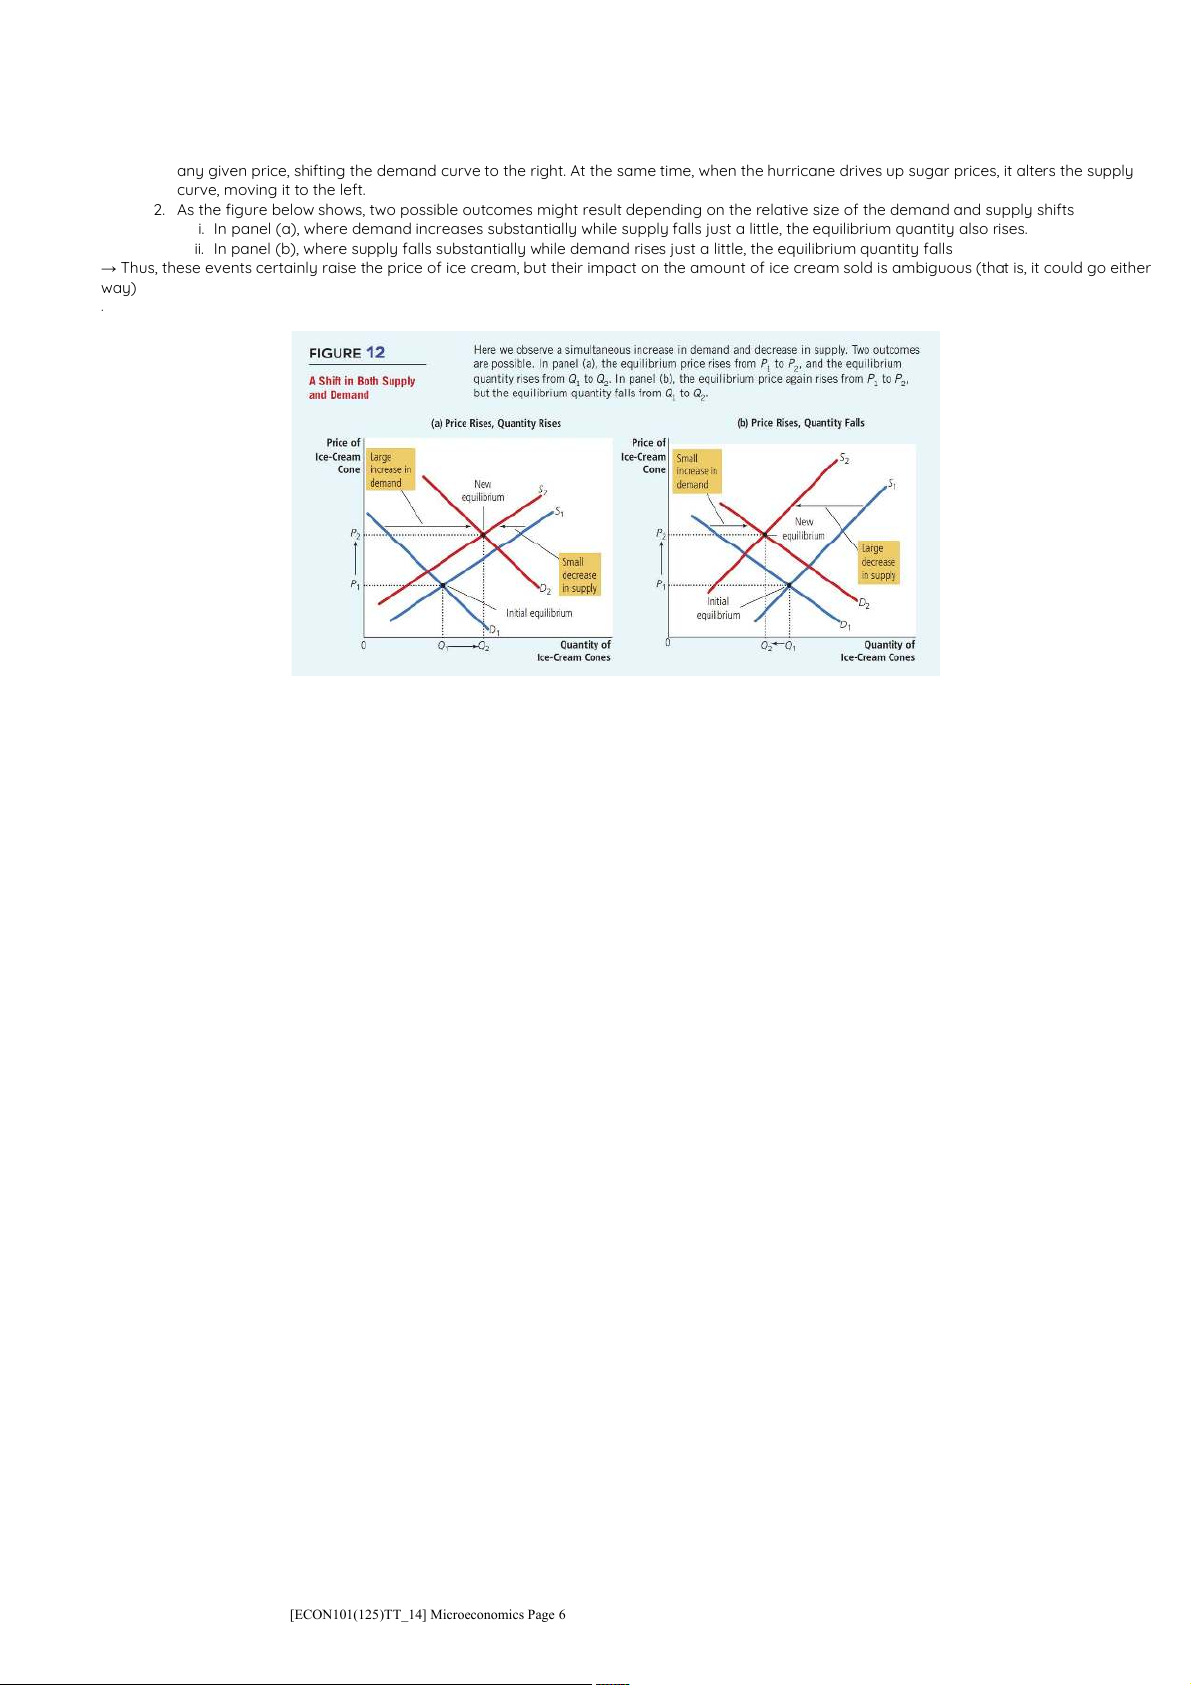
Example: Shift in Both Supply and Demand
Now suppose that the heat wave and the hurricane occurred during the same summer. We analyse this combination of events.
1. We determine that both curves must shift. The hot weather affects the demand curve because more consumers want to buy ice cream at
[ECON101(125)TT_14] Microeconomics Page 5
any given price, shifting the demand curve to the right. At the same time, when the hurricane drives up sugar prices, it alters the supply curve, moving it to the left.
2. As the figure below shows, two possible outcomes might result depending on the relative size of the demand and supply shifts
i. In panel (a), where demand increases substantially while supply falls just a little, the equilibrium quantity also rises.
ii. In panel (b), where supply falls substantially while demand rises just a little, the equilibrium quantity falls
→ Thus, these events certainly raise the price of ice cream, but their impact on the amount of ice cream sold is ambiguous (that is, it could go either way) .
[ECON101(125)TT_14] Microeconomics Page 6
Tài liệu liên quan:
-

Chương 3: độ co giãn và các nhân tố ảnh hưởng | Microeconomics | Trường Đại học Quốc tế, Đại học Quốc gia Thành phố Hồ Chí Minh
0 0 -

Microeconomics Syllabus | Microeconomics | Trường Đại học Quốc tế, Đại học Quốc gia Thành phố Hồ Chí Minh
0 0 -

Microeconomics Course Syllabus & Assessment Details | Microeconomics | Trường Đại học Quốc tế, Đại học Quốc gia Thành phố Hồ Chí Minh
0 0 -

Assignment 3 - Elasticity MCQs and Key Concepts | Microeconomics | Trường Đại học Quốc tế, Đại học Quốc gia Thành phố Hồ Chí Minh
0 0 -

Assignment 2 - Economic Equilibrium Analysis of Fridges and Motorcycles | Microeconomics | Trường Đại học Quốc tế, Đại học Quốc gia Thành phố Hồ Chí Minh
0 0