Economic Effects of Hurricane Katrina & Demand Analysis | Microeconomics | Trường Đại học Quốc tế, Đại học Quốc gia Thành phố Hồ Chí Minh
As we can see from graph that the number of homes listed for sale was a constant number during this time. By relocating a massive amount of population, this number quickly decreased by 3,100 homes (From 3,600 to 500). Along with the scarcity in the number of “living places”, the price undoubtedly increased to $16,000 (From $130.000 to $150.000) just in six months. Tài liệu được sưu tầm và soạn thảo dưới dạng file PDF để gửi tới các bạn cùng tham khảo, ôn tập đầy đủ kiến thức, chuẩn bị cho các buổi học thật tốt. Mời bạn đọc đón xem!
Môn: Microeconomics 635 tài liệu
Trường: Trường Đại học Quốc tế, Đại học Quốc gia Thành phố Hồ Chí Minh 1.9 K tài liệu
Tác giả:
Preview text:
Case 1
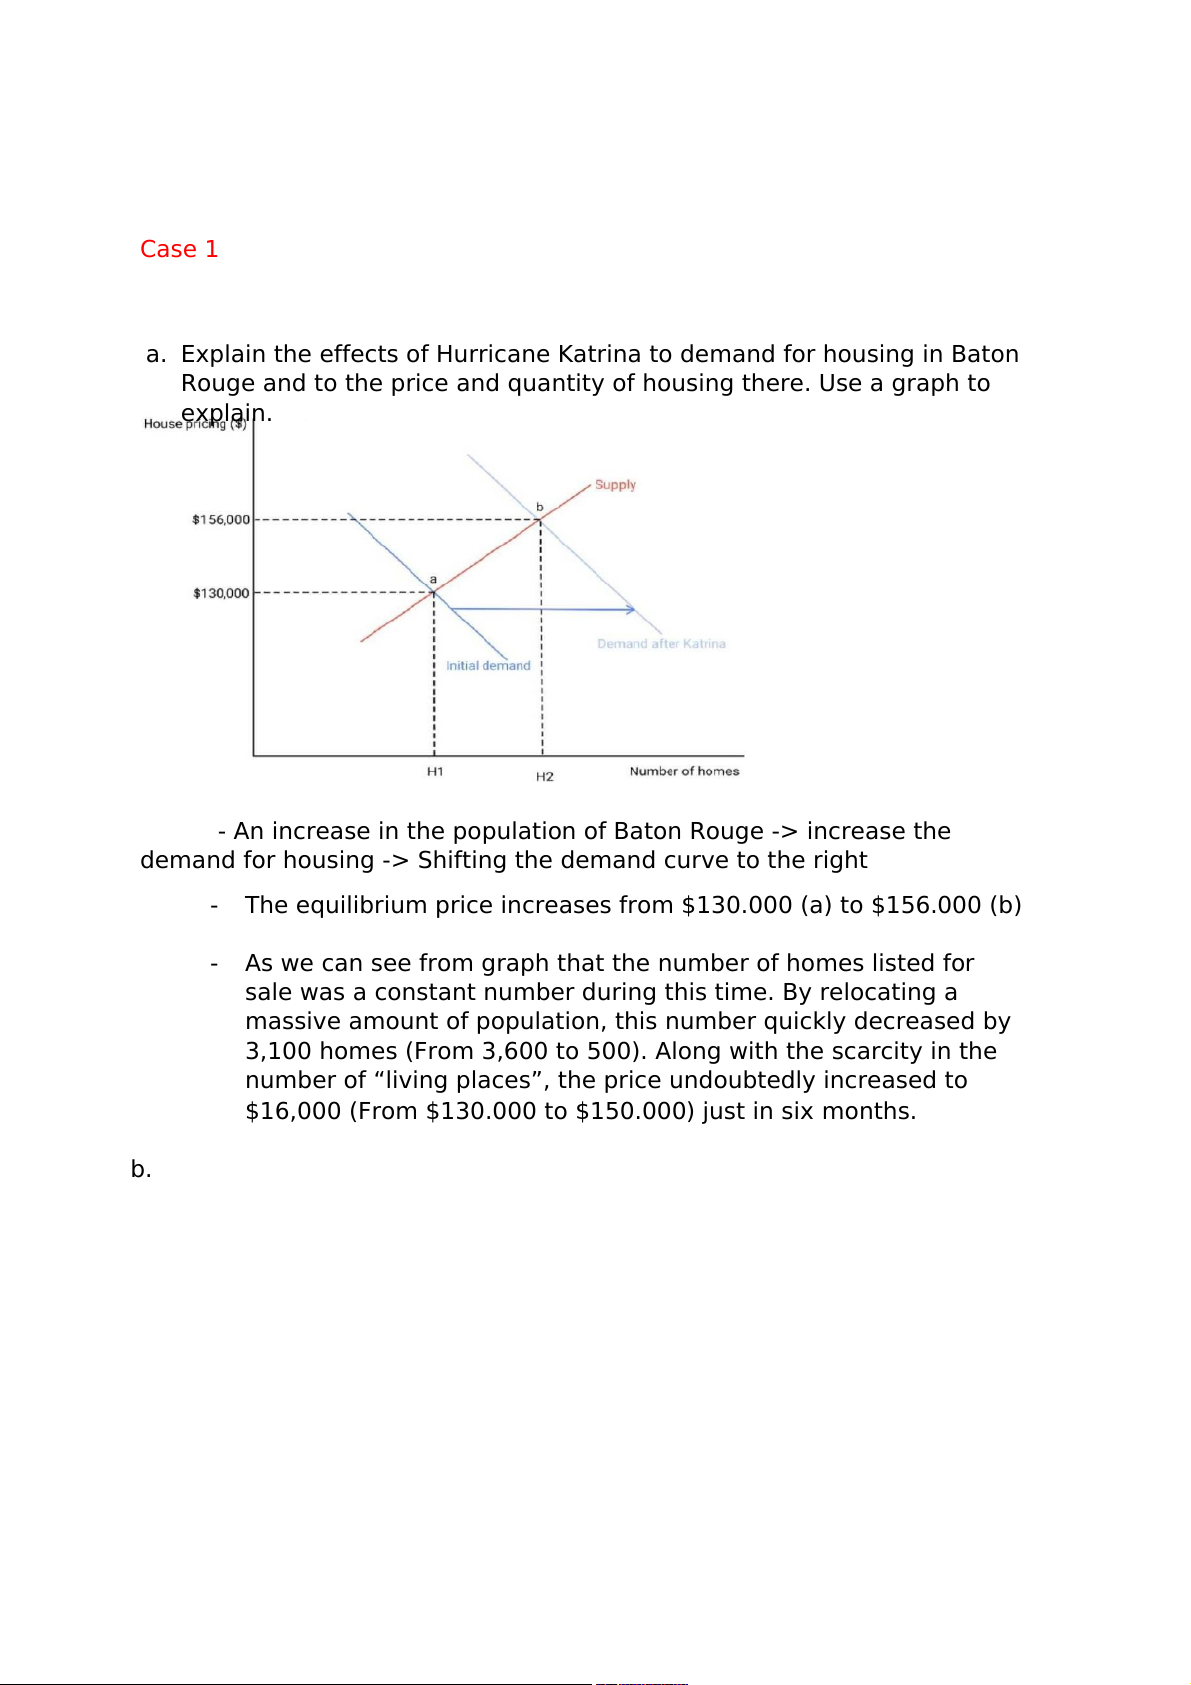
a. Explain the effects of Hurricane Katrina to demand for housing in Baton
Rouge and to the price and quantity of housing there. Use a graph to explain.
- An increase in the population of Baton Rouge -> increase the
demand for housing -> Shifting the demand curve to the right -
The equilibrium price increases from $130.000 (a) to $156.000 (b) -
As we can see from graph that the number of homes listed for
sale was a constant number during this time. By relocating a
massive amount of population, this number quickly decreased by
3,100 homes (From 3,600 to 500). Along with the scarcity in the
number of “living places”, the price undoubtedly increased to
$16,000 (From $130.000 to $150.000) just in six months. b.
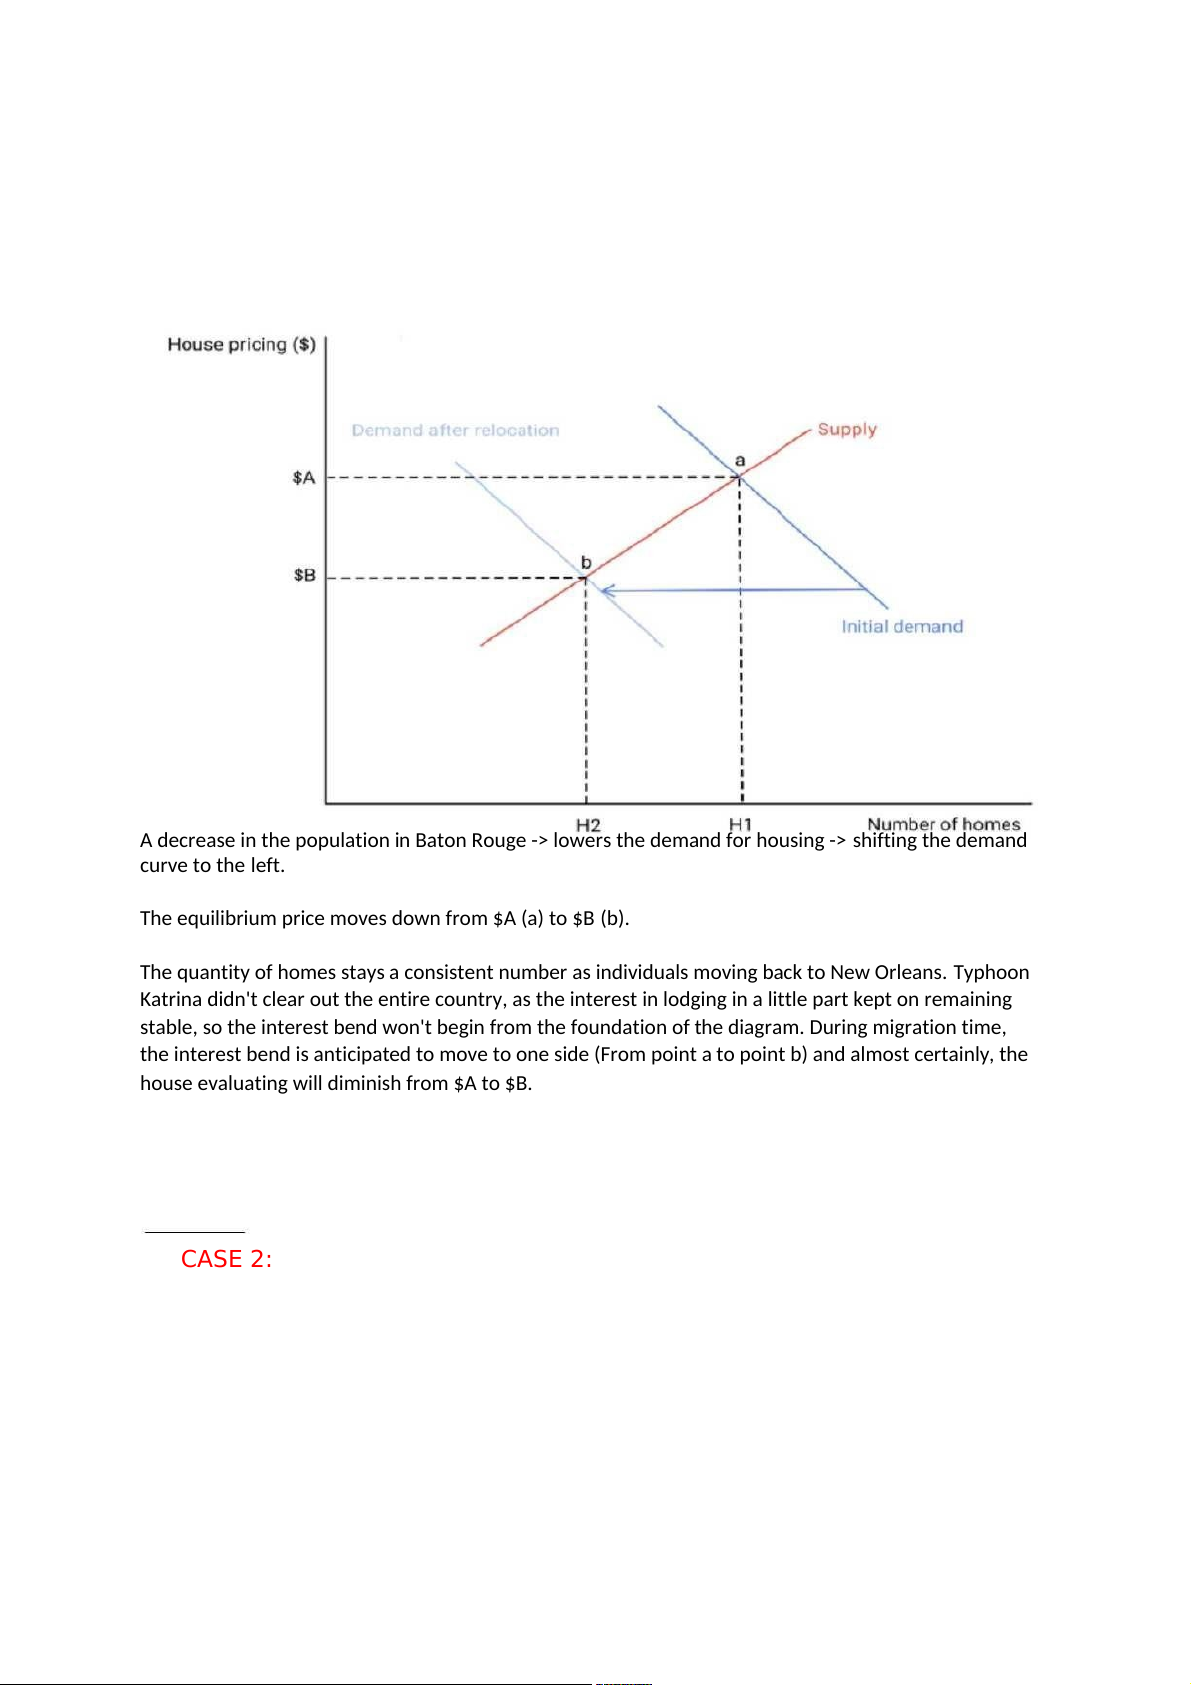
A decrease in the population in Baton Rouge -> lowers the demand for housing -> shifting the demand curve to the left.
The equilibrium price moves down from $A (a) to $B (b).
The quantity of homes stays a consistent number as individuals moving back to New Orleans. Typhoon
Katrina didn't clear out the entire country, as the interest in lodging in a little part kept on remaining
stable, so the interest bend won't begin from the foundation of the diagram. During migration time,
the interest bend is anticipated to move to one side (From point a to point b) and almost certainly, the
house evaluating will diminish from $A to $B. CASE 2: - -
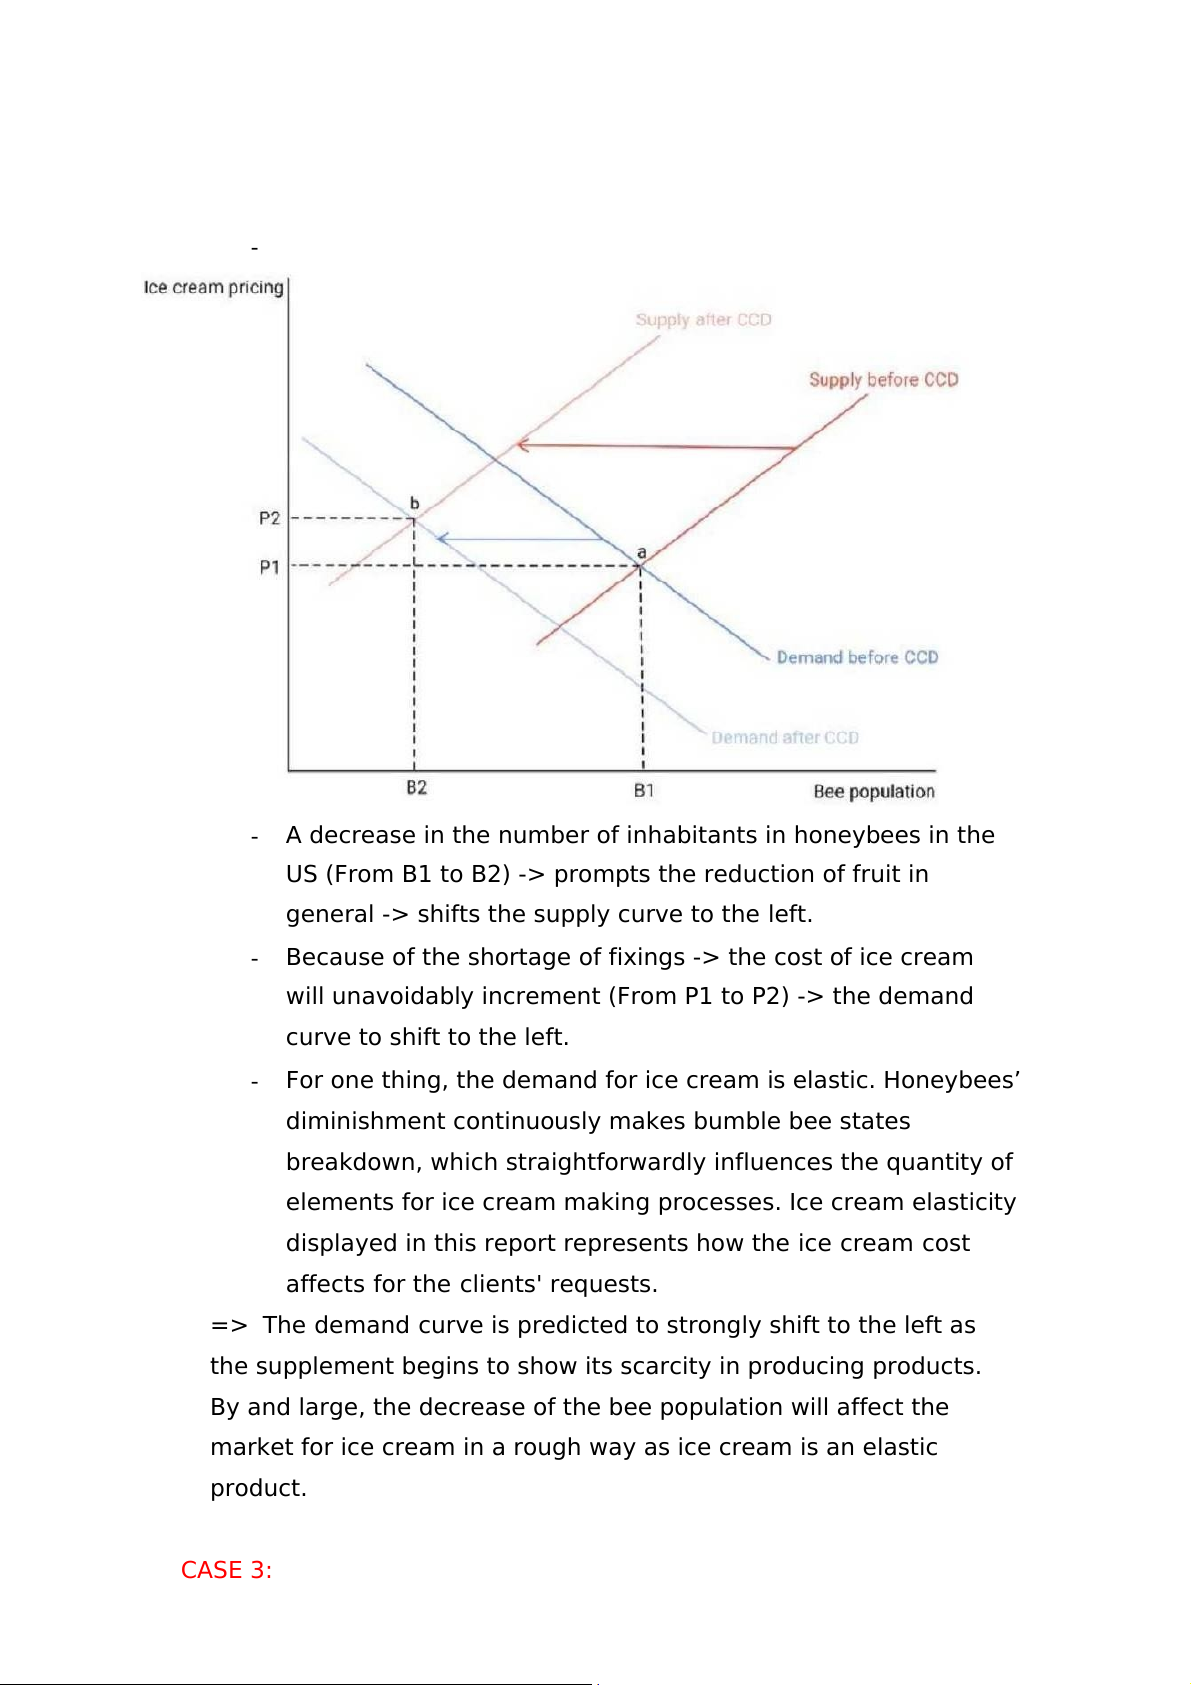
A decrease in the number of inhabitants in honeybees in the
US (From B1 to B2) -> prompts the reduction of fruit in
general -> shifts the supply curve to the left. -
Because of the shortage of fixings -> the cost of ice cream
will unavoidably increment (From P1 to P2) -> the demand curve to shift to the left. -
For one thing, the demand for ice cream is elastic. Honeybees’
diminishment continuously makes bumble bee states
breakdown, which straightforwardly influences the quantity of
elements for ice cream making processes. Ice cream elasticity
displayed in this report represents how the ice cream cost
affects for the clients' requests.
=> The demand curve is predicted to strongly shift to the left as
the supplement begins to show its scarcity in producing products.
By and large, the decrease of the bee population will affect the
market for ice cream in a rough way as ice cream is an elastic product. CASE 3:
3. Problem solving: When a restaurant charges 10$ per meal (per
person) it found that Mr. and Mrs. Binh, who are typical customers, dined
out once a month, Ceteris Paribus. When the restaurant, as a
promotional device, introduced a voucher system giving patrons two
meals for the price of one, the Binh’s dined out three times a month.
Questions a. Calculate the elasticity of demand for this restaurant a. − Q1 = 1 ; Q2 = 3
Percentage change in quantity demanded: %𝛥𝑄 = 2 1 100% = 200% ⋅ − P1 =
$10 ; P2 = $5 Percentage change in price: %𝛥𝑃 = −5 10 × 100% = −50%
Price elasticity of demand: 𝐸𝑃 𝑑 = %𝛥𝑄 %𝛥𝑃 = |− 200% 50% | = 4 > 1 → Elastic
B, As 𝐸𝑑 𝑝 > 1 (elastic) → When price decreases, the demand
increases so the total revenue will increase. With the promotional
vouchers of two meals for the price of one, the number of times
Binh’s family goes to this restaurant increases from once per month
to 3 times per month. The Binh’s monthly expenditure on meals at this restaurant increases 10$.
(P1 = $10 ; Q1 = 2 → TR = $20, P2 = $5 ; Q2 = 6 → TR = $30) → The
change in total expenditure will remained consistent with the value of demand.
Tài liệu liên quan:
-

Chương 3: độ co giãn và các nhân tố ảnh hưởng | Microeconomics | Trường Đại học Quốc tế, Đại học Quốc gia Thành phố Hồ Chí Minh
3 2 -

Microeconomics Syllabus | Microeconomics | Trường Đại học Quốc tế, Đại học Quốc gia Thành phố Hồ Chí Minh
3 2 -

Microeconomics Course Syllabus & Assessment Details | Microeconomics | Trường Đại học Quốc tế, Đại học Quốc gia Thành phố Hồ Chí Minh
3 2 -

Assignment 3 - Elasticity MCQs and Key Concepts | Microeconomics | Trường Đại học Quốc tế, Đại học Quốc gia Thành phố Hồ Chí Minh
3 2 -

Assignment 2 - Economic Equilibrium Analysis of Fridges and Motorcycles | Microeconomics | Trường Đại học Quốc tế, Đại học Quốc gia Thành phố Hồ Chí Minh
3 2