Economics Assignment: Opportunity Cost Analysis and Graphs | Microeconomics | Trường Đại học Quốc tế, Đại học Quốc gia Thành phố Hồ Chí Minh
The cost of one million more cars is 4500 guided missiles. To increase one million cars, we must go from point C to D. We see, from C to D, the economy produces two millions more cars and 9000 less guided missiles. So, to increase one million cars, we need to reduce 9000/2 = 4500 guided missiles. - The cost of one thousand more guided missiles is 2/6 million cars. Tài liệu được sưu tầm và soạn thảo dưới dạng file PDF để gửi tới các bạn cùng tham khảo, ôn tập đầy đủ kiến thức, chuẩn bị cho các buổi học thật tốt. Mời bạn đọc đón xem!
Môn: Microeconomics 635 tài liệu
Trường: Trường Đại học Quốc tế, Đại học Quốc gia Thành phố Hồ Chí Minh 1.9 K tài liệu
Tác giả:

Preview text:
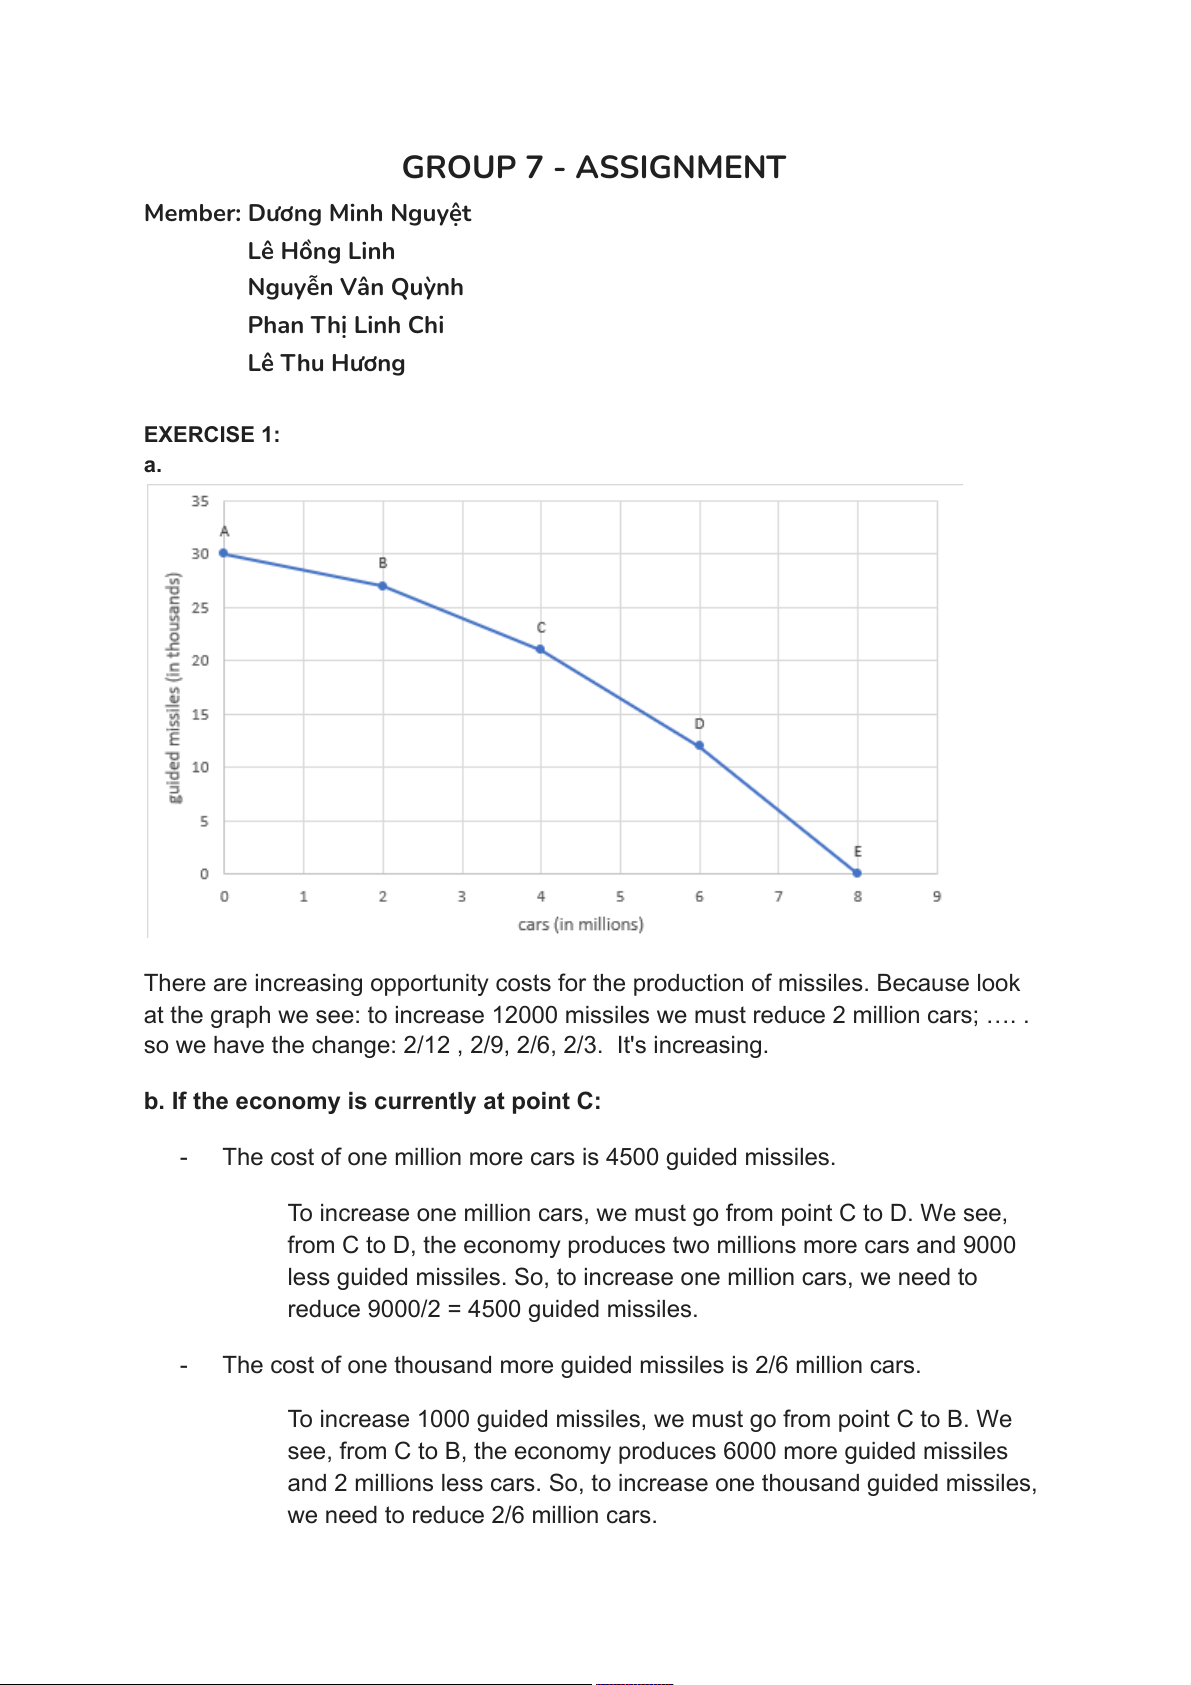
GROUP 7 - ASSIGNMENT Member: Dương Minh Nguyệt Lê Hồng Linh Nguyễn Vân Quỳnh Phan Thị Linh Chi Lê Thu Hương EXERCISE 1: a.
There are increasing opportunity costs for the production of missiles. Because look
at the graph we see: to increase 12000 missiles we must reduce 2 million cars; …. .
so we have the change: 2/12 , 2/9, 2/6, 2/3. It's increasing.
b. If the economy is currently at point C: -
The cost of one million more cars is 4500 guided missiles.
To increase one million cars, we must go from point C to D. We see,
from C to D, the economy produces two millions more cars and 9000
less guided missiles. So, to increase one million cars, we need to
reduce 9000/2 = 4500 guided missiles. -
The cost of one thousand more guided missiles is 2/6 million cars.
To increase 1000 guided missiles, we must go from point C to B. We
see, from C to B, the economy produces 6000 more guided missiles
and 2 millions less cars. So, to increase one thousand guided missiles,
we need to reduce 2/6 million cars.
c. Label a point G inside the curve of the graph. What does it indicate? -
Point G indicates that the economy is producing inefficiently because the
country is not producing enough cars or guided missiles, given the potential of its resources
d. Label a point H that lies outside the PPF curve
*What does this point indicate? -
When point H lies outside the PPF curve, it indicates the goals that the
economy simply cannot attain with its present levels of resources
*What must occur before the economy can attain the level of production indicated by point H? -
Economic growth through more inputs, better inputs, improved technology
must be achieved to attain H (inputs can be labor, fuel, materials, buildings, and equipment)
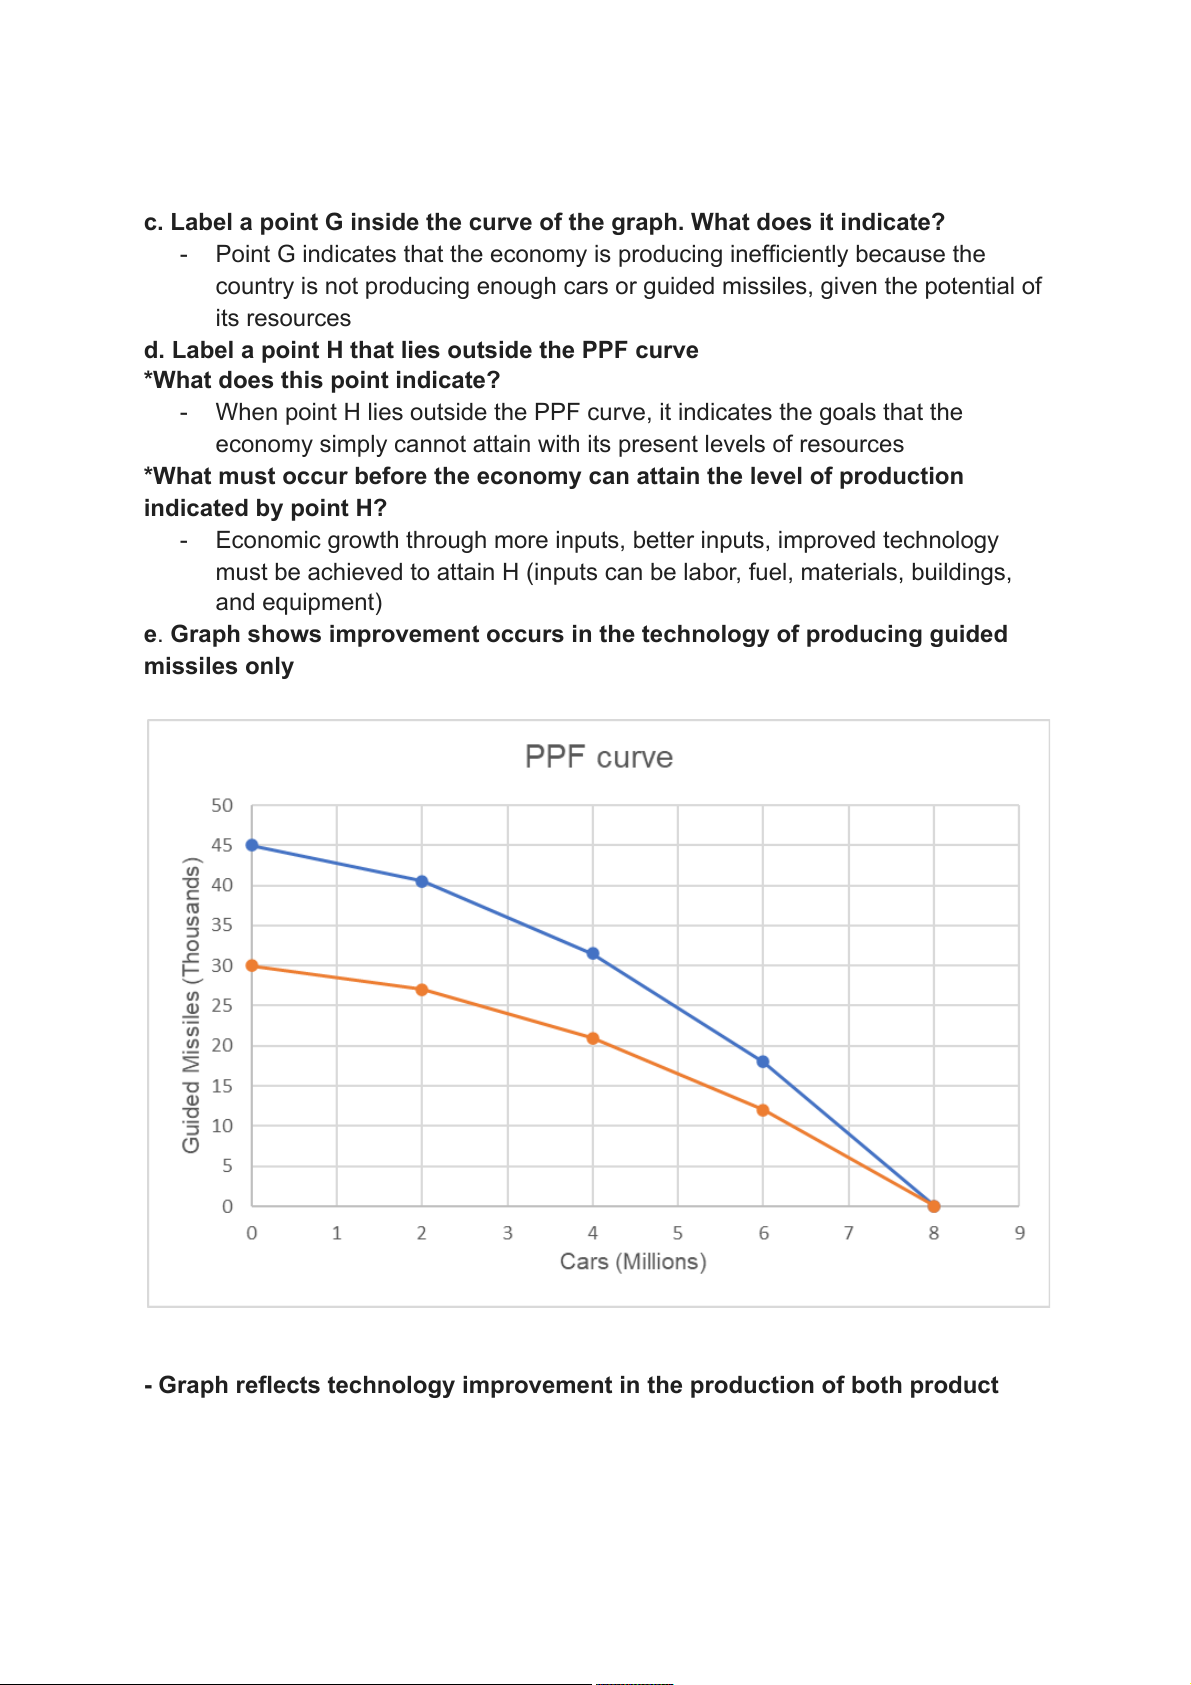
e. Graph shows improvement occurs in the technology of producing guided missiles only
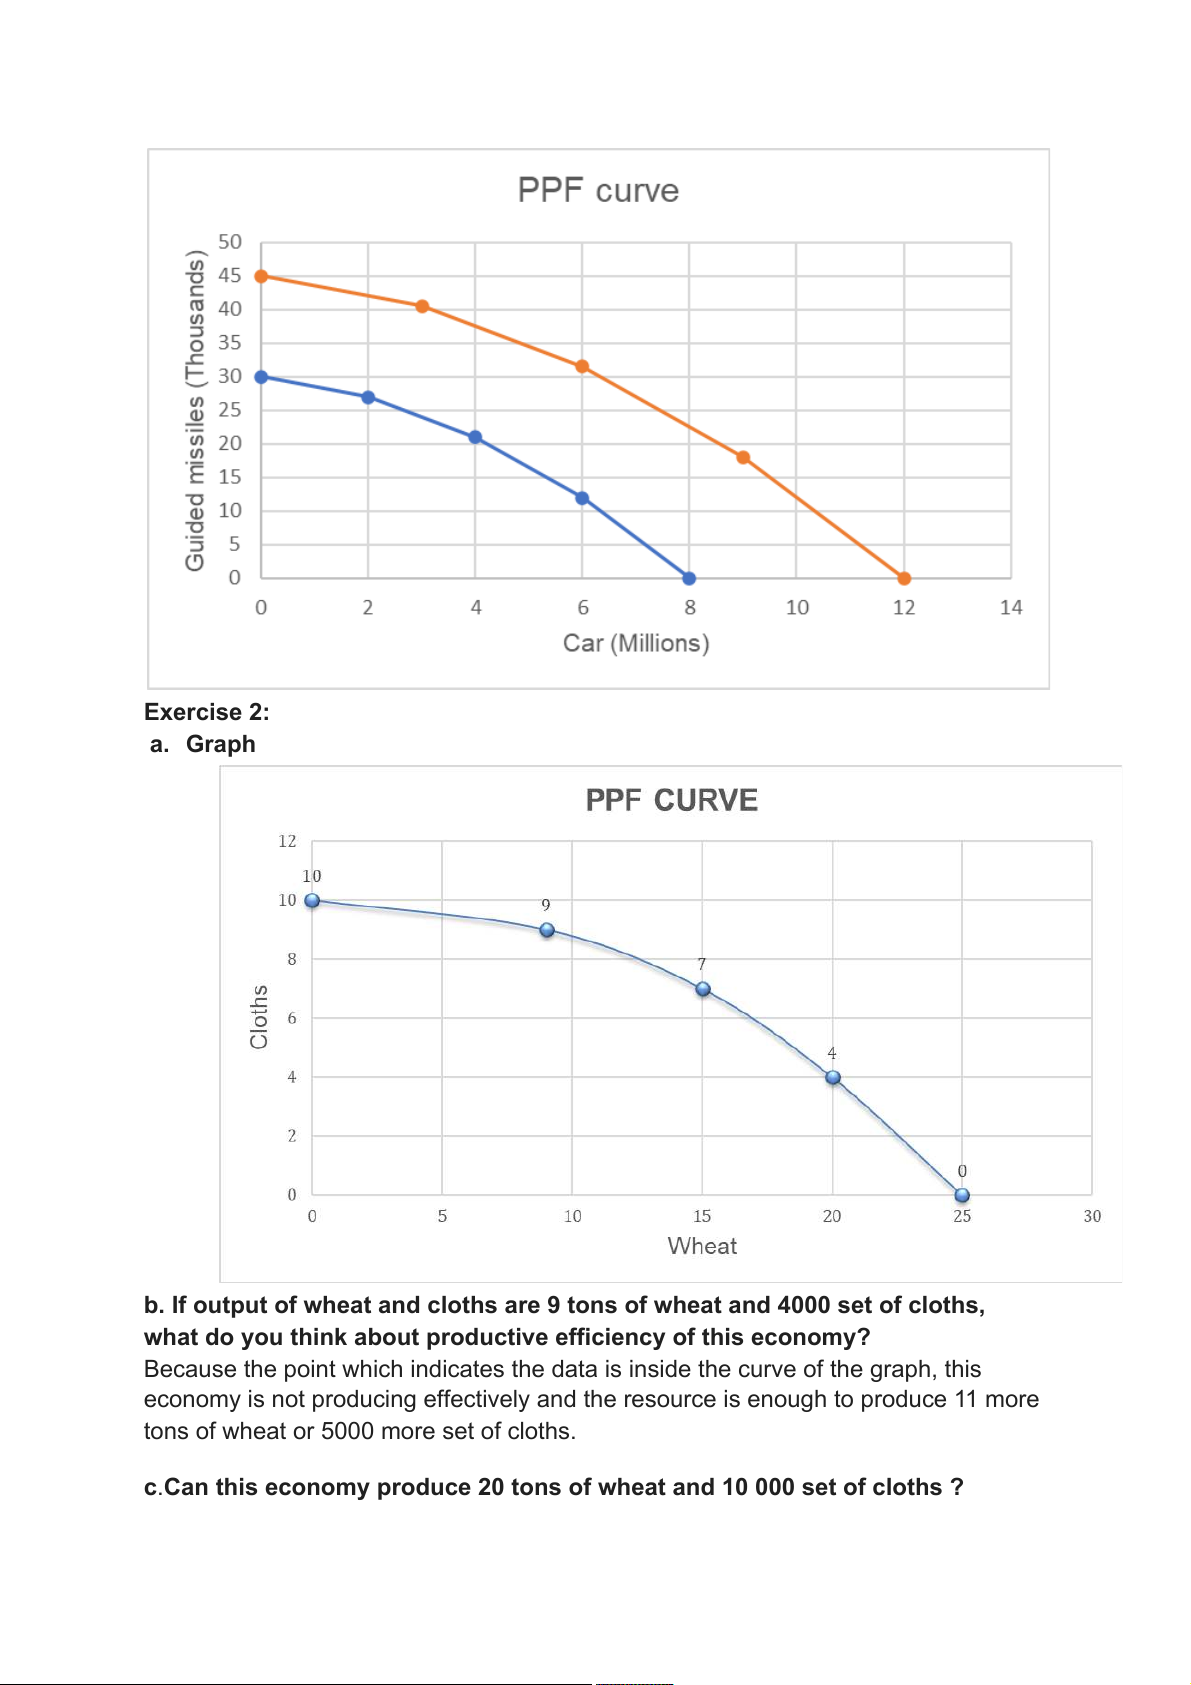
- Graph reflects technology improvement in the production of both product Exercise 2: a. Graph
b. If output of wheat and cloths are 9 tons of wheat and 4000 set of cloths,
what do you think about productive efficiency of this economy?
Because the point which indicates the data is inside the curve of the graph, this
economy is not producing effectively and the resource is enough to produce 11 more
tons of wheat or 5000 more set of cloths.
c.Can this economy produce 20 tons of wheat and 10 000 set of cloths ?
No. This economy cannot produce 20 tons of wheat and 10 000 set of cloths
because this point lies outside the PPF curve.
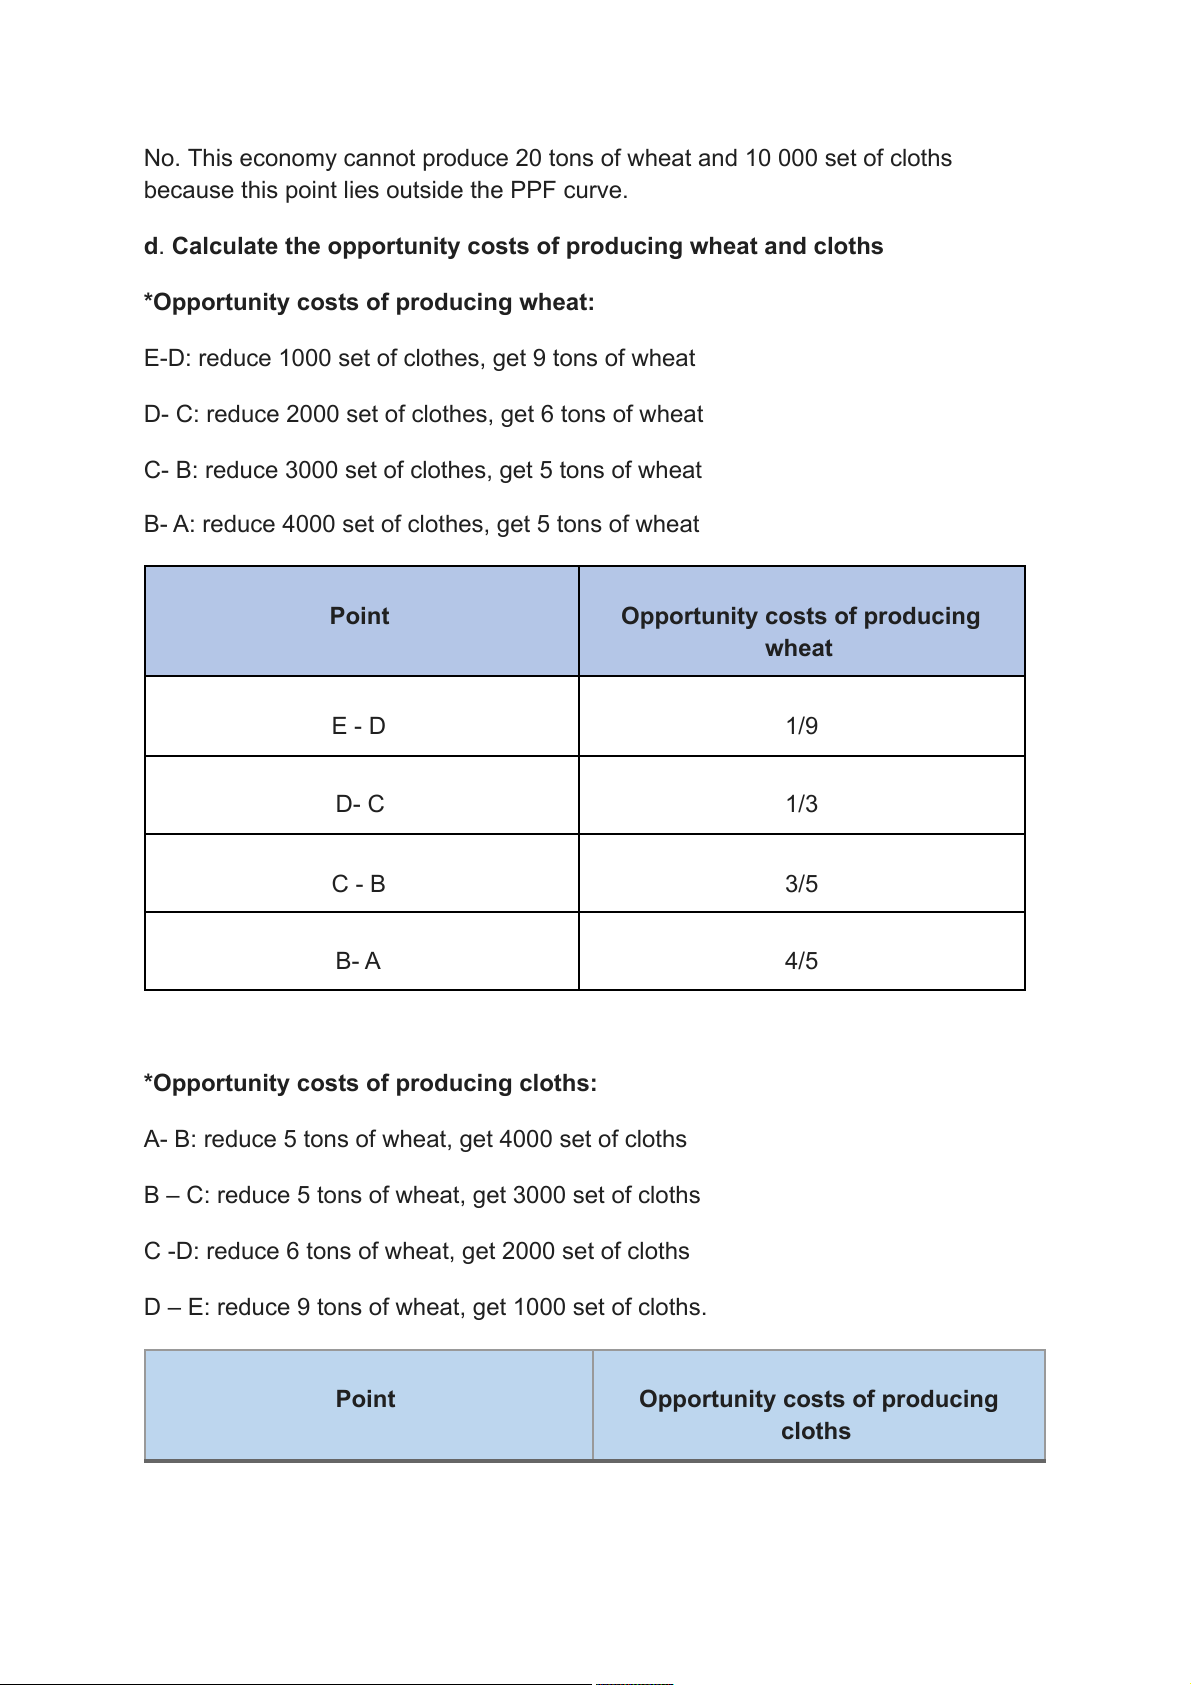
d. Calculate the opportunity costs of producing wheat and cloths
*Opportunity costs of producing wheat:
E-D: reduce 1000 set of clothes, get 9 tons of wheat
D- C: reduce 2000 set of clothes, get 6 tons of wheat
C- B: reduce 3000 set of clothes, get 5 tons of wheat
B- A: reduce 4000 set of clothes, get 5 tons of wheat Point Opportunity costs of producing wheat E - D 1/9 D- C 1/3 C - B 3/5 B- A 4/5
*Opportunity costs of producing cloths:
A- B: reduce 5 tons of wheat, get 4000 set of cloths
B – C: reduce 5 tons of wheat, get 3000 set of cloths
C -D: reduce 6 tons of wheat, get 2000 set of cloths
D – E: reduce 9 tons of wheat, get 1000 set of cloths. Point Opportunity costs of producing cloths A - B 5/4 B - C 5/3 C - D 3 D - E 9
Tài liệu liên quan:
-

Chương 3: độ co giãn và các nhân tố ảnh hưởng | Microeconomics | Trường Đại học Quốc tế, Đại học Quốc gia Thành phố Hồ Chí Minh
5 3 -

Microeconomics Syllabus | Microeconomics | Trường Đại học Quốc tế, Đại học Quốc gia Thành phố Hồ Chí Minh
5 3 -

Microeconomics Course Syllabus & Assessment Details | Microeconomics | Trường Đại học Quốc tế, Đại học Quốc gia Thành phố Hồ Chí Minh
5 3 -

Assignment 3 - Elasticity MCQs and Key Concepts | Microeconomics | Trường Đại học Quốc tế, Đại học Quốc gia Thành phố Hồ Chí Minh
5 3 -

Assignment 2 - Economic Equilibrium Analysis of Fridges and Motorcycles | Microeconomics | Trường Đại học Quốc tế, Đại học Quốc gia Thành phố Hồ Chí Minh
5 3