Financial Markets: Understanding Home Equity and Capital Supply | Microeconomics | Trường Đại học Quốc tế, Đại học Quốc gia Thành phố Hồ Chí Minh
When a firm needs to buy new equipment or build a new facility, it often must go to the financial market to raise funds. Usually firms will add capacity during an economic expansion when profits are on the rise and consumer demand is high. Business investment is one of the critical ingredients needed to sustain economic growth. Even in the sluggish 2009 economy, U.S. firms invested $1.4 trillion in new equipment and structures, in the hope that these investments would generate profits in the years ahead. Tài liệu được sưu tầm và soạn thảo dưới dạng file PDF để gửi tới các bạn cùng tham khảo, ôn tập đầy đủ kiến thức, chuẩn bị cho các buổi học thật tốt. Mời bạn đọc đón xem!
Môn: Microeconomics 483 tài liệu
Trường: Trường Đại học Quốc tế, Đại học Quốc gia Thành phố Hồ Chí Minh 1.8 K tài liệu
Tác giả:


Preview text:
Financial Markets 17
FIGURE17.1 Building Home Equity Many people choose to purchase their home rather than rent. This chapter
explores how the global financial crisis has influenced home ownership. (Credit: “red sold sign” by Diana Parkhouse/
Flickr Creative Commons, CC BY 2.0) CHAPTER OBJECTIVES
In this chapter, you will learn about:
• How Businesses Raise Financial Capital
• How Households Supply Financial Capital
• How to Accumulate Personal Wealth
Introduction to Financial Markets BRING IT HOME
The Housing Bubble and the 2007 Financial Crisis
In 2006, housing equity in the United States peaked at $13 trillion. That means that the market prices of homes,
less what was still owed on the loans they used to buy these houses, equaled $13 trillion. This was a very good
number, since the equity represented the value of the financial asset most U.S. citizens owned.
However, by 2008 this number declined to $8.8 trillion, and it plummeted further still in 2009. Combined with the
decline in value of other financial assets held by U.S. citizens, by 2010, U.S. homeowners’ wealth had shrunk $14
trillion! This is a staggering result, and it affected millions of lives: people had to alter their retirement, housing, and
other important consumption decisions. Just about every other large economy in the world suffered a decline in the
market value of financial assets, as a result of the 2008-2009 global financial crisis.
This chapter will explain why people purchase houses (other than as a place to live), why they buy other types of 408
17 • Financial Markets
financial assets, and why businesses sell those financial assets in the first place. The chapter will also give us insight
into why financial markets and assets go through boom and bust cycles like the one we described here.
When a firm needs to buy new equipment or build a new facility, it often must go to the financial market to
raise funds. Usually firms will add capacity during an economic expansion when profits are on the rise and
consumer demand is high. Business investment is one of the critical ingredients needed to sustain economic
growth. Even in the sluggish 2009 economy, U.S. firms invested $1.4 trillion in new equipment and structures,
in the hope that these investments would generate profits in the years ahead.
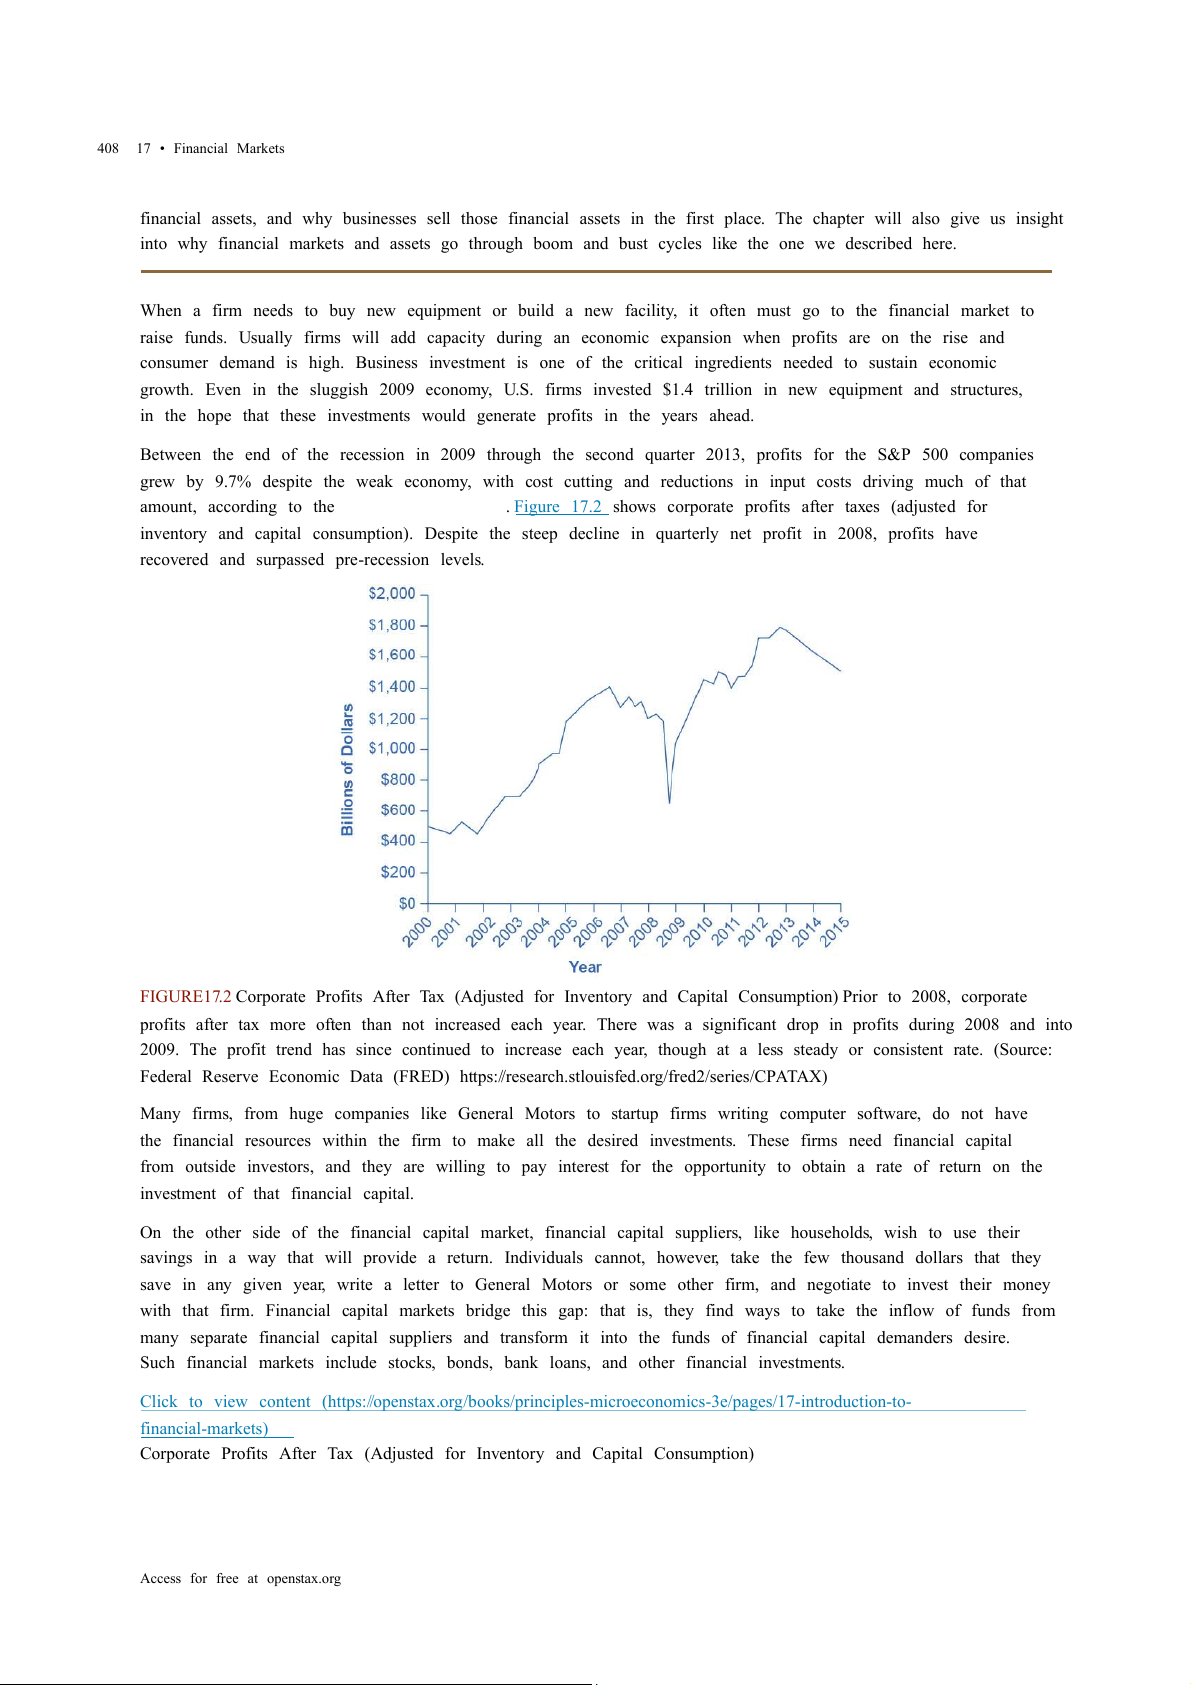
Between the end of the recession in 2009 through the second quarter 2013, profits for the S&P 500 companies
grew by 9.7% despite the weak economy, with cost cutting and reductions in input costs driving much of that
amount, according to the Wall Street Journal . Figure 17.2 shows corporate profits after taxes (adjusted for
inventory and capital consumption). Despite the steep decline in quarterly net profit in 2008, profits have
recovered and surpassed pre-recession levels.
FIGURE17.2 Corporate Profits After Tax (Adjusted for Inventory and Capital Consumption) Prior to 2008, corporate
profits after tax more often than not increased each year. There was a significant drop in profits during 2008 and into
2009. The profit trend has since continued to increase each year, though at a less steady or consistent rate. (Source:
Federal Reserve Economic Data (FRED) https://research.stlouisfed.org/fred2/series/CPATAX)
Many firms, from huge companies like General Motors to startup firms writing computer software, do not have
the financial resources within the firm to make all the desired investments. These firms need financial capital
from outside investors, and they are willing to pay interest for the opportunity to obtain a rate of return on the
investment of that financial capital.
On the other side of the financial capital market, financial capital suppliers, like households, wish to use their
savings in a way that will provide a return. Individuals cannot, however, take the few thousand dollars that they
save in any given year, write a letter to General Motors or some other firm, and negotiate to invest their money
with that firm. Financial capital markets bridge this gap: that is, they find ways to take the inflow of funds from
many separate financial capital suppliers and transform it into the funds of financial capital demanders desire.
Such financial markets include stocks, bonds, bank loans, and other financial investments.
Click to view content (https://openstax.org/books/principles-microeconomics-3e/pages/17-introduction-to- financial-markets)
Corporate Profits After Tax (Adjusted for Inventory and Capital Consumption)
Access for free at openstax.org
17.1 • How Businesses Raise Financial Capital 409 LINK IT UP
Visit this website (http://openstax.org/l/marketoverview) to read more about financial markets.
Our perspective then shifts to consider how these financial investments appear to capital suppliers such as the
households that are saving funds. Households have a range of investment options: bank accounts, certificates
of deposit, money market mutual funds, bonds, stocks, stock and bond mutual funds, housing, and even
tangible assets like gold. Finally, the chapter investigates two methods for becoming rich: a quick and easy
method that does not work very well at all, and a slow, reliable method that can work very well over a lifetime.
17.1 How Businesses Raise Financial Capital LEARNING OBJECTIVES
By the end of this section, you will be able to:
• Describe financial capital and how it relates to profits
• Discuss the purpose and process of borrowing, bonds, and corporate stock
• Explain how firms choose between sources of financial capital
Firms often make decisions that involve spending money in the present and expecting to earn profits in the
future. Examples include when a firm buys a machine that will last 10 years, or builds a new plant that will last
for 30 years, or starts a research and development project. Firms can raise the financial capital they need to
pay for such projects in four main ways: (1) from early-stage investors; (2) by reinvesting profits; (3) by
borrowing through banks or bonds; and (4) by selling stock. When business owners choose financial capital
sources, they also choose how to pay for them.
Early-Stage Financial Capital
Firms that are just beginning often have an idea or a prototype for a product or service to sell, but few
customers, or even no customers at all, and thus are not earning profits. Such firms face a difficult problem
when it comes to raising financial capital: How can a firm that has not yet demonstrated any ability to earn
profits pay a rate of return to financial investors?
For many small businesses, the original source of money is the business owner. Someone who decides to start
a restaurant or a gas station, for instance, might cover the startup costs by dipping into their own bank
account, or by borrowing money (perhaps using a home as collateral). Alternatively, many cities have a
network of well-to-do individuals, known as “angel investors,” who will put their own money into small new
companies at an early development stage, in exchange for owning some portion of the firm.
Venture capitalfirms make financial investments in new companies that are still relatively small in size, but
that have potential to grow substantially. These firms gather money from a variety of individual or institutional
investors, including banks, institutions like college endowments, insurance companies that hold financial
reserves, and corporate pension funds. Venture capital firms do more than just supply money to small
startups. They also provide advice on potential products, customers, and key employees. Typically, a venture
capital fund invests in a number of firms, and then investors in that fund receive returns according to how the fund as a whole performs.
The amount of money invested in venture capital fluctuates substantially from year to year: as one example,
venture capital firms invested more than $48.3 billion in 2014, according to the National Venture Capital
Association. All early-stage investors realize that the majority of small startup businesses will never hit it big;
many of them will go out of business within a few months or years. They also know that getting in on the
ground floor of a few huge successes like a Netflix or an Amazon.com can make up for multiple failures.
Therefore, early-stage investors are willing to take large risks in order to position themselves to gain
substantial returns on their investment. 410
17 • Financial Markets
Profits as a Source of Financial Capital
If firms are earning profits (their revenues are greater than costs), they can choose to reinvest some of these
profits in equipment, structures, and research and development. For many established companies, reinvesting
their own profits is one primary source of financial capital. Companies and firms just getting started may have
numerous attractive investment opportunities, but few current profits to invest. Even large firms can
experience a year or two of earning low profits or even suffering losses, but unless the firm can find a steady
and reliable financial capital source so that it can continue making real investments in tough times, the firm
may not survive until better times arrive. Firms often need to find financial capital sources other than profits.
Borrowing: Banks and Bonds
When a firm has a record of at least earning significant revenues, and better still of earning profits, the firm
can make a credible promise to pay interest, and so it becomes possible for the firm to borrow money. Firms
have two main borrowing methods: banks and bonds.
A bank loan for a firm works in much the same way as a loan for an individual who is buying a car or a house.
The firm borrows an amount of money and then promises to repay it, including some rate of interest, over a
predetermined period of time. If the firm fails to make its loan payments, the bank (or banks) can often take
the firm to court and require it to sell its buildings or equipment to make the loan payments.
Another source of financial capital is a bond. A bondis a financial contract: a borrower agrees to repay the
amount that it borrowed and also an interest rate over a period of time in the future. A corporate bondis
issued by firms, but bonds are also issued by various levels of government. For example, a municipal bondis
issued by cities, a state bond by U.S. states, and a Treasury bondby the federal government through the U.S.
Department of the Treasury. A bond specifies an amount that one will borrow, the interest rate that one will
pay, and the time until repayment.
A large company, for example, might issue bonds for $10 million. The firm promises to make interest
payments at an annual rate of 8%, or $800,000 per year and then, after 10 years, will repay the $10 million it
originally borrowed. When a firm issues bonds, it may choose to issue many bonds in smaller amounts that
together reach the total amount it wishes to raise. A firm that seeks to borrow $50 million by issuing bonds,
might actually issue 10,000 bonds of $5,000 each. In this way, an individual investor could, in effect, loan the
firm $5,000, or any multiple of that amount. Anyone who owns a bond and receives the interest payments is
called a bondholder. If a firm issues bonds and fails to make the promised interest payments, the bondholders
can take the firm to court and require it to pay, even if the firm needs to raise the money by selling buildings or
equipment. However, there is no guarantee the firm will have sufficient assets to pay off the bonds. The
bondholders may recoup only a portion of what they loaned the firm.
Bank borrowing is more customized than issuing bonds, so it often works better for relatively small firms. The
bank can get to know the firm extremely well—often because the bank can monitor sales and expenses quite
accurately by looking at deposits and withdrawals. Relatively large and well-known firms often issue bonds
instead. They use bonds to raise new financial capital that pays for investments, or to raise capital to pay off
old bonds, or to buy other firms. However, the idea that firms or individuals use banks for relatively smaller
loans and bonds for larger loans is not an ironclad rule: sometimes groups of banks make large loans and
sometimes relatively small and lesser-known firms issue bonds.
Corporate Stock and Public Firms
A corporationis a business that “incorporates”—that is owned by shareholders that have limited liability for
the company's debt but share in its profits (and losses). Corporations may be private or public, and may or may
not have publicly traded stock. They may raise funds to finance their operations or new investments by raising
capital through selling stock or issuing bonds.
Those who buy the stock become the firm's owners, or shareholders. Stockrepresents firm ownership; that is,
Access for free at openstax.org
17.1 • How Businesses Raise Financial Capital 411
a person who owns 100% of a company’s stock, by definition, owns the entire company. The company's stock
is divided into shares. Corporate giants like IBM, AT&T, Ford, General Electric, Microsoft, Merck, and Exxon all
have millions of stock shares. In most large and well-known firms, no individual owns a majority of the stock
shares. Instead, large numbers of shareholders—even those who hold thousands of shares—each have only a
small slice of the firm's overall ownership.
When a large number of shareholders own a company, there are three questions to ask:
1. How and when does the company obtain money from its sale of stock?
2. What rate of return does the company promise to pay when it sells stock?
3. Who makes decisions in a company owned by a large number of shareholders?
First, a firm receives money from the stock sale only when the company sells its own stock to the public (the
public includes individuals, mutual funds, insurance companies, and pension funds). We call a firm’s first
stock sale to the public an initial public offering (IPO). The IPO is important for two reasons. For one, the IPO,
and any stock issued thereafter, such as stock held as treasury stock (shares that a company keeps in their own
treasury) or new stock issued later as a secondary offering, provides the funds to repay the early-stage
investors, like the angel investors and the venture capital firms. A venture capital firm may have a 40%
ownership in the firm. When the firm sells stock, the venture capital firm sells its part ownership of the firm to
the public. A second reason for the importance of the IPO is that it provides the established company with
financial capital for substantially expanding its operations.
However, most of the time when one buys and sells corporate stock the firm receives no financial return at all.
If you buy General Motors stock, you almost certainly buy it from the current share owner, and General Motors
does not receive any of your money. This pattern should not seem particularly odd. After all, if you buy a house,
the current owner receives your money, not the original house builder. Similarly, when you buy stock shares,
you are buying a small slice of the firm's ownership from the existing owner—and the firm that originally
issued the stock is not a part of this transaction.
Second, when a firm decides to issue stock, it must recognize that investors will expect to receive a rate of
return. That rate of return can come in two forms. A firm can make a direct payment to its shareholders, called
a dividend. Alternatively, a financial investor might buy a share of stock in Wal-Mart for $45 and then later sell
it to someone else for $60, for $15 gain. We call the increase in the stock value (or of any asset) between when
one buys and sells it a capital gain.
Third: Who makes the decisions about when a firm will issue stock, or pay dividends, or re-invest profits? To
understand the answers to these questions, it is useful to separate firms into two groups: private and public.
A private companyis frequently owned by the people who generally run it on a day-to-day basis. Individuals
can run a private company. We call this a sole proprietorship. If a group runs it, we call it a partnership. A
private company can also be a corporation, but with no publicly issued stock. A small law firm run by one
person, even if it employs some other lawyers, would be a sole proprietorship. Partners may jointly own a
larger law firm. Most private companies are relatively small, but there are some large private corporations,
with tens of billions of dollars in annual sales, that do not have publicly issued stock, such as farm products
dealer Cargill, the Mars candy company, and the Bechtel engineering and construction firm.
When a firm decides to sell stock, which financial investors can buy and sell, we call it a public company.
Shareholders own a public company. Since the shareholders are a very broad group, often consisting of
thousands or even millions of investors, the shareholders vote for a board of directors, who in turn hire top
executives to run the firm on a day-to-day basis. The more stock a shareholder owns, the more votes that
shareholder is entitled to cast for the company’s board of directors.
In theory, the board of directors helps to ensure that the firm runs in the interests of the true owners—the
shareholders. However, the top executives who run the firm have a strong voice in choosing the candidates 412
17 • Financial Markets
who will serve on their board of directors. After all, few shareholders are knowledgeable enough or have
enough personal incentive to spend energy and money nominating alternative board members.
How Firms Choose between Financial Capital Sources
There are clear patterns in how businesses raise financial capital. We can explain these patterns in terms of
imperfect information, which as we discussed in Information, Risk, and Insurance, is a situation where buyers
and sellers in a market do not both have full and equal information. Those who are actually running a firm will
almost always have more information about whether the firm is likely to earn profits in the future than outside
investors who provide financial capital.
Any young startup firm is a risk. Some startup firms are only a little more than an idea on paper. The firm’s
founders inevitably have better information than anyone else about how hard they are willing to work, and
whether the firm is likely to succeed. When the founders invested their own money into the firm, they
demonstrate a belief in its prospects. At this early stage, angel investors and venture capitalists try to
overcome the imperfect information, at least in part, by knowing the managers and their business plan
personally and by giving them advice.
Accurate information is sometimes not available because corporate governance, the name economists give to
the institutions that are supposed to watch over top executives, fails, as the following Clear It Up feature on Lehman Brothers shows. CLEAR IT UP
How did lack of corporate governance lead to the Lehman Brothers failure?
In 2008, Lehman Brothers was the fourth largest U.S. investment bank, with 25,000 employees. The firm had been
in business for 164 years. On September 15, 2008, Lehman Brothers filed for Chapter 11 bankruptcy protection.
There are many causes of the Lehman Brothers failure. One area of apparent failure was the lack of oversight by the
Board of Directors to keep managers from undertaking excessive risk. We can attribute part of the oversight failure,
according to Tim Geithner’s April 10, 2010, testimony to Congress, to the Executive Compensation Committee’s
emphasis on short-term gains without enough consideration of the risks. In addition, according to the court
examiner’s report, the Lehman Brother’s Board of Directors paid too little attention to the details of the operations
of Lehman Brothers and also had limited financial service experience.
The board of directors, elected by the shareholders, is supposed to be the first line of corporate governance and
oversight for top executives. A second institution of corporate governance is the auditing firm the company hires to
review the company's financial records and certify that everything looks reasonable. A third institution of corporate
governance is outside investors, especially large shareholders like those who invest large mutual funds or pension
funds. In the case of Lehman Brothers, corporate governance failed to provide investors with accurate financial
information about the firm’s operations.
As a firm becomes at least somewhat established and its strategy appears likely to lead to profits in the near
future, knowing the individual managers and their business plans on a personal basis becomes less important,
because information has become more widely available regarding the company’s products, revenues, costs,
and profits. As a result, other outside investors who do not know the managers personally, like bondholders
and shareholders, are more willing to provide financial capital to the firm.
At this point, a firm must often choose how to access financial capital. It may choose to borrow from a bank,
issue bonds, or issue stock. The great disadvantage of borrowing money from a bank or issuing bonds is that
the firm commits to scheduled interest payments, whether or not it has sufficient income. The great advantage
of borrowing money is that the firm maintains control of its operations and is not subject to shareholders.
Issuing stock involves selling off company ownership to the public and becoming responsible to a board of
Access for free at openstax.org
17.2 • How Households Supply Financial Capital 413
directors and the shareholders.
The benefit of issuing stock is that a small and growing firm increases its visibility in the financial markets and
can access large amounts of financial capital for expansion, without worrying about repaying this money. If the
firm is successful and profitable, the board of directors will need to decide upon a dividend payout or how to
reinvest profits to further grow the company. Issuing and placing stock is expensive, requires the expertise of
investment bankers and attorneys, and entails compliance with reporting requirements to shareholders and
government agencies, such as the federal Securities and Exchange Commission (SEC).
17.2 How Households Supply Financial Capital LEARNING OBJECTIVES
By the end of this section, you will be able to:
• Show the relationship between savers, banks, and borrowers • Calculate bond yield
• Contrast bonds, stocks, mutual funds, and assets
• Explain the tradeoffs between return and risk
The ways in which firms would prefer to raise funds are only half the story of financial markets. The other half
is what those households and individuals who supply funds desire, and how they perceive the available
choices. The focus of our discussion now shifts from firms on the demand side of financial capital markets to
households on the supply side of those markets. We can divide the mechanisms for savings available to
households into several categories: deposits in bank accounts; bonds; stocks; money market mutual funds;
stock and bond mutual funds; and housing and other tangible assets like owning gold. We need to analyze each
of these investments in terms of three factors: (1) the expected rate of return it will pay; (2) the risk that the
return will be much lower or higher than expected; and (3) the investment's liquidity, which refers to how
easily one can exchange money or financial assets for a good or service. We will do this analysis as we discuss
each of these investments in the sections below. First, however, we need to understand the difference between
expected rate of return, risk, and actual rate of return.
Expected Rate of Return, Risk, and Actual Rate of Return
The expected rate of returnrefers to how much a project or an investment is expected to return to the
investor, either in future interest payments, capital gains, or increased profitability. It is usually the average
return over a period of time, usually in years or even decades. We normally measure it as a percentage rate.
Riskmeasures the uncertainty of that project’s profitability. There are several types of risk, including default
risk and interest rate risk. Default risk, as its name suggests, is the risk that the borrower fails to pay back the
bond or loan. Interest rate risk is the danger that you might buy a long term bond at a 6% interest rate right
before market rates suddenly rise, so had you waited, you could have received a similar bond that paid 9%. A
high-risk investment is one for which a wide range of potential payoffs is reasonably probable. A low-risk
investment may have actual returns that are fairly close to its expected rate of return year after year. A high-
risk investment will have actual returns that are much higher than the expected rate of return in some months
or years and much lower in other months or years. The actual rate of returnrefers to the total rate of return,
including capital gains and interest paid on an investment at the end of a time period. Bank Accounts
An intermediary is one who stands between two other parties. For example, a person who arranges a blind
date between two other people is one kind of intermediary. In financial capital markets, banks are an example
of a financial intermediar —that y
is, an institution that operates between a saver who deposits funds in a bank
and a borrower who receives a loan from that bank. When a bank serves as a financial intermediary, unlike the
situation with a couple on a blind date, the saver and the borrower never meet. In fact, it is not even possible to
make direct connections between those who deposit funds in banks and those who borrow from banks,
because all deposited funds end up in one big pool, which the financial institution then lends out. 414
17 • Financial Markets
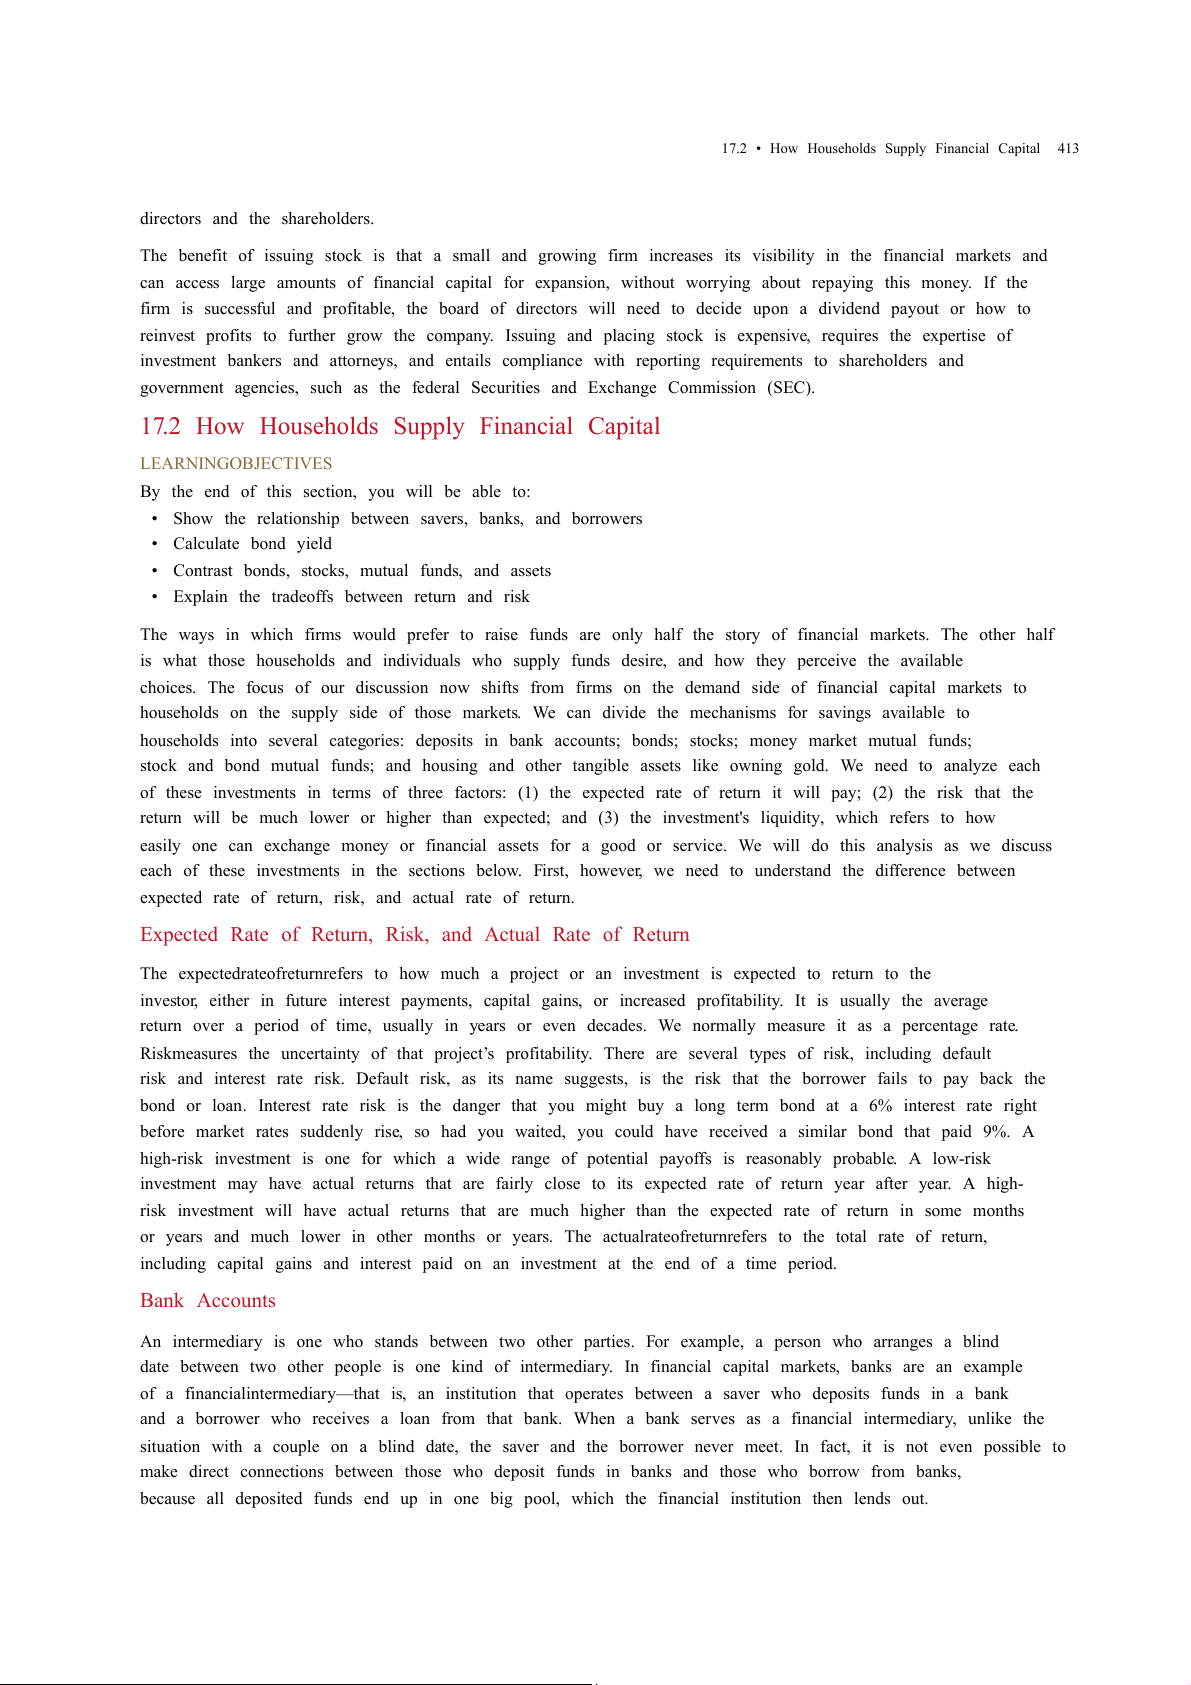
Figure 17.3 illustrates the position of banks as a financial intermediary, with a pattern of deposits flowing into
a bank and loans flowing out, and then repayment of the loans flowing back to the bank, with interest
payments for the original savers.
FIGURE17.3 Banks as Financial Intermediaries Banks are a financial intermediary because they stand between
savers and borrowers. Savers place deposits with banks, and then receive interest payments and withdraw money.
Borrowers receive loans from banks, and repay the loans with interest.
Banks offer a range of accounts to serve different needs. A checking accounttypically pays little or no interest,
but it facilitates transactions by giving you easy access to your money, either by writing a check or by using a
debit card(that is, a card which works like a credit card, except that purchases are immediately deducted from
your checking account rather than billed separately through a credit card company). A savings account
typically pays some interest rate, but getting the money typically requires you to make a trip to the bank or an
automatic teller machine (or you can access the funds electronically). The lines between checking and savings
accounts have blurred in the last couple of decades, as many banks offer checking accounts that will pay an
interest rate similar to a savings account if you keep a certain minimum amount in the account, or conversely,
offer savings accounts that allow you to write at least a few checks per month.
Another way to deposit savings at a bank is to use a certificate of deposit (CD). With a CD, you agree to deposit
a certain amount of money, often measured in thousands of dollars, in the account for a stated period of time,
typically ranging from a few months to several years. In exchange, the bank agrees to pay a higher interest rate
than for a regular savings account. While you can withdraw the money before the allotted time, as the
advertisements for CDs always warn, there is “a substantial penalty for early withdrawal.”
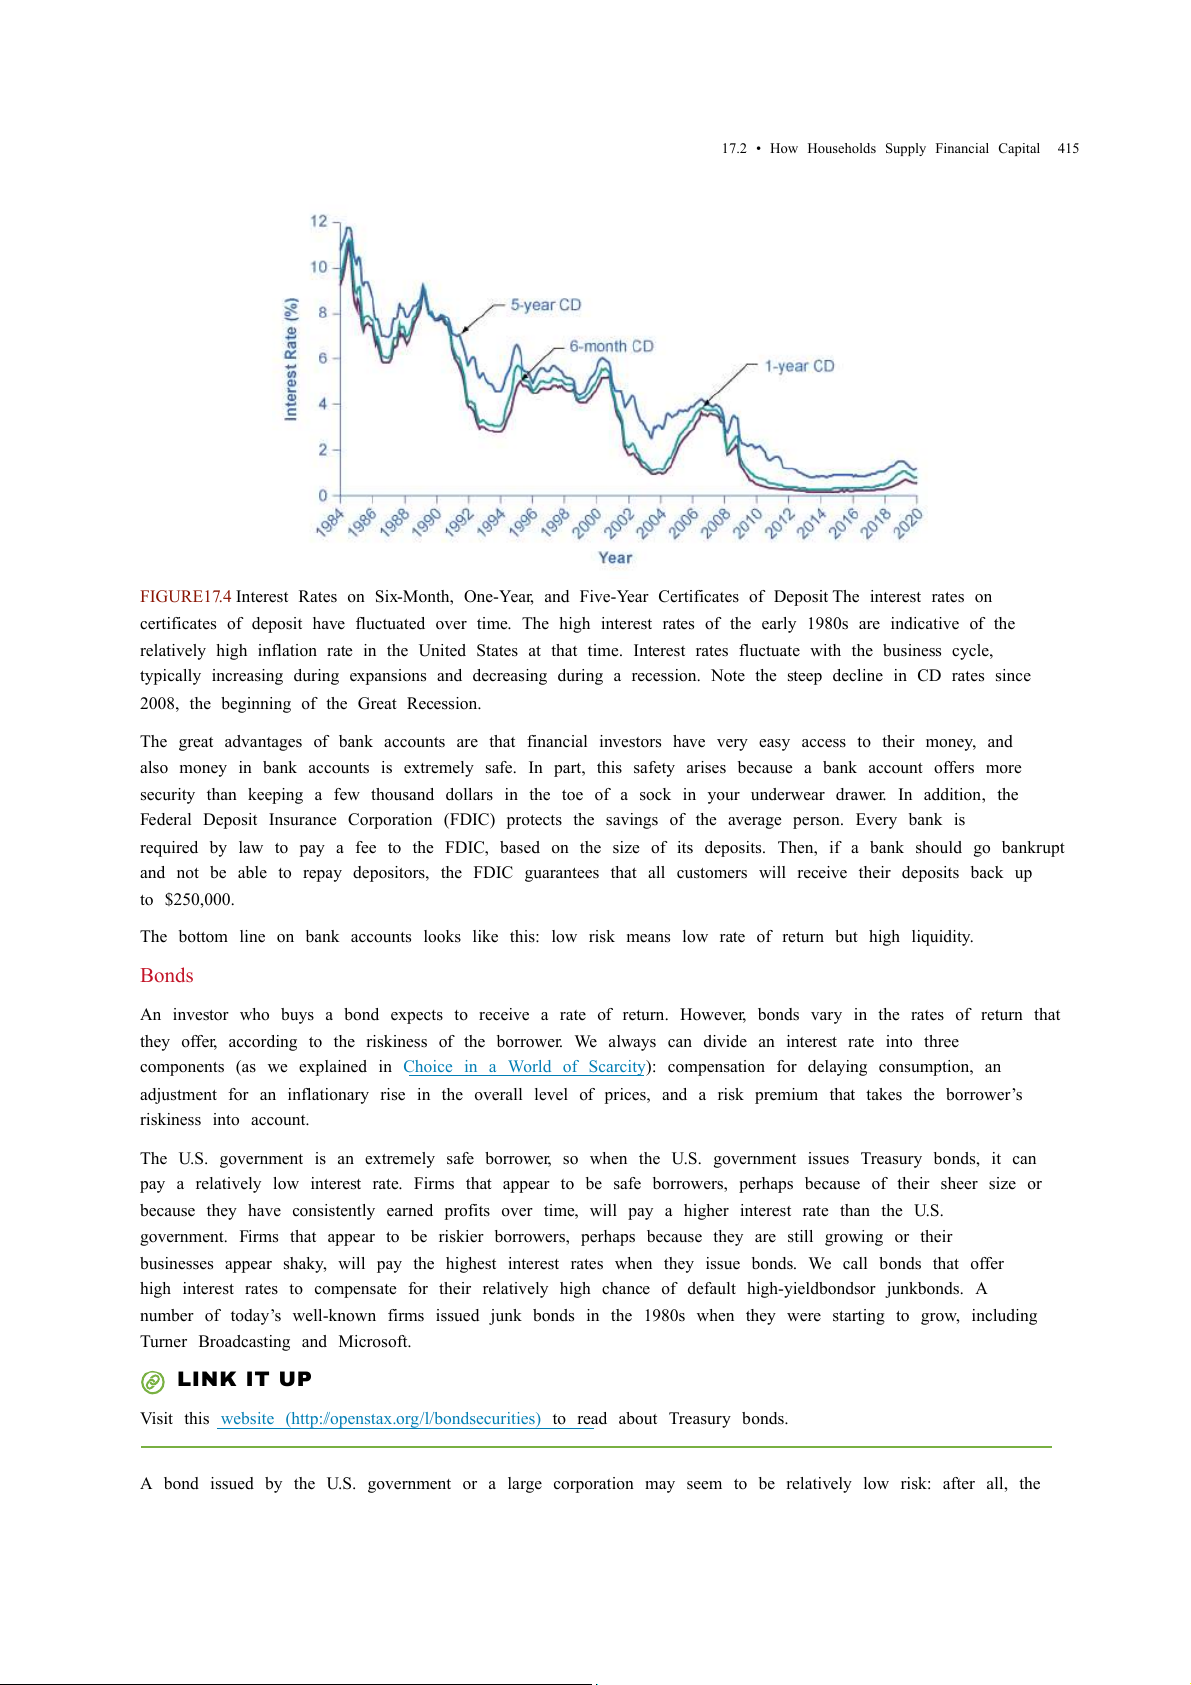
Figure 17.4 shows the annual rate of interest paid on a six-month, one-year, and five-year CD since 1984, as
reported by Bankrate.com. The interest rates that savings accounts pay are typically a little lower than the CD
rate, because financial investors need to receive a slightly higher rate of interest as compensation for
promising to leave deposits untouched for a period of time in a CD, and thus forfeiting some liquidity.
Access for free at openstax.org
17.2 • How Households Supply Financial Capital 415
FIGURE17.4 Interest Rates on Six-Month, One-Year, and Five-Year Certificates of Deposit The interest rates on
certificates of deposit have fluctuated over time. The high interest rates of the early 1980s are indicative of the
relatively high inflation rate in the United States at that time. Interest rates fluctuate with the business cycle,
typically increasing during expansions and decreasing during a recession. Note the steep decline in CD rates since
2008, the beginning of the Great Recession.
The great advantages of bank accounts are that financial investors have very easy access to their money, and
also money in bank accounts is extremely safe. In part, this safety arises because a bank account offers more
security than keeping a few thousand dollars in the toe of a sock in your underwear drawer. In addition, the
Federal Deposit Insurance Corporation (FDIC) protects the savings of the average person. Every bank is
required by law to pay a fee to the FDIC, based on the size of its deposits. Then, if a bank should go bankrupt
and not be able to repay depositors, the FDIC guarantees that all customers will receive their deposits back up to $250,000.
The bottom line on bank accounts looks like this: low risk means low rate of return but high liquidity. Bonds
An investor who buys a bond expects to receive a rate of return. However, bonds vary in the rates of return that
they offer, according to the riskiness of the borrower. We always can divide an interest rate into three
components (as we explained in Choice in a World of Scarcity): compensation for delaying consumption, an
adjustment for an inflationary rise in the overall level of prices, and a risk premium that takes the borrower’s riskiness into account.
The U.S. government is an extremely safe borrower, so when the U.S. government issues Treasury bonds, it can
pay a relatively low interest rate. Firms that appear to be safe borrowers, perhaps because of their sheer size or
because they have consistently earned profits over time, will pay a higher interest rate than the U.S.
government. Firms that appear to be riskier borrowers, perhaps because they are still growing or their
businesses appear shaky, will pay the highest interest rates when they issue bonds. We call bonds that offer
high interest rates to compensate for their relatively high chance of default high-yieldbondsor junk bonds. A
number of today’s well-known firms issued junk bonds in the 1980s when they were starting to grow, including
Turner Broadcasting and Microsoft. LINK IT UP
Visit this website (http://openstax.org/l/bondsecurities) to read about Treasury bonds.
A bond issued by the U.S. government or a large corporation may seem to be relatively low risk: after all, the 416
17 • Financial Markets
bond issuer has promised to make certain payments over time, and except for rare bankruptcy cases, these
payments will occur. If a corporate bond issuer fails to make the payments that it owes to its bondholders, the
bondholders can require that the company declare bankruptcy, sell off its assets, and pay them as much as it
can. Even in the case of junk bonds, a wise investor can reduce the risk by purchasing bonds from a wide range
of different companies since, even if a few firms go broke and do not pay, they are not all likely to go bankrupt.
As we noted before, bonds carry an interest rate risk. For example, imagine you decide to buy a 10-year bond
for $1,000 that would pay an annual interest rate of 8%. Soon after you buy the bond, interest rates on bonds
rise, so that now similar companies are paying an annual rate of 12%. Anyone who buys a $1,000 bond now
can receive annual payments of $120 per year, but since your bond was issued at an interest rate of 8%, you
have tied up $1,000 and receive payments of only $80 per year. In the meaningful sense of opportunity cost,
you are missing out on the higher payments that you could have received. Furthermore, you can calculate the
amount you should be willing to pay now for future payments. To place a present discounted value on a future
payment, decide what you would need in the present to equal a certain amount in the future. This calculation
will require an interest rate. For example, if the interest rate is 25%, then a payment of $125 a year from now
will have a present discounted value of $100—that is, you could take $100 in the present and have $125 in the
future. (We discuss this further in the appendix on Present Discounted Value.)
In financial terms, a bond has several parts. A bond is basically an “I owe you” note that an investor receives in
exchange for capital (money). The bond has a face value. This is the amount the borrower agrees to pay the
investor at maturity. The bond has a coupon rateor interest rate, which is usually semi-annual, but can be
paid at different times throughout the year. (Bonds used to be paper documents with coupons that investors
clipped and turned in to the bank to receive interest.) The bond has a maturity datewhen the borrower will
pay back its face value as well as its last interest payment. Combining the bond’s face value, interest rate, and
maturity date, and market interest rates, allows a buyer to compute a bond’s present value, which is the most
that a buyer would be willing to pay for a given bond. This may or may not be the same as the face value.
The bond yieldmeasures the rate of return a bond is expected to pay over time. Investors can buy bonds when
they are issued and they can buy and sell them during their lifetimes. When buying a bond that has been
around for a few years, investors should know that the interest rate printed on a bond is often not the same as
the bond yield, even on new bonds. Read the next Work It Out feature to see how this happens. WORK IT OUT Calculating the Bond Yield
You have bought a $1,000 bond whose coupon rate is 8%. To calculate your return or yield, follow these steps: 1. Assume the following: Face value of a bond: $1,000 Coupon rate: 8 % Annual payment: $80 per year
2. Consider the risk of the bond. If this bond carries no risk, then it would be safe to assume that the bond will
sell for $1,000 when it is issued and pay the purchaser $80 per year until its maturity, at which time the final
interest payment will be made and the original $1,000 will be repaid. Now, assume that over time the
interest rates prevailing in the economy rise to 12% and that there is now only one year left to this bond’s
maturity. This makes the bond an unattractive investment, since an investor can find another bond that
perhaps pays 12%. To induce the investor to buy the 8% bond, the bond seller will lower its price below its face value of $1,000.
3. Calculate the bond's price when its interest rate is less than the market interest rate. The expected
payments from the bond one year from now are $1,080, because in the bond’s last year the bond's issuer
will make the final interest payment and then also repay the original $1,000. Given that interest rates are
Access for free at openstax.org
17.2 • How Households Supply Financial Capital 417
now 12%, you know that you could invest $964 in an alternative investment and receive $1,080 a year from
now; that is, $964(1 + 0.12) = $1080. Therefore, you will not pay more than $964 for the original $1,000 bond.
4. Consider that the investor will receive the $1,000 face value, plus $80 for the last year’s interest payment.
The yield on the bond will be ($1080 – $964)/$964 = 12%. The yield, or total return, means interest
payments, plus capital gains. Note that the interest or coupon rate of 8% did not change. When interest rates
rise, bonds previously issued at lower interest rates will sell for less than face value. Conversely, when
interest rates fall, bonds previously issued at higher interest rates will sell for more than face value.
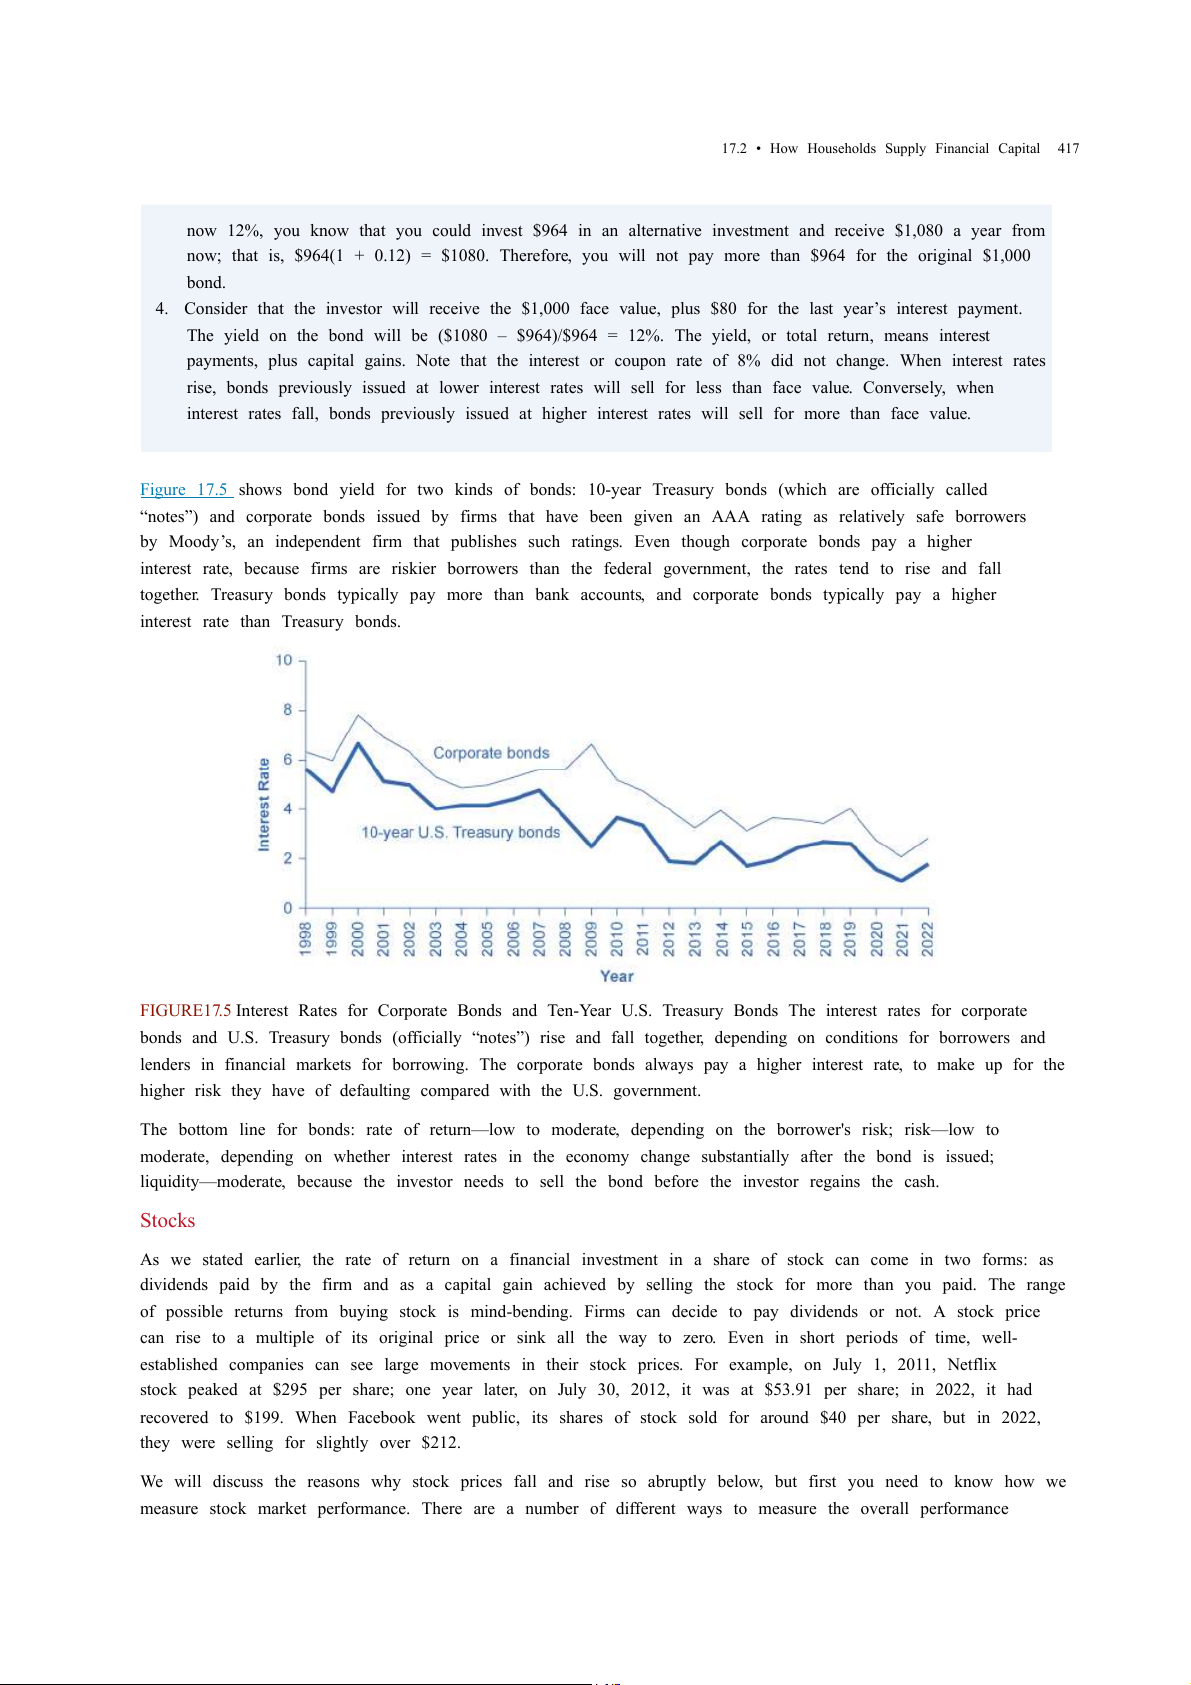
Figure 17.5 shows bond yield for two kinds of bonds: 10-year Treasury bonds (which are officially called
“notes”) and corporate bonds issued by firms that have been given an AAA rating as relatively safe borrowers
by Moody’s, an independent firm that publishes such ratings. Even though corporate bonds pay a higher
interest rate, because firms are riskier borrowers than the federal government, the rates tend to rise and fall
together. Treasury bonds typically pay more than bank accounts, and corporate bonds typically pay a higher
interest rate than Treasury bonds.
FIGURE17.5 Interest Rates for Corporate Bonds and Ten-Year U.S. Treasury Bonds The interest rates for corporate
bonds and U.S. Treasury bonds (officially “notes”) rise and fall together, depending on conditions for borrowers and
lenders in financial markets for borrowing. The corporate bonds always pay a higher interest rate, to make up for the
higher risk they have of defaulting compared with the U.S. government.
The bottom line for bonds: rate of return—low to moderate, depending on the borrower's risk; risk—low to
moderate, depending on whether interest rates in the economy change substantially after the bond is issued;
liquidity—moderate, because the investor needs to sell the bond before the investor regains the cash. Stocks
As we stated earlier, the rate of return on a financial investment in a share of stock can come in two forms: as
dividends paid by the firm and as a capital gain achieved by selling the stock for more than you paid. The range
of possible returns from buying stock is mind-bending. Firms can decide to pay dividends or not. A stock price
can rise to a multiple of its original price or sink all the way to zero. Even in short periods of time, well-
established companies can see large movements in their stock prices. For example, on July 1, 2011, Netflix
stock peaked at $295 per share; one year later, on July 30, 2012, it was at $53.91 per share; in 2022, it had
recovered to $199. When Facebook went public, its shares of stock sold for around $40 per share, but in 2022,
they were selling for slightly over $212.
We will discuss the reasons why stock prices fall and rise so abruptly below, but first you need to know how we
measure stock market performance. There are a number of different ways to measure the overall performance 418
17 • Financial Markets
of the stock market, based on averaging different subsets of companies' stock prices. Perhaps the best-known
stock market measure is the Dow Jones Industrial Average, which is based on 30 large U.S. companies' stock
prices. Another stock market performance gauge, the Standard & Poor’s 500, follows the stock prices of the 500
largest U.S. companies. The Wilshire 5000 tracks the stock prices of essentially all U.S. companies that have
stock the public can buy and sell.
Other stock market measures focus on where stocks are traded. For example, the New York Stock Exchange
monitors the performance of stocks that are traded on that exchange in New York City. The Nasdaq stock
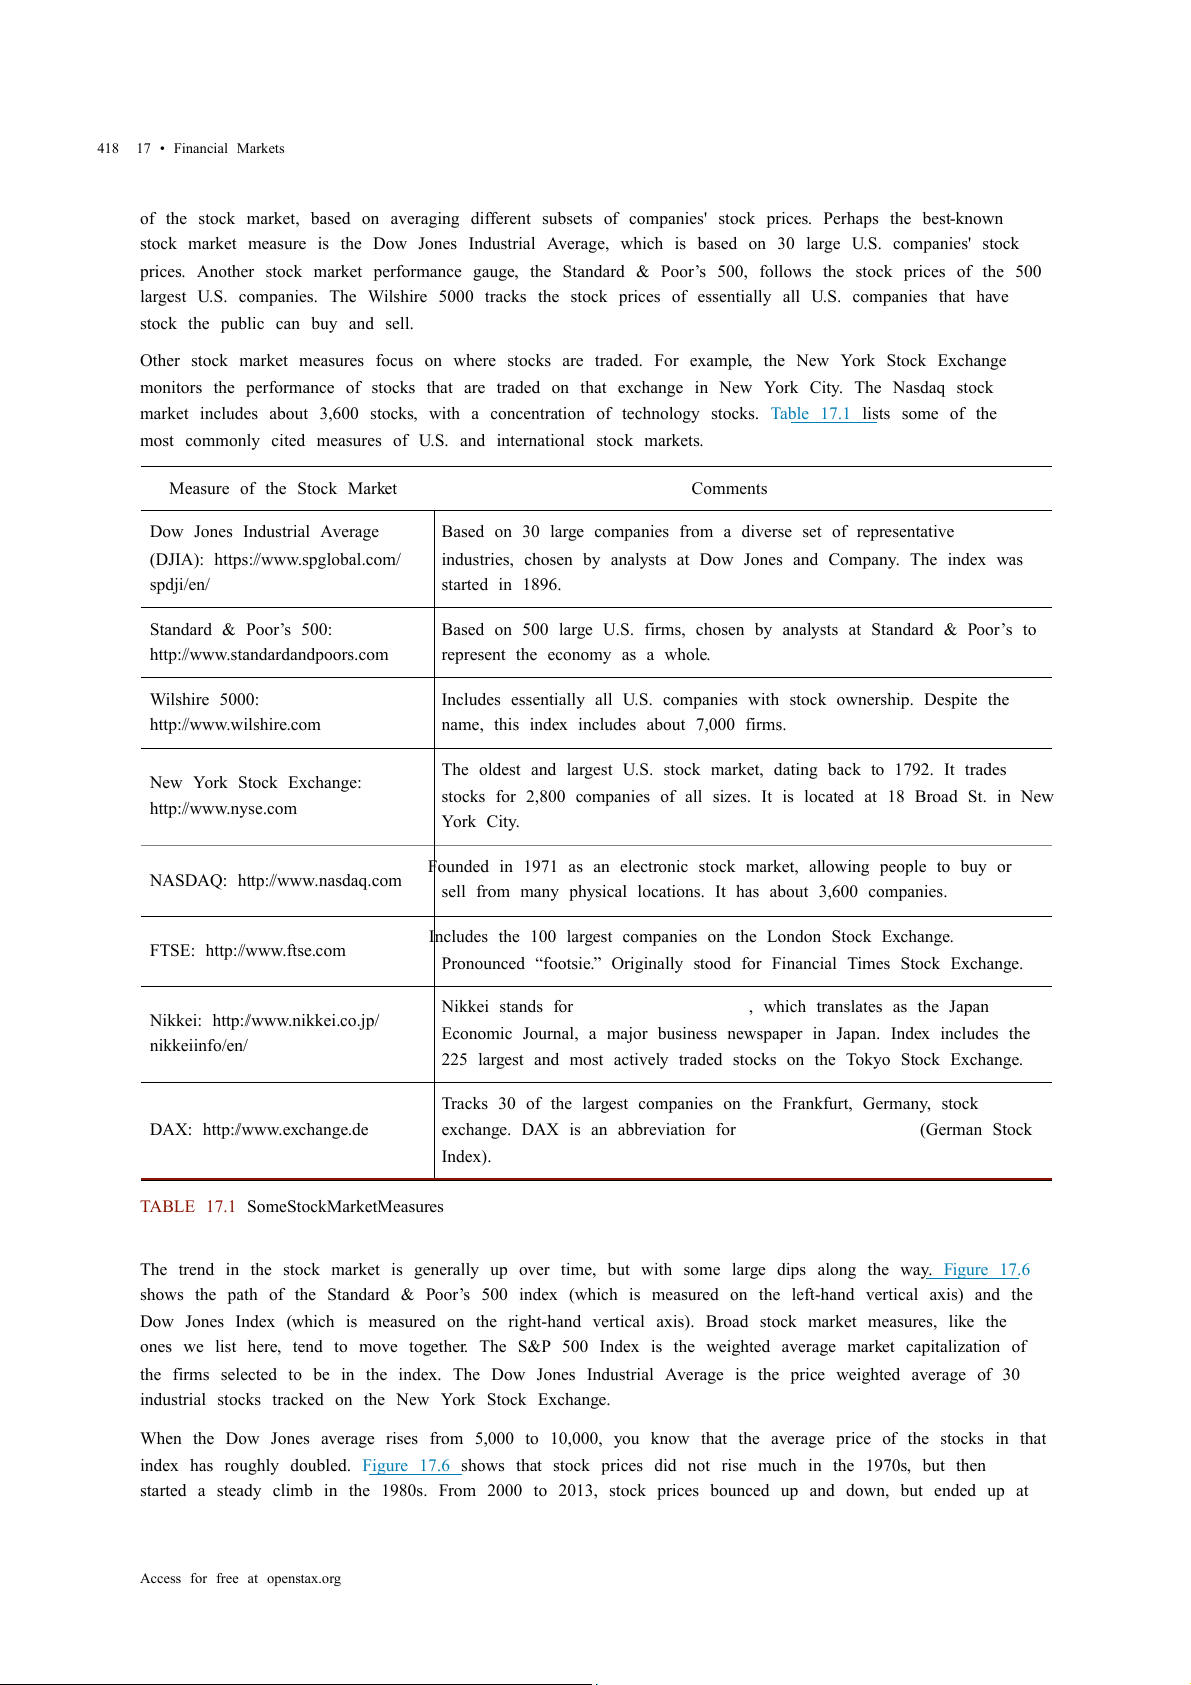
market includes about 3,600 stocks, with a concentration of technology stocks. Table 17.1 lists some of the
most commonly cited measures of U.S. and international stock markets.
Measure of the Stock Market Comments Dow Jones Industrial Average
Based on 30 large companies from a diverse set of representative
(DJIA): https://www.spglobal.com/
industries, chosen by analysts at Dow Jones and Company. The index was spdji/en/ started in 1896. Standard & Poor’s 500:
Based on 500 large U.S. firms, chosen by analysts at Standard & Poor’s to
http://www.standardandpoors.com
represent the economy as a whole. Wilshire 5000:
Includes essentially all U.S. companies with stock ownership. Despite the http://www.wilshire.com
name, this index includes about 7,000 firms.
The oldest and largest U.S. stock market, dating back to 1792. It trades New York Stock Exchange:
stocks for 2,800 companies of all sizes. It is located at 18 Broad St. in New http://www.nyse.com York City.
Founded in 1971 as an electronic stock market, allowing people to buy or NASDAQ: http://www.nasdaq.com
sell from many physical locations. It has about 3,600 companies.
Includes the 100 largest companies on the London Stock Exchange. FTSE: http://www.ftse.com
Pronounced “footsie.” Originally stood for Financial Times Stock Exchange.
Nikkei stands for Nihon Keizai Shimbun, which translates as the Japan
Nikkei: http://www.nikkei.co.jp/
Economic Journal, a major business newspaper in Japan. Index includes the nikkeiinfo/en/
225 largest and most actively traded stocks on the Tokyo Stock Exchange.
Tracks 30 of the largest companies on the Frankfurt, Germany, stock DAX: http://www.exchange.de
exchange. DAX is an abbreviation forDeutscher Aktien Index (German Stock Index).
TABLE 17.1 Some Stock Market Measures
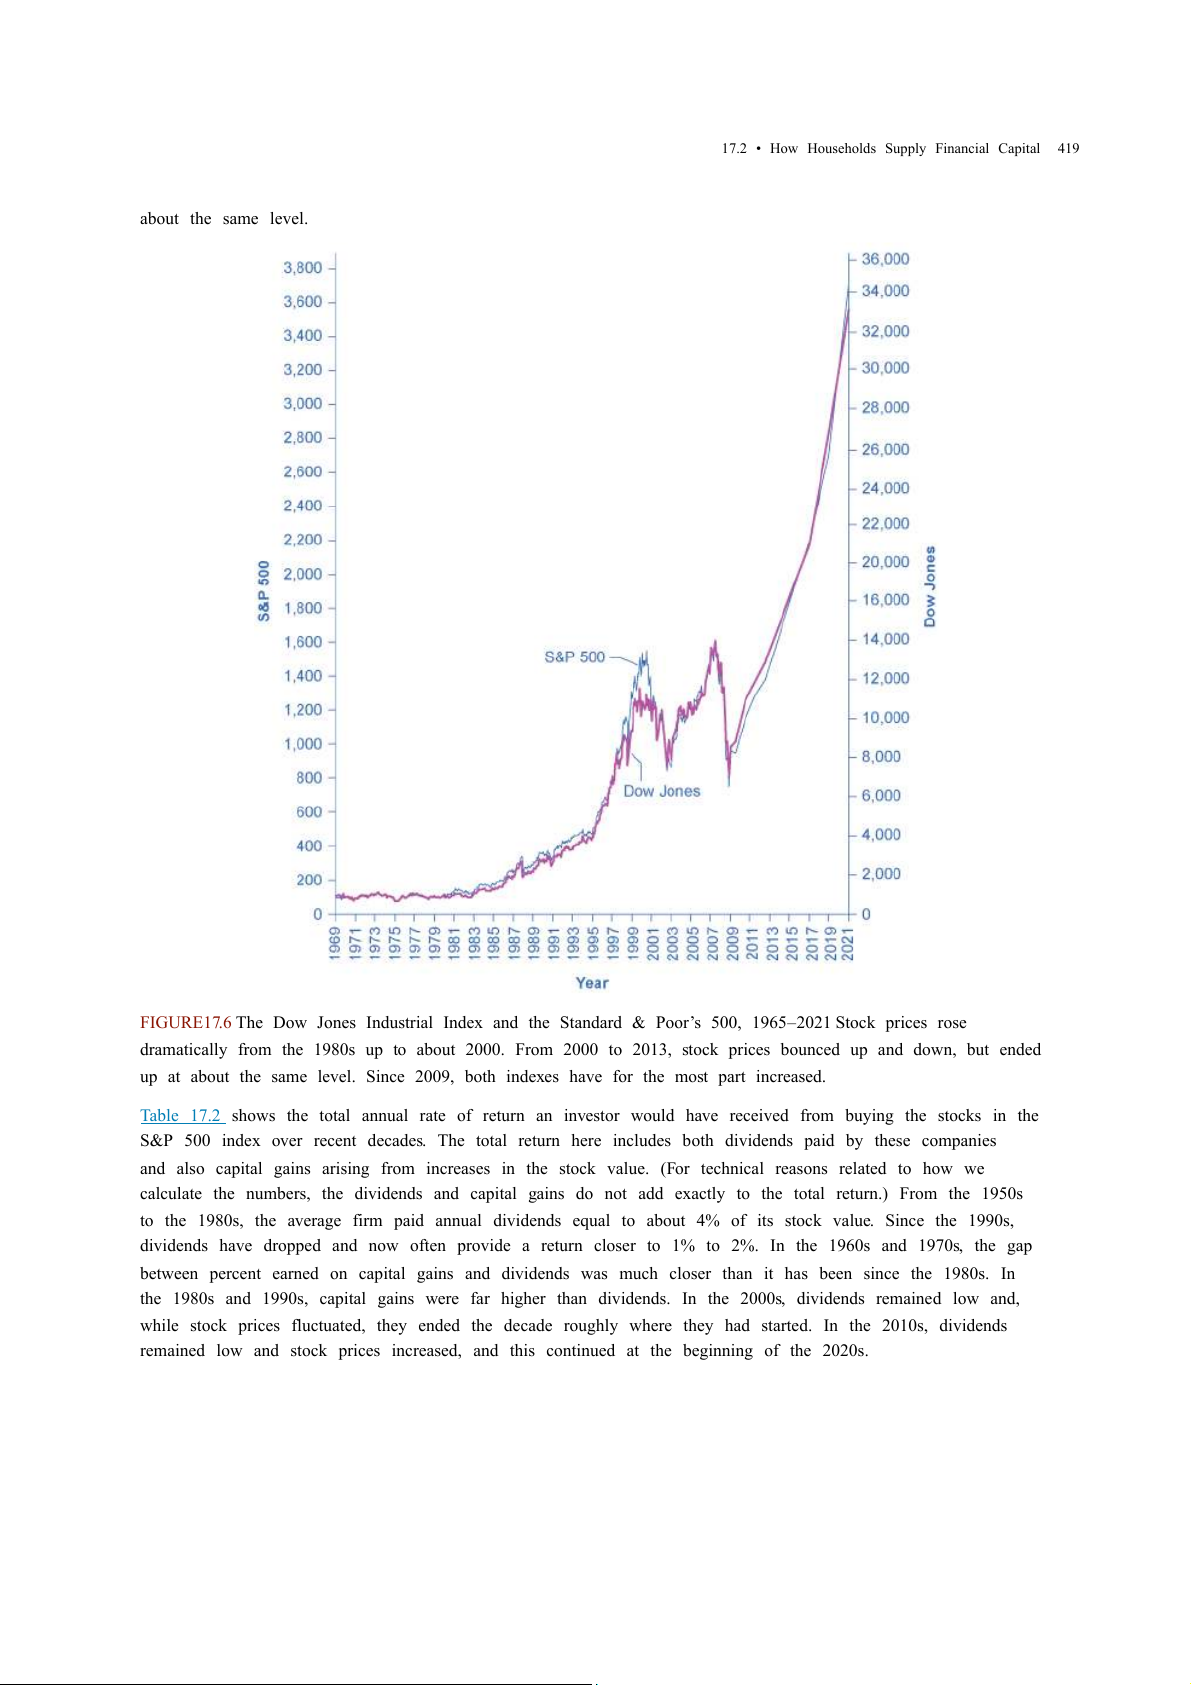
The trend in the stock market is generally up over time, but with some large dips along the way. Figure 17.6
shows the path of the Standard & Poor’s 500 index (which is measured on the left-hand vertical axis) and the
Dow Jones Index (which is measured on the right-hand vertical axis). Broad stock market measures, like the
ones we list here, tend to move together. The S&P 500 Index is the weighted average market capitalization of
the firms selected to be in the index. The Dow Jones Industrial Average is the price weighted average of 30
industrial stocks tracked on the New York Stock Exchange.
When the Dow Jones average rises from 5,000 to 10,000, you know that the average price of the stocks in that
index has roughly doubled. Figure 17.6 shows that stock prices did not rise much in the 1970s, but then
started a steady climb in the 1980s. From 2000 to 2013, stock prices bounced up and down, but ended up at
Access for free at openstax.org
17.2 • How Households Supply Financial Capital 419 about the same level.
FIGURE17.6 The Dow Jones Industrial Index and the Standard & Poor’s 500, 1965–2021 Stock prices rose
dramatically from the 1980s up to about 2000. From 2000 to 2013, stock prices bounced up and down, but ended
up at about the same level. Since 2009, both indexes have for the most part increased.
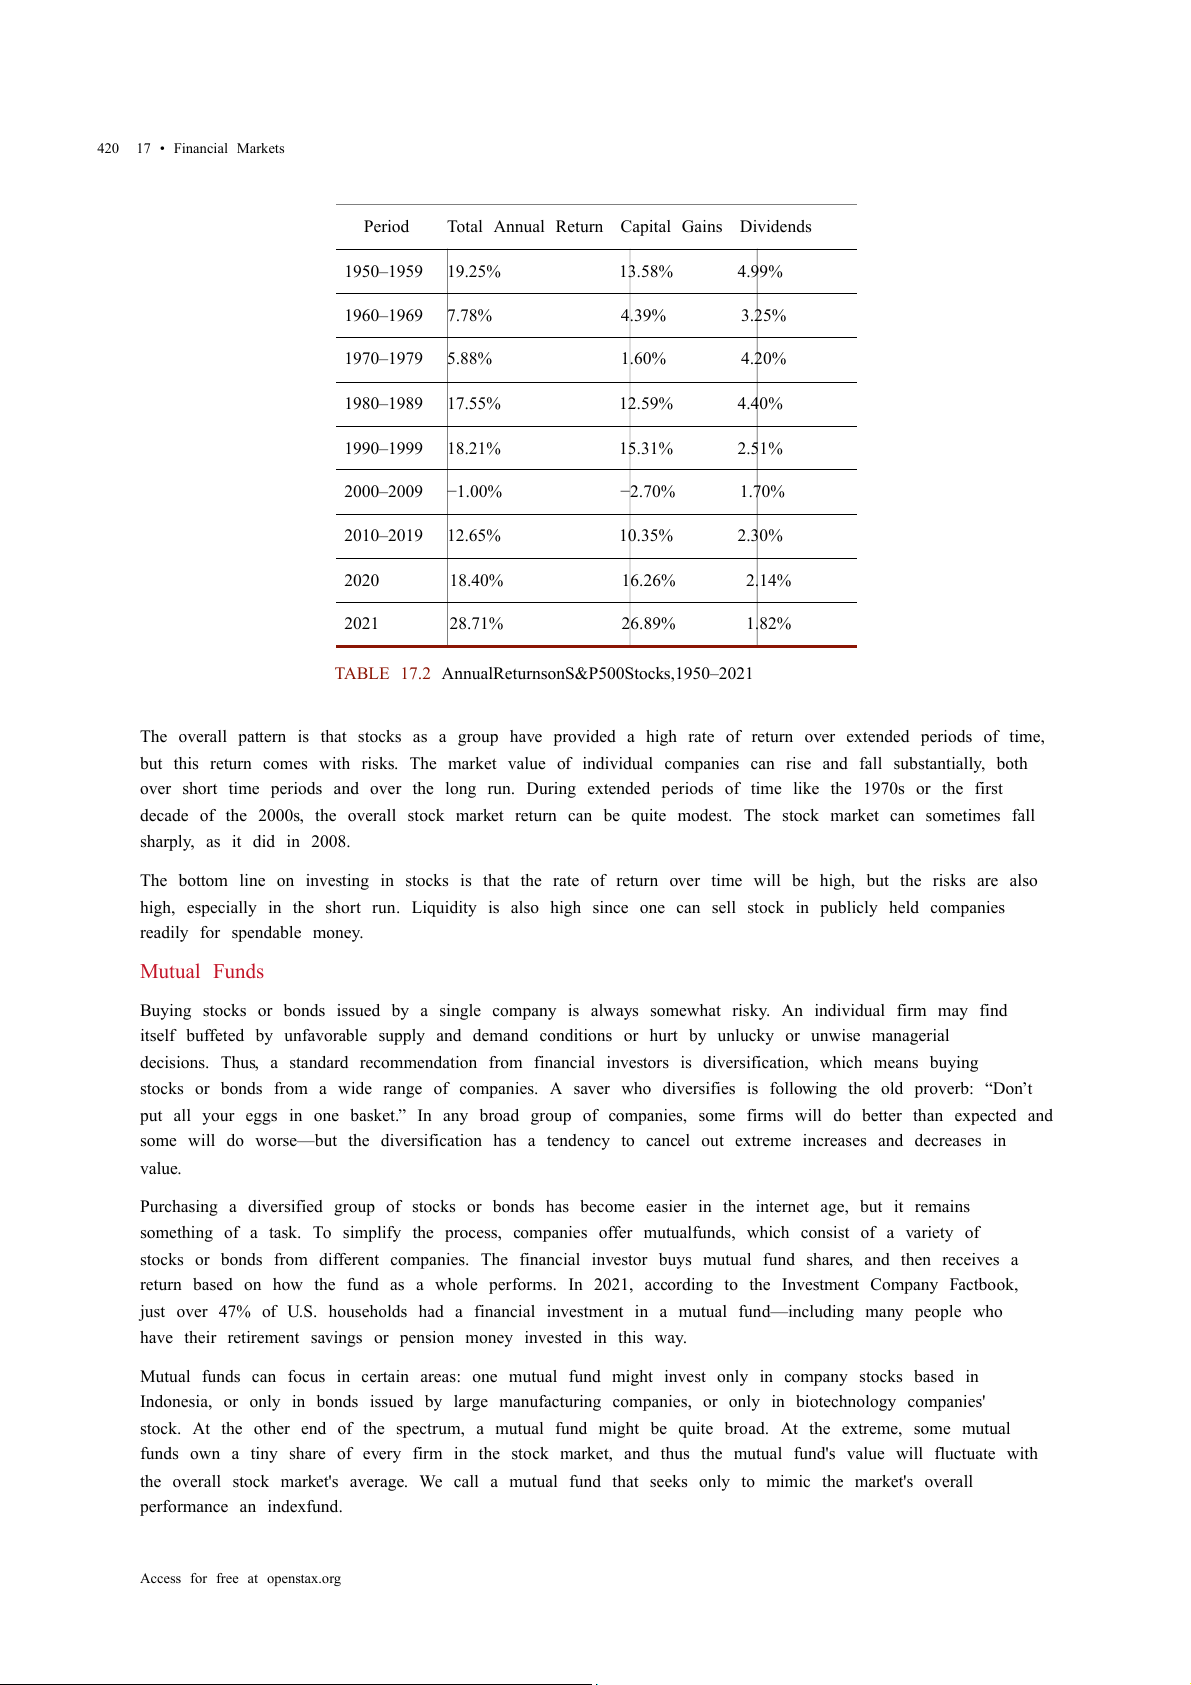
Table 17.2 shows the total annual rate of return an investor would have received from buying the stocks in the
S&P 500 index over recent decades. The total return here includes both dividends paid by these companies
and also capital gains arising from increases in the stock value. (For technical reasons related to how we
calculate the numbers, the dividends and capital gains do not add exactly to the total return.) From the 1950s
to the 1980s, the average firm paid annual dividends equal to about 4% of its stock value. Since the 1990s,
dividends have dropped and now often provide a return closer to 1% to 2%. In the 1960s and 1970s, the gap
between percent earned on capital gains and dividends was much closer than it has been since the 1980s. In
the 1980s and 1990s, capital gains were far higher than dividends. In the 2000s, dividends remained low and,
while stock prices fluctuated, they ended the decade roughly where they had started. In the 2010s, dividends
remained low and stock prices increased, and this continued at the beginning of the 2020s. 420
17 • Financial Markets Period
Total Annual Return Capital Gains Dividends 1950–1959 19.25% 13.58% 4.99% 1960–1969 7.78% 4.39% 3.25% 1970–1979 5.88% 1.60% 4.20% 1980–1989 17.55% 12.59% 4.40% 1990–1999 18.21% 15.31% 2.51% 2000–2009 −1.00% −2.70% 1.70% 2010–2019 12.65% 10.35% 2.30% 2020 18.40% 16.26% 2.14% 2021 28.71% 26.89% 1.82%
TABLE 17.2 Annual Returns on S&P 500 Stocks, 1950–2021
The overall pattern is that stocks as a group have provided a high rate of return over extended periods of time,
but this return comes with risks. The market value of individual companies can rise and fall substantially, both
over short time periods and over the long run. During extended periods of time like the 1970s or the first
decade of the 2000s, the overall stock market return can be quite modest. The stock market can sometimes fall sharply, as it did in 2008.
The bottom line on investing in stocks is that the rate of return over time will be high, but the risks are also
high, especially in the short run. Liquidity is also high since one can sell stock in publicly held companies readily for spendable money. Mutual Funds
Buying stocks or bonds issued by a single company is always somewhat risky. An individual firm may find
itself buffeted by unfavorable supply and demand conditions or hurt by unlucky or unwise managerial
decisions. Thus, a standard recommendation from financial investors is diversification, which means buying
stocks or bonds from a wide range of companies. A saver who diversifies is following the old proverb: “Don’t
put all your eggs in one basket.” In any broad group of companies, some firms will do better than expected and
some will do worse—but the diversification has a tendency to cancel out extreme increases and decreases in value.
Purchasing a diversified group of stocks or bonds has become easier in the internet age, but it remains
something of a task. To simplify the process, companies offer mutual funds, which consist of a variety of
stocks or bonds from different companies. The financial investor buys mutual fund shares, and then receives a
return based on how the fund as a whole performs. In 2021, according to the Investment Company Factbook,
just over 47% of U.S. households had a financial investment in a mutual fund—including many people who
have their retirement savings or pension money invested in this way.
Mutual funds can focus in certain areas: one mutual fund might invest only in company stocks based in
Indonesia, or only in bonds issued by large manufacturing companies, or only in biotechnology companies'
stock. At the other end of the spectrum, a mutual fund might be quite broad. At the extreme, some mutual
funds own a tiny share of every firm in the stock market, and thus the mutual fund's value will fluctuate with
the overall stock market's average. We call a mutual fund that seeks only to mimic the market's overall
performance an index fund.
Access for free at openstax.org
17.2 • How Households Supply Financial Capital 421
Diversification can offset some of the risks of individual stocks rising or falling. Even investors who buy an
indexed mutual fund designed to mimic some measure of the broad stock market, like the Standard & Poor’s
500, had better prepare against some ups and downs, like those the stock market experienced in the first
decade of the 2000s. In 2008 average U.S. stock funds declined 38%, reducing individual and household
wealth. This steep drop in value hit hardest those who were close to retirement and were counting on their
stock funds to supplement retirement income.
The bottom line on investing in mutual funds is that the rate of return over time will be high. The risks are also
high, but the risks and returns for an individual mutual fund will be lower than those for an individual stock.
As with stocks, liquidity is also high provided the mutual fund or stock index fund is readily traded.
Housing and Other Tangible Assets
Households can also seek a rate of return by purchasing tangible assets, especially housing. About two-thirds
of U.S. households own their own home. An owner’s equityin a house is the monetary value the owner would
have after selling the house and repaying any outstanding bank loans they used to buy the house. For example,
imagine that you buy a house for $200,000, paying 10% of the price as a down payment and taking out a bank
loan for the remaining $180,000. Over time, you pay off some of your bank loan, so that only $100,000
remains, and the house's value on the market rises to $250,000. At that point, your equity in the home is the
value of the home minus the value of the loan outstanding, which is $150,000. For many middle-class
Americans, home equity is their single greatest financial asset. The total value of all home equity held by U.S.
households was $23.6 trillion as of the middle of 2021, according to Federal Reserve data.
Investment in a house is tangibly different from bank accounts, stocks, and bonds because a house offers both
a financial and a nonfinancial return. If you buy a house to live in, part of the return on your investment occurs
from your consumption of “housing services”—that is, having a place to live. (Of course, if you buy a home and
rent it out, you receive rental payments for the housing services you provide, which would offer a financial
return.) Buying a house to live in also offers the possibility of a capital gain from selling the house in the future
for more than you paid for it. There can, however, be different outcomes, as the Clear It Up on the housing market shows.
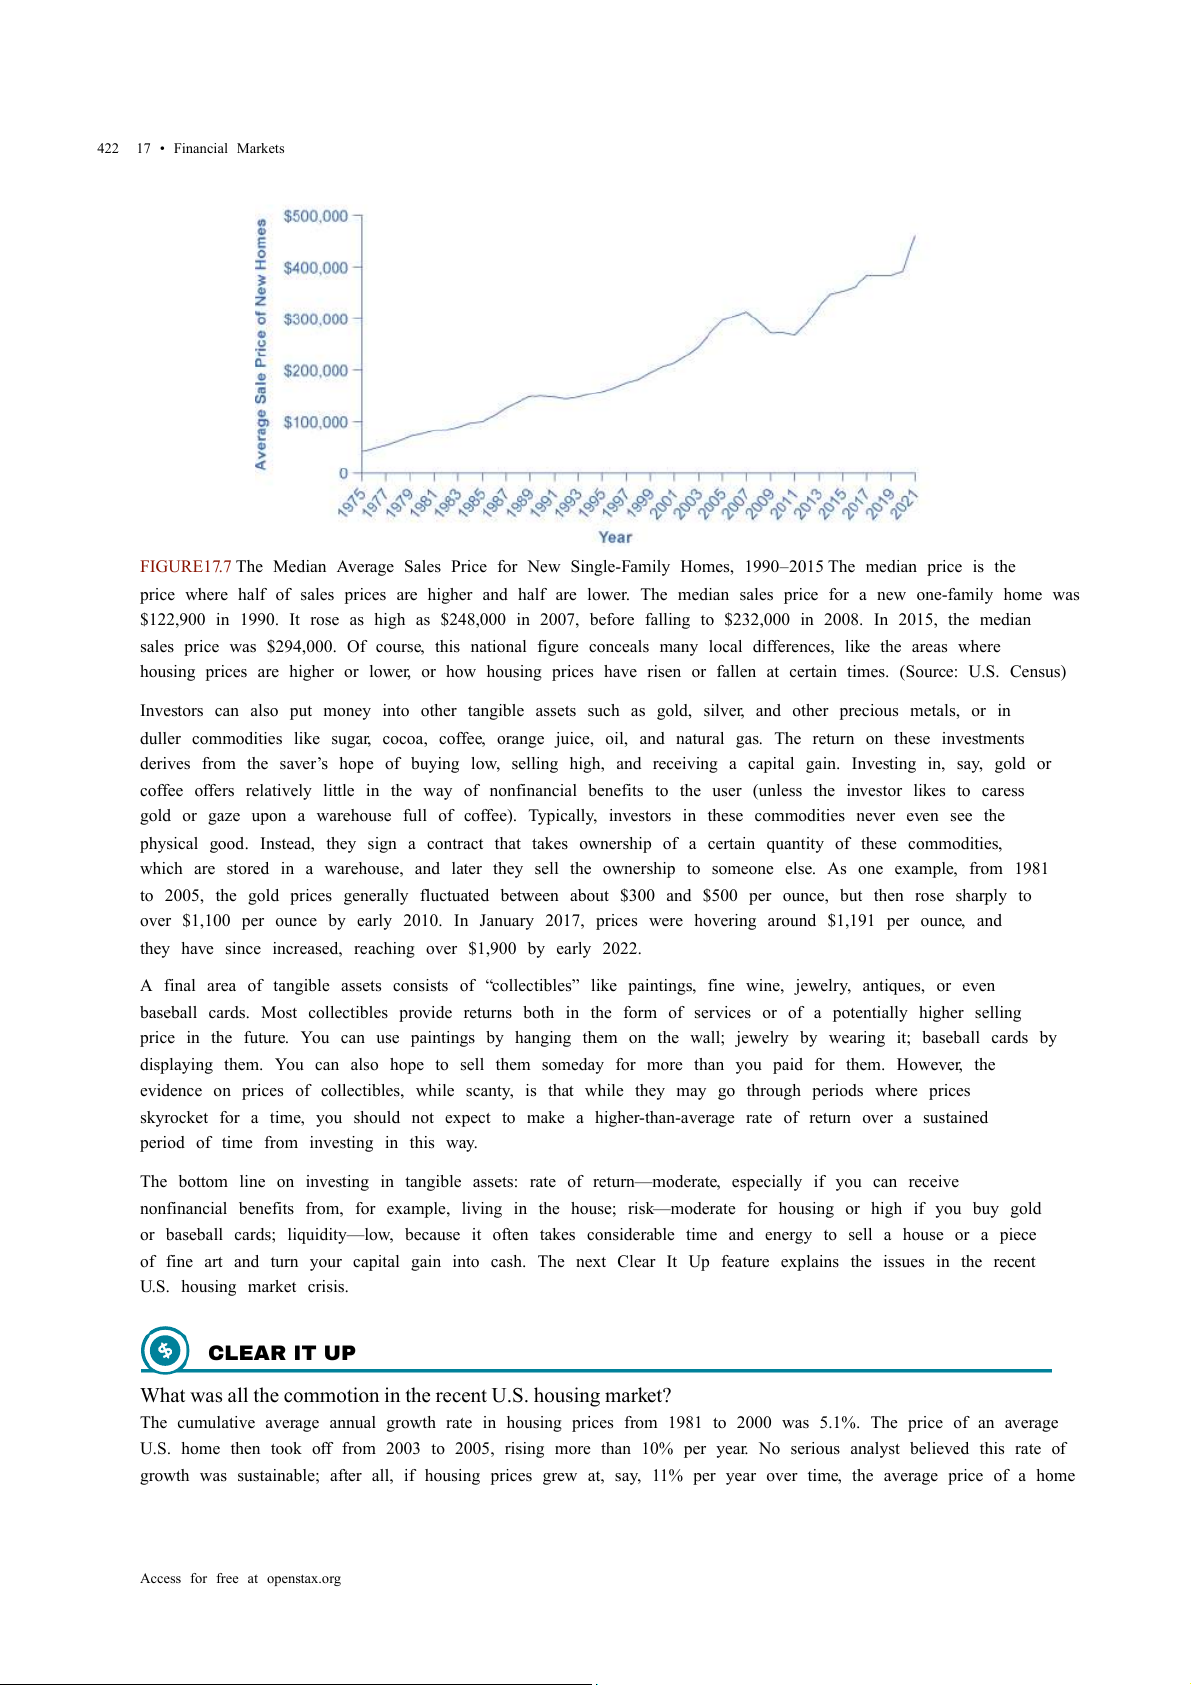
Housing prices have usually risen steadily over time. For example, the median sales price for an existing one-
family home was $122,900 in 1990, but 232,000 at the end of December 2016, according to FRED® Economic
Data. Over these 24 years, home prices increased an average of 3.1% per year, which is an average financial
return over this time. Figure 17.7 shows U.S. Census data for the average sales price of a new home in the
United States from 1965 to 2021. LINK IT UP
Go to this website (http://openstax.org/l/investopedia) to experiment with a compound annual growth rate calculator.
However, the possible capital gains from rising housing prices are riskier than these national price averages.
Certain regions of the country or metropolitan areas have seen drops in housing prices over time. The median
housing price for the United States as a whole fell almost 7% in 2008 and again in 2009, dropping the median
price from $247,900 to $216,700. As of 2016, home values had recovered and even exceeded their pre-
recession levels, and they have continued to increase into the early 2020s. LINK IT UP
Visit this website (http://openstax.org/l/insidejob) to watch the trailer for
Inside Job , a movie that explores the modern financial crisis. 422
17 • Financial Markets
FIGURE17.7 The Median Average Sales Price for New Single-Family Homes, 1990–2015 The median price is the
price where half of sales prices are higher and half are lower. The median sales price for a new one-family home was
$122,900 in 1990. It rose as high as $248,000 in 2007, before falling to $232,000 in 2008. In 2015, the median
sales price was $294,000. Of course, this national figure conceals many local differences, like the areas where
housing prices are higher or lower, or how housing prices have risen or fallen at certain times. (Source: U.S. Census)
Investors can also put money into other tangible assets such as gold, silver, and other precious metals, or in
duller commodities like sugar, cocoa, coffee, orange juice, oil, and natural gas. The return on these investments
derives from the saver’s hope of buying low, selling high, and receiving a capital gain. Investing in, say, gold or
coffee offers relatively little in the way of nonfinancial benefits to the user (unless the investor likes to caress
gold or gaze upon a warehouse full of coffee). Typically, investors in these commodities never even see the
physical good. Instead, they sign a contract that takes ownership of a certain quantity of these commodities,
which are stored in a warehouse, and later they sell the ownership to someone else. As one example, from 1981
to 2005, the gold prices generally fluctuated between about $300 and $500 per ounce, but then rose sharply to
over $1,100 per ounce by early 2010. In January 2017, prices were hovering around $1,191 per ounce, and
they have since increased, reaching over $1,900 by early 2022.
A final area of tangible assets consists of “collectibles” like paintings, fine wine, jewelry, antiques, or even
baseball cards. Most collectibles provide returns both in the form of services or of a potentially higher selling
price in the future. You can use paintings by hanging them on the wall; jewelry by wearing it; baseball cards by
displaying them. You can also hope to sell them someday for more than you paid for them. However, the
evidence on prices of collectibles, while scanty, is that while they may go through periods where prices
skyrocket for a time, you should not expect to make a higher-than-average rate of return over a sustained
period of time from investing in this way.
The bottom line on investing in tangible assets: rate of return—moderate, especially if you can receive
nonfinancial benefits from, for example, living in the house; risk—moderate for housing or high if you buy gold
or baseball cards; liquidity—low, because it often takes considerable time and energy to sell a house or a piece
of fine art and turn your capital gain into cash. The next Clear It Up feature explains the issues in the recent U.S. housing market crisis. CLEAR IT UP
What was all the commotion in the recent U.S. housing market?
The cumulative average annual growth rate in housing prices from 1981 to 2000 was 5.1%. The price of an average
U.S. home then took off from 2003 to 2005, rising more than 10% per year. No serious analyst believed this rate of
growth was sustainable; after all, if housing prices grew at, say, 11% per year over time, the average price of a home
Access for free at openstax.org
17.2 • How Households Supply Financial Capital 423
would more than double every seven years. However, at the time many serious analysts saw no reason for deep
concern. After all, housing prices often change in fits and starts, like all prices, and a price surge for a few years is
often followed by prices that are flat or even declining a bit as local markets adjust.
The sharp rise in housing prices was driven by a high level of demand for housing. Interest rates were low, so
financial institutions encouraged people to borrow money to buy a house. Banks became much more flexible in their
lending, making what were called “subprime” loans. Banks loaned money with low, or sometimes no down
payment. They offered loans with very low payments for the first two years, but then much higher payments after
that. The idea was that housing prices would keep rising, so the borrower would just refinance the mortgage two
years in the future, and thus would not ever have to make the higher payments. Some banks even offered so-called
NINJA loans, which meant a financial institution issued a loan even though the borrower had no income, no job, nor assets.
In retrospect, these loans seem outlandish. Many borrowers figured, however, that as long as housing prices kept
rising, it made sense to buy. Many lenders used a process called “securitizing,” in which they sold their mortgages to
financial companies, which put all the mortgages into a big pool, creating large financial securities, and then re-sold
these mortgage-backed securities to investors. In this way, the lenders off-loaded the mortgage risks to investors.
Investors were interested in mortgage-backed securities as they appeared to offer a steady stream of income,
provided the borrowers repaid them. Investors relied on the ratings agencies to assess the credit risk associated
with the mortgage-backed securities. In hindsight, it appears that the credit agencies were far too lenient in their
ratings of many of the securitized loans. Bank and financial regulators watched the steady rise in the market for
mortgage-backed securities, but saw no reason at the time to intervene.
When housing prices turned down, many households that had borrowed when prices were high found that what they
owed the bank was more than what their home was worth. Many banks believed that they had diversified by selling
their individual loans and instead buying securities based on mortgage loans from all over the country. After all,
banks thought back in 2005, the average house price had not declined at any time since the Great Depression in the
1930s. These securities based on mortgage loans, however, turned out to be far riskier than expected. The bust in
housing prices weakened both bank and household finances, and thus helped bring on the 2008–2009 Great Recession.
The Tradeoffs between Return and Risk
The discussion of financial investments has emphasized the expected rate of return, the risk, and the liquidity
of each investment. Table 17.3 summarizes these characteristics. Financial Investment Return Risk Liquidity Checking account Very low Very little Very high Savings account Low Very little High Certificate of deposit Low to medium Very little Medium Stocks High Medium to high Medium Bonds Medium Low to medium Medium Mutual funds
Medium to high Medium to high Medium to high Housing Medium Medium Low
TABLE 17.3 Key Characteristics of Financial Investments 424
17 • Financial Markets Financial Investment Return Risk Liquidity Gold Medium High Low Collectibles Low to medium High Low
TABLE 17.3 Key Characteristics of Financial Investments
The household investment choices listed here display a tradeoff between the expected return and the degree of
risk involved. Bank accounts have very low risk and very low returns; bonds have higher risk but higher
returns; and stocks are riskiest of all but have the potential for still higher returns. In effect, the higher average
return compensates for the higher degree of risk. If risky assets like stocks did not also offer a higher average
return, then few investors would want them.
This tradeoff between return and risk complicates the task of any financial investor: Is it better to invest safely
or to take a risk and go for the high return? Ultimately, choices about risk and return will be based on personal
preferences. However, it is often useful to examine risk and return in the context of different time frames.
The high returns of stock market investments refer to a high average return that we can expect over a period of
several years or decades. The high risk of such investments refers to the fact that in shorter time frames, from
months to a few years, the rate of return may fluctuate a great deal. Thus, a person near retirement age, who
already owns a house, may prefer reduced risk and certainty about retirement income. For young workers, just
starting to make a reasonably profitable living, it may make sense to put most of their savings for retirement in
mutual funds. Mutual funds are able to take advantage of their buying and selling size and thereby reduce
transaction costs for investors. Stocks are risky in the short term, to be sure, but when the worker can look
forward to several decades during which stock market ups and downs can even out, stocks will typically pay a
much higher return over that extended period than will bonds or bank accounts. Thus, one must consider
tradeoffs between risk and return in the context of where the investor is in life.
17.3 How to Accumulate Personal Wealth LEARNING OBJECTIVES
By the end of this section, you will be able to:
• Explain the random walk theory
• Calculate simple and compound interest
• Evaluate how capital markets transform financial capital
Getting rich may seem straightforward enough. Figure out what companies are going to grow and earn high
profits in the future, or figure out what companies are going to become popular for everyone else to buy. Those
companies are the ones that will pay high dividends or whose stock price will climb in the future. Then, buy
stock in those companies. Presto! Multiply your money!
Why is this path to riches not as easy as it sounds? This module first discusses the problems with picking
stocks, and then discusses a more reliable but undeniably duller method of accumulating personal wealth.
Why It Is Hard to Get Rich Quick: The Random Walk Theory
The chief problem with attempting to buy stock in companies that will have higher prices in the future is that
many other financial investors are trying to do the same thing. Thus, in attempting to get rich in the stock
market, it is no help to identify a company that is going to earn high profits if many other investors have
already reached the same conclusion, because the stock price will already be high, based on the expected high level of future profits.
The idea that stock prices are based on expectations about the future has a powerful and unexpected
Access for free at openstax.org
17.3 • How to Accumulate Personal Wealth 425
implication. If expectations determine stock price, then shifts in expectations will determine shifts in the stock
price. Thus, what matters for predicting whether the stock price of a company will do well is not whether the
company will actually earn profits in the future. Instead, you must find a company that analysts widely believe
at present to have poor prospects, but that will actually turn out to be a shining star. Brigades of stock market
analysts and individual investors are carrying out such research 24 hours a day.
The fundamental problem with predicting future stock winners is that, by definition, no one can predict the
future news that alters expectations about profits. Because stock prices will shift in response to unpredictable
future news, these prices will tend to follow what mathematicians call a “random walk with a trend.” The
“random walk” part means that, on any given day, stock prices are just as likely to rise as to fall. “With a trend”
means that over time, the upward steps tend to be larger than the downward steps, so stocks do gradually climb.
If stocks follow a random walk, then not even financial professionals will be able to choose those that will beat
the average consistently. While some investment advisers are better than average in any given year, and some
even succeed for a number of years in a row, the majority of financial investors do not outguess the market. If
we look back over time, it is typically true that half or two-thirds of the mutual funds that attempted to pick
stocks which would rise more than the market average actually ended up performing worse than the market
average. For the average investor who reads the newspaper business pages over a cup of coffee in the morning,
the odds of doing better than full-time professionals is not very good at all. Trying to pick the stocks that will
gain a great deal in the future is a risky and unlikely way to become rich.
Getting Rich the Slow, Boring Way
Many U.S. citizens can accumulate a large amount of wealth during their lifetimes, if they make two key
choices. The first is to complete additional education and training. In 2020, the Bureau of Labor Statistics
reported median weekly usual earnings for full-time wage and salary workers age 25 and over that
corresponded to annual income of $40,612 for those with a high school diploma, $48,776 for those with a two-
year associate degree, and $67,860 for those with a four-year bachelor’s degree. Learning is not only good for
you, but it pays off financially, too.
The second key choice is to start saving money early in life, and to give the power of compound interest a
chance. Imagine that at age 25, you save $3,000 and place that money into an account that you do not touch. In
the long run, it is not unreasonable to assume a 7% real annual rate of return (that is, 7% above the rate of
inflation) on money invested in a well-diversified stock portfolio. After 40 years, using the formula for
compound interest, the original $3,000 investment will have multiplied nearly fifteen fold:
Having $45,000 does not make you a millionaire. Notice, however, that this tidy sum is the result of saving
$3,000 exactly once. Saving that amount every year for several decades—or saving more as income rises—will
multiply the total considerably. This type of wealth will not rival the riches of Microsoft CEO Bill Gates, but
remember that only half of Americans have any money in mutual funds at all. Accumulating hundreds of
thousands of dollars by retirement is a perfectly achievable goal for a well-educated person who starts saving
early in life—and that amount of accumulated wealth will put you at or near the top 10% of all American
households. The following Work It Out feature shows the difference between simple and compound interest,
and the power of compound interest. WORK IT OUT Simple and Compound Interest
Simple interest is an interest rate calculation only on the principal amount. 426
17 • Financial Markets
Step 1. Learn the formula for simple interest:
Step 2. Practice using the simple interest formula.
Example 1: $100 Deposit at a simple interest rate of 5% held for one year is:
Simple interest in this example is $5.
Example 2: $100 Deposit at a simple interest rate of 5% held for three years is:
Simple interest in this example is $15.
Step 3. Calculate the total future amount using this formula:
Step 4. Put the two simple interest formulas together.
Step 5. Apply the simple interest formula to our three year example.
Compound interest is an interest rate calculation on the principal plus the accumulated interest.
Step 6. To find the compound interest, we determine the difference between the future value and the present
value of the principal. This is accomplished as follows:
Step 7. Apply this formula to our three-year scenario. Follow the calculations in Table 17.4 Year 1 Amount in Bank $100 Bank Interest Rate 5% Total $105 $100 + ($100 × 0.05) Year 2 Amount in Bank $105 Bank Interest Rate 5% Total $110.25 TABLE 17.4
Access for free at openstax.org
Tài liệu liên quan:
-

Price Fluctuations of Masks and Oil in Vietnam | Microeconomics | Trường Đại học Quốc tế, Đại học Quốc gia Thành phố Hồ Chí Minh
2 1 -
Competitive Firm Analysis and Cost Calculations | Microeconomics | Trường Đại học Quốc tế, Đại học Quốc gia Thành phố Hồ Chí Minh
3 2 -

Assignment 9: Monopoly Profit Maximization & DWL Analysis | Microeconomics | Trường Đại học Quốc tế, Đại học Quốc gia Thành phố Hồ Chí Minh
4 2 -
Individual Tasks on Opportunity Costs Analysis | Microeconomics | Trường Đại học Quốc tế, Đại học Quốc gia Thành phố Hồ Chí Minh
4 2 -

Oligopoly and Game Theory Insights | Microeconomics | Trường Đại học Quốc tế, Đại học Quốc gia Thành phố Hồ Chí Minh
5 3