Financial Ratios Analysis for BBAE 101 Final Exam | Microeconomics | Trường Đại học Quốc tế, Đại học Quốc gia Thành phố Hồ Chí Minh
Calculate and present the following ratios for the year 2021: a) Total assets turnover( current asset of năm này)+(năm trước)) : 2 b) Average inventory turnover period c) Average settlement period for trade receivables d) Average settlement period for trade payables ( số ngày thanh toán nợ bình quân ) e) Net profit margin f) Gross profit margin g) ROA h) ROE i) Current ratio j) Quick ratio k) Debt-to-equity ratio l) Interest cover ration. Tài liệu được sưu tầm và soạn thảo dưới dạng file PDF để gửi tới các bạn cùng tham khảo, ôn tập đầy đủ kiến thức, chuẩn bị cho các buổi học thật tốt. Mời bạn đọc đón xem!
Môn: Microeconomics 635 tài liệu
Trường: Trường Đại học Quốc tế, Đại học Quốc gia Thành phố Hồ Chí Minh 1.9 K tài liệu
Tác giả:

Preview text:
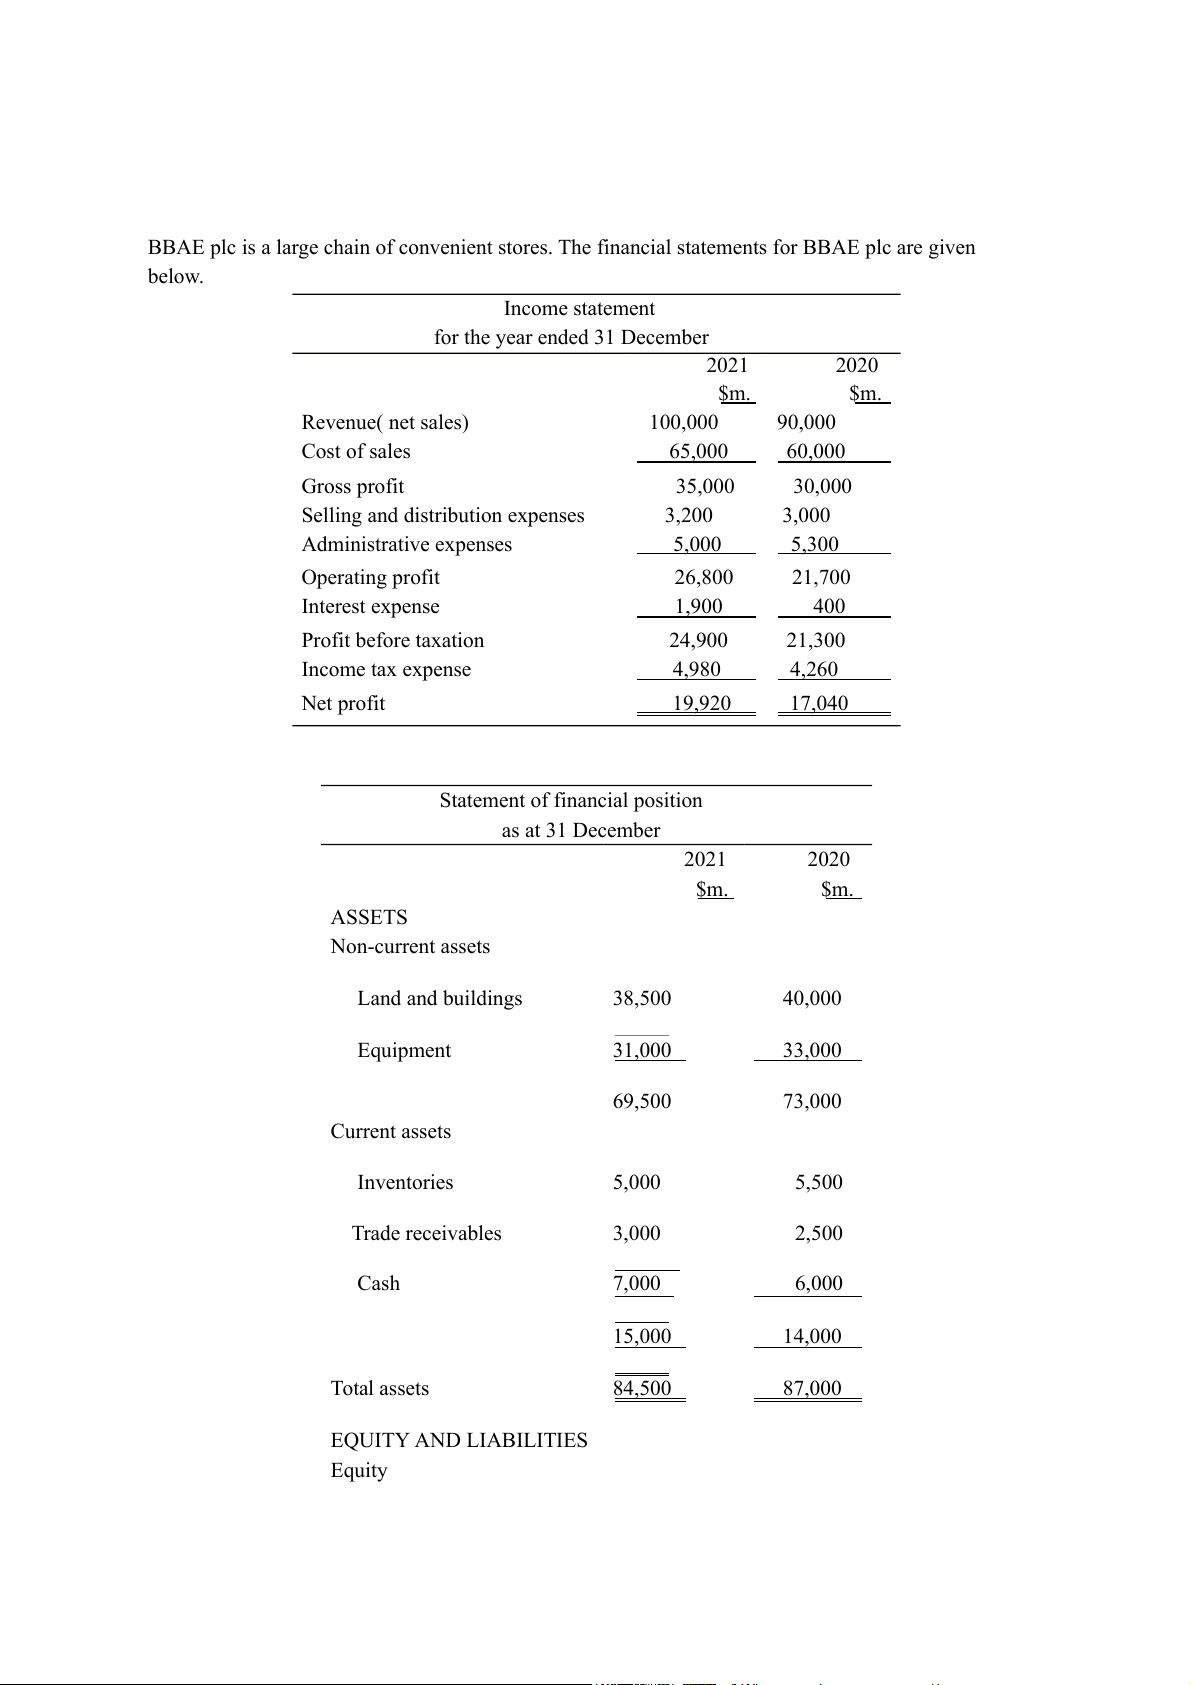
BBAE plc is a large chain of convenient stores. The financial statements for BBAE plc are given below. Income statement for the year ended 31 December 2021 2020 $m. $m. Revenue( net sales) 100,000 90,000 Cost of sales 65,000 60,000 Gross profit 35,000 30,000
Selling and distribution expenses 3,200 3,000 Administrative expenses 5,000 5,300 Operating profit 26,800 21,700 Interest expense 1,900 400 Profit before taxation 24,900 21,300 Income tax expense 4,980 4,260 Net profit 19,920 17,040
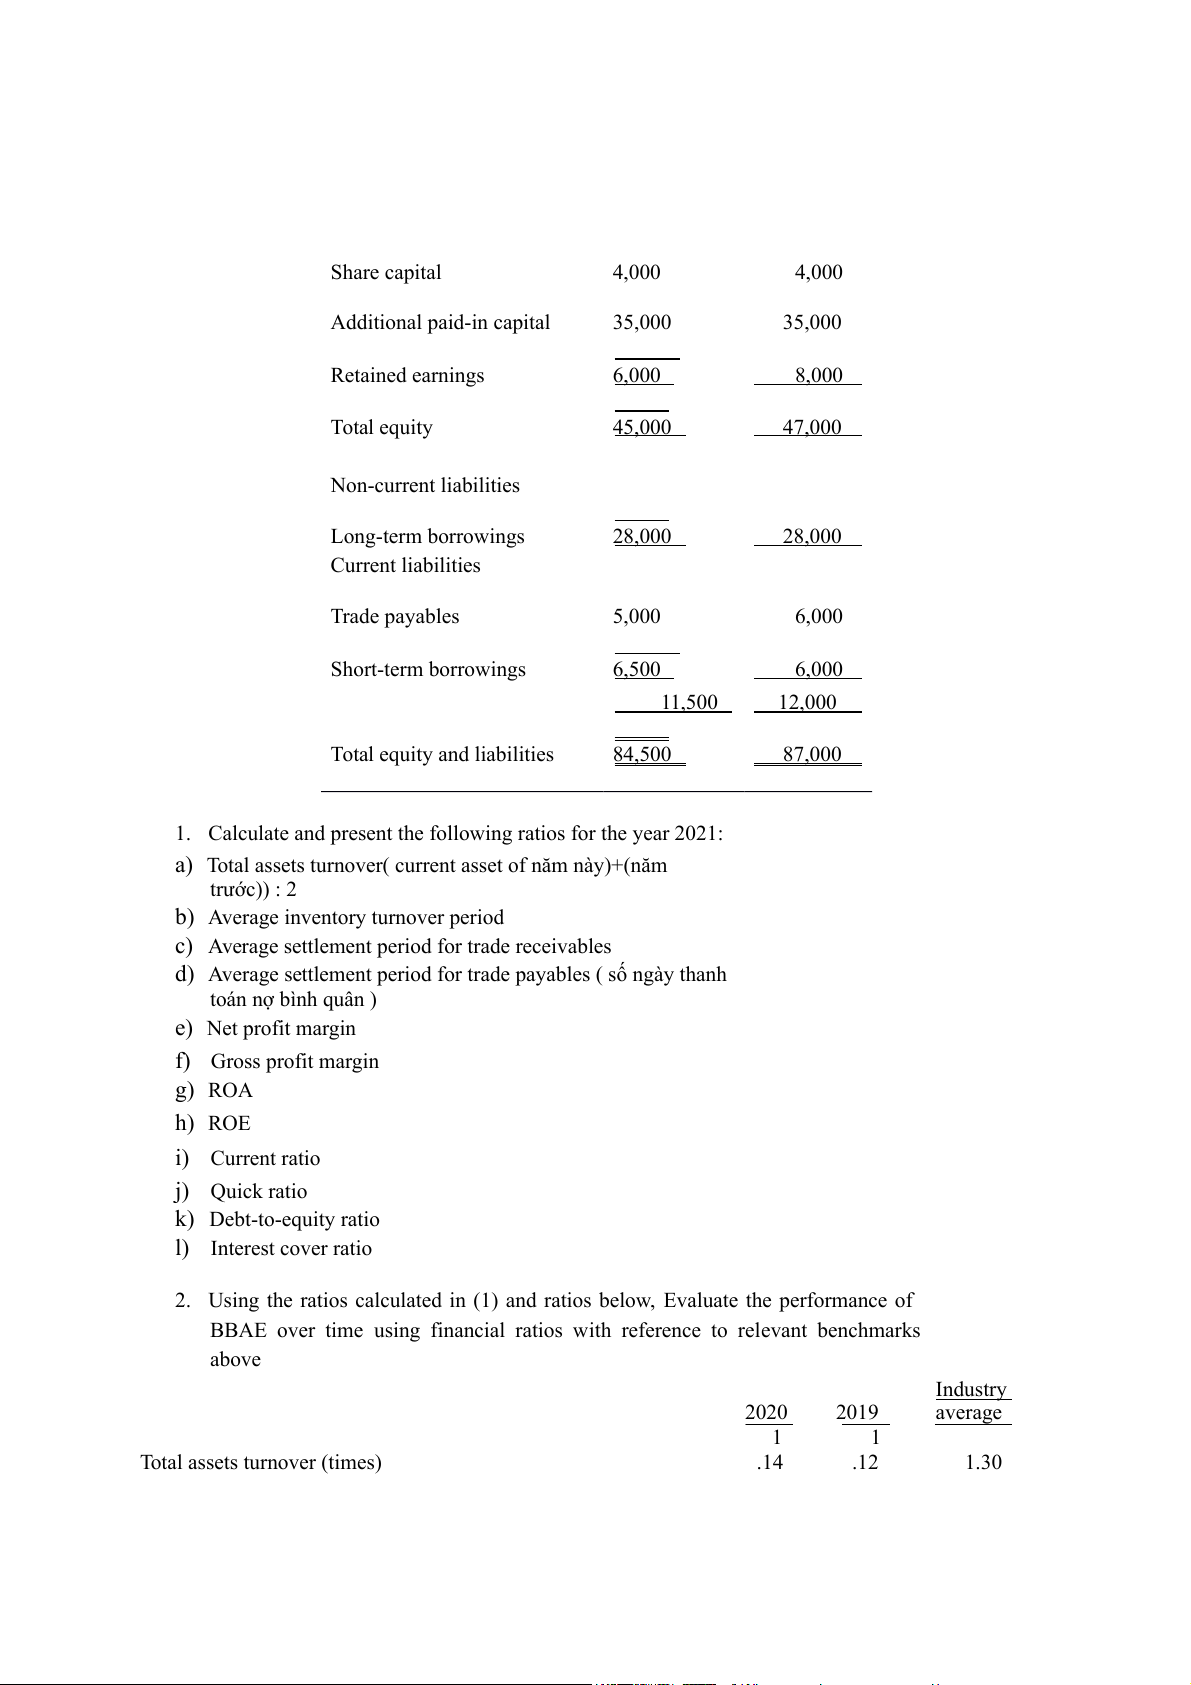
Statement of financial position as at 31 December 2021 2020 $m. $m. ASSETS Non-current assets Land and buildings 38,500 40,000 Equipment 31,000 33,000 69,500 73,000 Current assets Inventories 5,000 5,500 Trade receivables 3,000 2,500 Cash 7,000 6,000 15,000 14,000 Total assets 84,500 87,000 EQUITY AND LIABILITIES Equity Share capital 4,000 4,000 Additional paid-in capital 35,000 35,000 Retained earnings 6,000 8,000 Total equity 45,000 47,000 Non-current liabilities Long-term borrowings 28,000 28,000 Current liabilities Trade payables 5,000 6,000 Short-term borrowings 6,500 6,000 11,500 12,000 Total equity and liabilities 84,500 87,000
1. Calculate and present the following ratios for the year 2021:
a) Total assets turnover( current asset of năm này)+(năm trước)) : 2
b) Average inventory turnover period
c) Average settlement period for trade receivables
d) Average settlement period for trade payables ( số ngày thanh toán nợ bình quân ) e) Net profit margin f) Gross profit margin g) ROA h) ROE i) Current ratio j) Quick ratio k) Debt-to-equity ratio l) Interest cover ratio
2. Using the ratios calculated in (1) and ratios below, Evaluate the performance of
BBAE over time using financial ratios with reference to relevant benchmarks above Industry 2020 2019 average 1 1 Total assets turnover (times) .14 .12 1.30
Average inventory turnover period (days) 28.30 26.00 27.00
Average settlement period for trade receivables (days) 10.00 9.80 10.00
Average settlement period for trade payables (days) 28.00 26.50 29.00 Net profit margin 18.93% 18.50% 18.00% Gross profit margin 33.33% 31.50% 32.00% ROA 21.50% 20.80% 22.00% ROE 38.40% 36.70% 40.00% Current ratio (times) 1.17 1.1 1.2 Quick ratio (times) 0.71 0.6 0.8 Debt-to-equity ratio (times) 0.60 0.57 0.55 Interest cover ratio (times) 54.25 56 30
Phương pháp tính các tỉ suất ở các năm phải giống nhau
VD ; Năm 2020 k có dữ liệu 2019 để tính, phải coi dữ liệu cuối kì là trung bình thì năm
2021 cũng phải coi dữ liệu cuối kì làm trung bình để tính items code 2021 2020 2019 Industry average revenue a Ending total a b Beginning c total Total assets d tunrover ( show công thức)
Comments: company generated sales of ? dollars for each dollar it has invested in assets
Vẽ biểu đồ : nhận xét từng năm , so sánh giữa các năm , so sánh với tỉ suất toàn ngành
Sử dụng industry average so sánh với từng năm
Net sale tương tự revenue=gross sale : trong trường hợp không có đủ thông tin về allowances…
Net credit sale ( bán chịu) tương tự net sale trong trường hợp k có đủ in4 để tính net credit sale
( net sale > net credit sale)
Bẫy : net credit sale 2021 vs net sale 2020 ( saiiiiiii)
Tài liệu liên quan:
-

Chương 3: độ co giãn và các nhân tố ảnh hưởng | Microeconomics | Trường Đại học Quốc tế, Đại học Quốc gia Thành phố Hồ Chí Minh
3 2 -

Microeconomics Syllabus | Microeconomics | Trường Đại học Quốc tế, Đại học Quốc gia Thành phố Hồ Chí Minh
3 2 -

Microeconomics Course Syllabus & Assessment Details | Microeconomics | Trường Đại học Quốc tế, Đại học Quốc gia Thành phố Hồ Chí Minh
3 2 -

Assignment 3 - Elasticity MCQs and Key Concepts | Microeconomics | Trường Đại học Quốc tế, Đại học Quốc gia Thành phố Hồ Chí Minh
3 2 -

Assignment 2 - Economic Equilibrium Analysis of Fridges and Motorcycles | Microeconomics | Trường Đại học Quốc tế, Đại học Quốc gia Thành phố Hồ Chí Minh
3 2