Government Policy Analysis & Surplus Calculations | Microeconomics | Trường Đại học Quốc tế, Đại học Quốc gia Thành phố Hồ Chí Minh
Refer to Figure 1-2. The benefit to the government is measured by a. tax revenue and is represented by area A+B. b. tax revenue and is represented by area B+D. c. the net gain in total surplus and is represented by area B+D. d. the net gain in total surplus and is represented by area C+H. 12. Refer to Figure 1-2. The total surplus with the tax is represented by area a. C+H. b. A+B+C. c. D+H+F. d. A+B+D+F. 13. Refer to Figure 1-2. The loss in total welfare that results from the tax is represented by area a. A+B+D+F. b. A+B+C. c. D+H+F. d. C+H. Tài liệu được sưu tầm và soạn thảo dưới dạng file PDF để gửi tới các bạn cùng tham khảo, ôn tập đầy đủ kiến thức, chuẩn bị cho các buổi học thật tốt. Mời bạn đọc đón xem!
Môn: Microeconomics 635 tài liệu
Trường: Trường Đại học Quốc tế, Đại học Quốc gia Thành phố Hồ Chí Minh 1.9 K tài liệu
Tác giả:

Preview text:
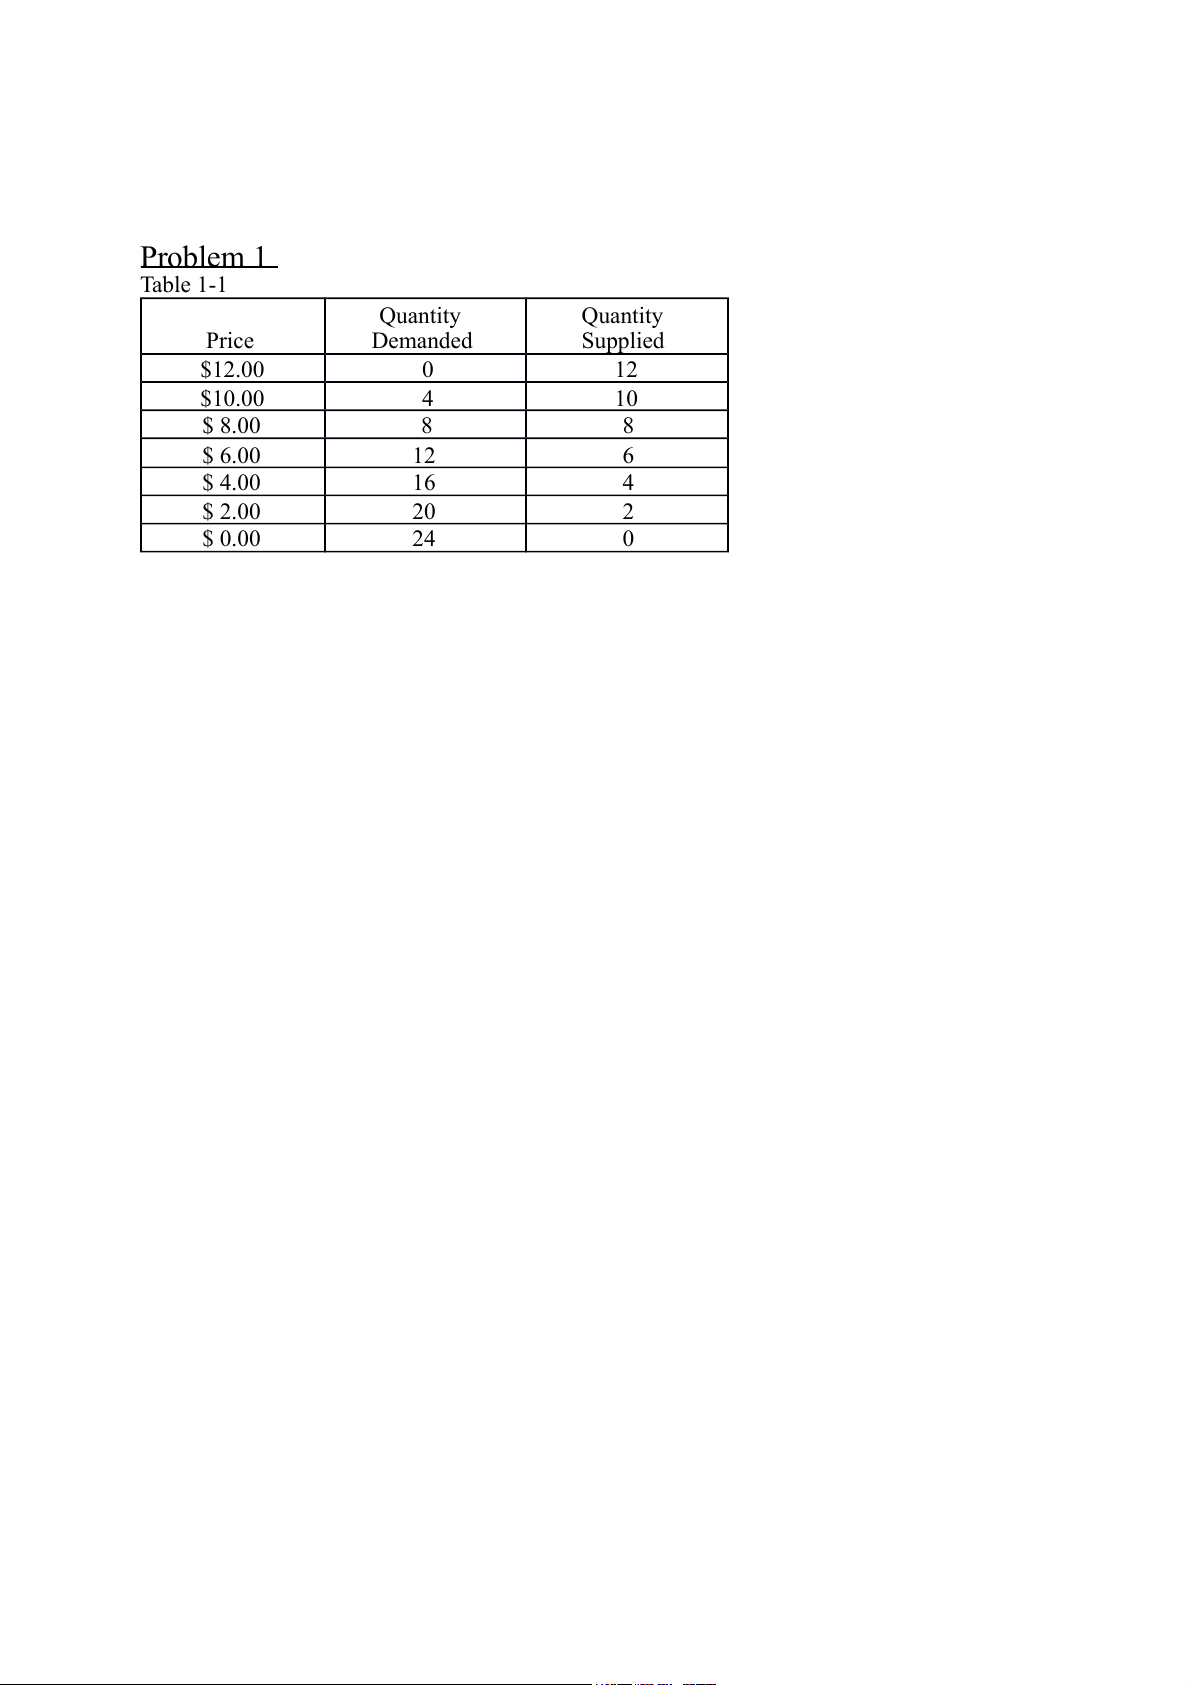
Problem 1 Table 1-1 Quantity Quantity Price Demanded Supplied $12.00 0 12 $10.00 4 10 $ 8.00 8 8 $ 6.00 12 6 $ 4.00 16 4 $ 2.00 20 2 $ 0.00 24 0 1.
Refer to Table 1-1. The equilibrium price is a. $10.00. b. $8.00. c. $6.00. d. $4.00. 2.
Refer to Table 1-1. At a price of $4.00, total surplus is
a. more than it would be at the equilibrium price.
b. less than it would be at the equilibrium price.
c. the same as it would be at the equilibrium price.
d. There is insufficient information to make this determination. 3.
Refer to Table 1-1. Both the demand curve and the supply curve are straight lines. At
equilibrium, consumer surplus is a. $8. b. $12. c. $16. d. $32. 4.
Refer to Table 1-1. Both the demand curve and the supply curve are straight lines. At
equilibrium, producer surplus is a. $24. b. $32. c. $48. d. $64. 5.
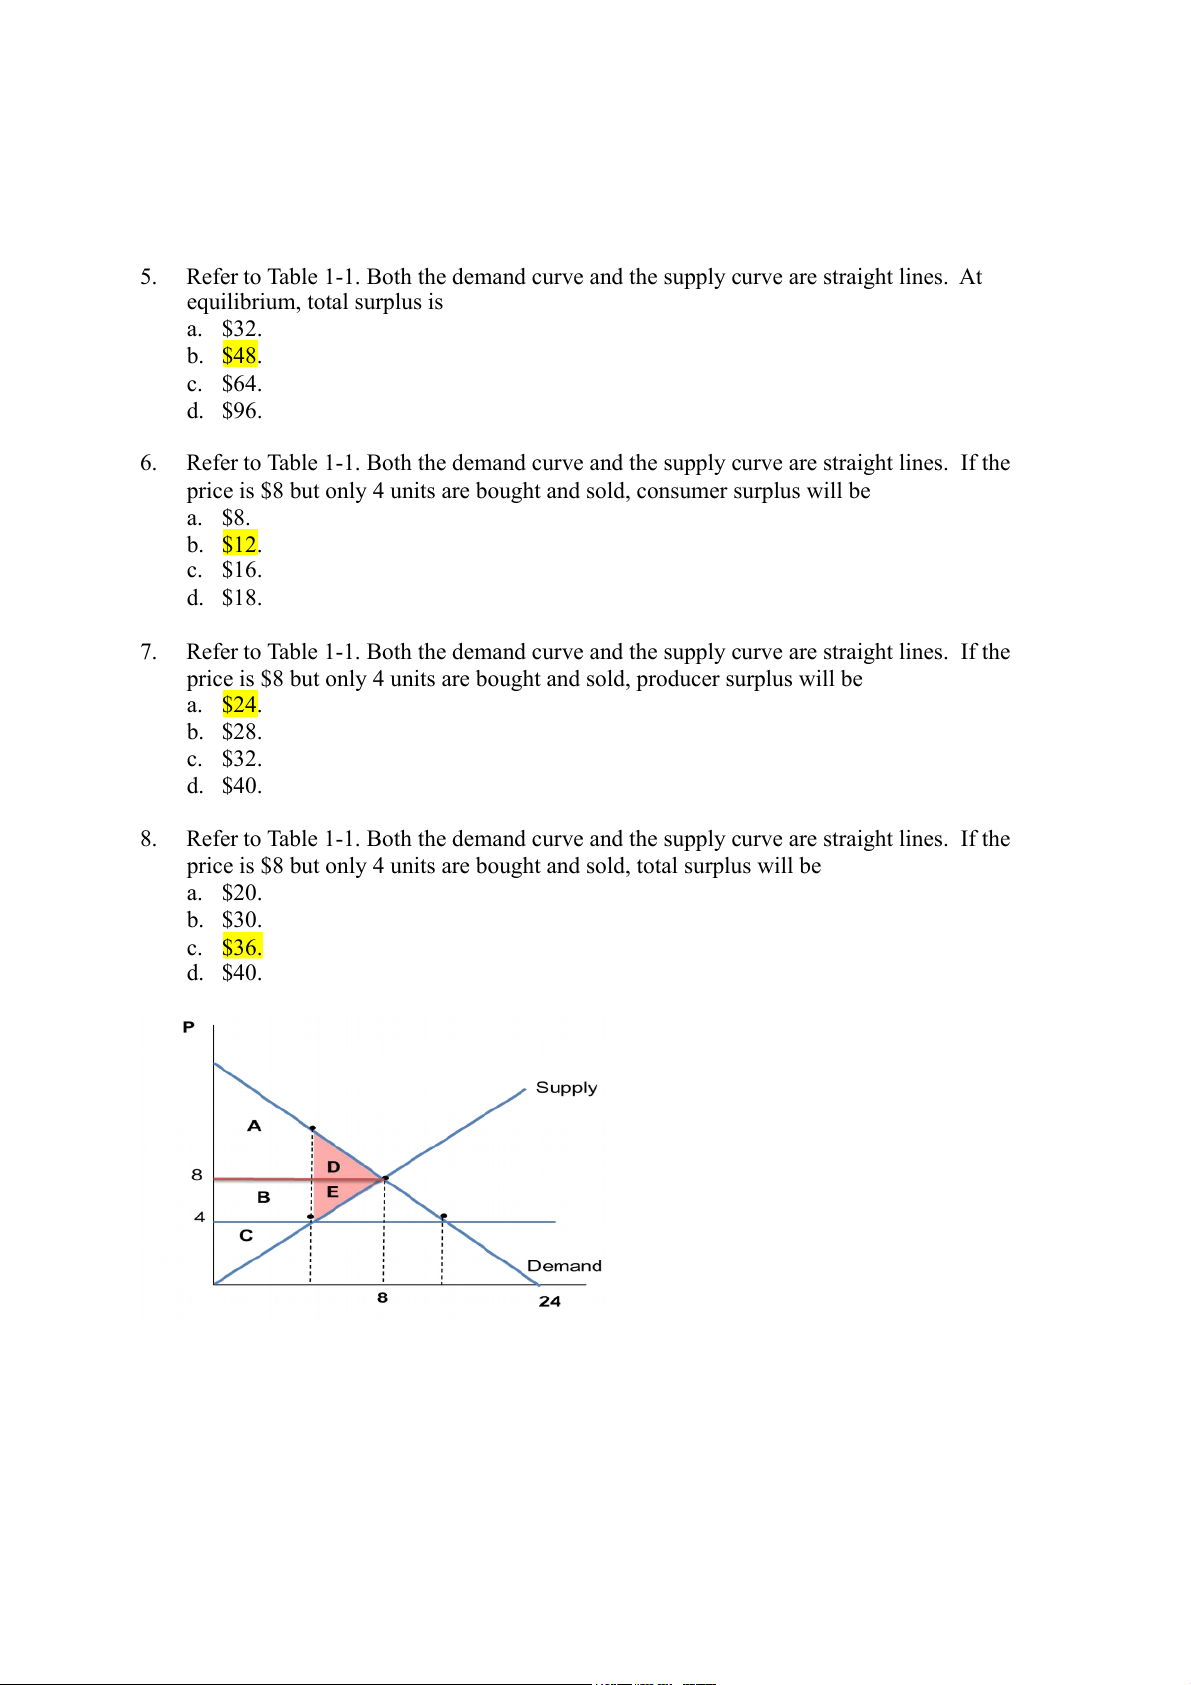
Refer to Table 1-1. Both the demand curve and the supply curve are straight lines. At equilibrium, total surplus is a. $32. b. $48. c. $64. d. $96. 6.
Refer to Table 1-1. Both the demand curve and the supply curve are straight lines. If the price is $8 but
are bought and sold, consumer surplus will be only 4 units a. $8. b. $12. c. $16. d. $18. 7.
Refer to Table 1-1. Both the demand curve and the supply curve are straight lines. If the price is $8 but
are bought and sold, producer surplus will be only 4 units a. $24. b. $28. c. $32. d. $40. 8.
Refer to Table 1-1. Both the demand curve and the supply curve are straight lines. If the price is $8 but
are bought and sold, total surplus will be only 4 units a. $20. b. $30. c. $36. d. $40. Problem 2
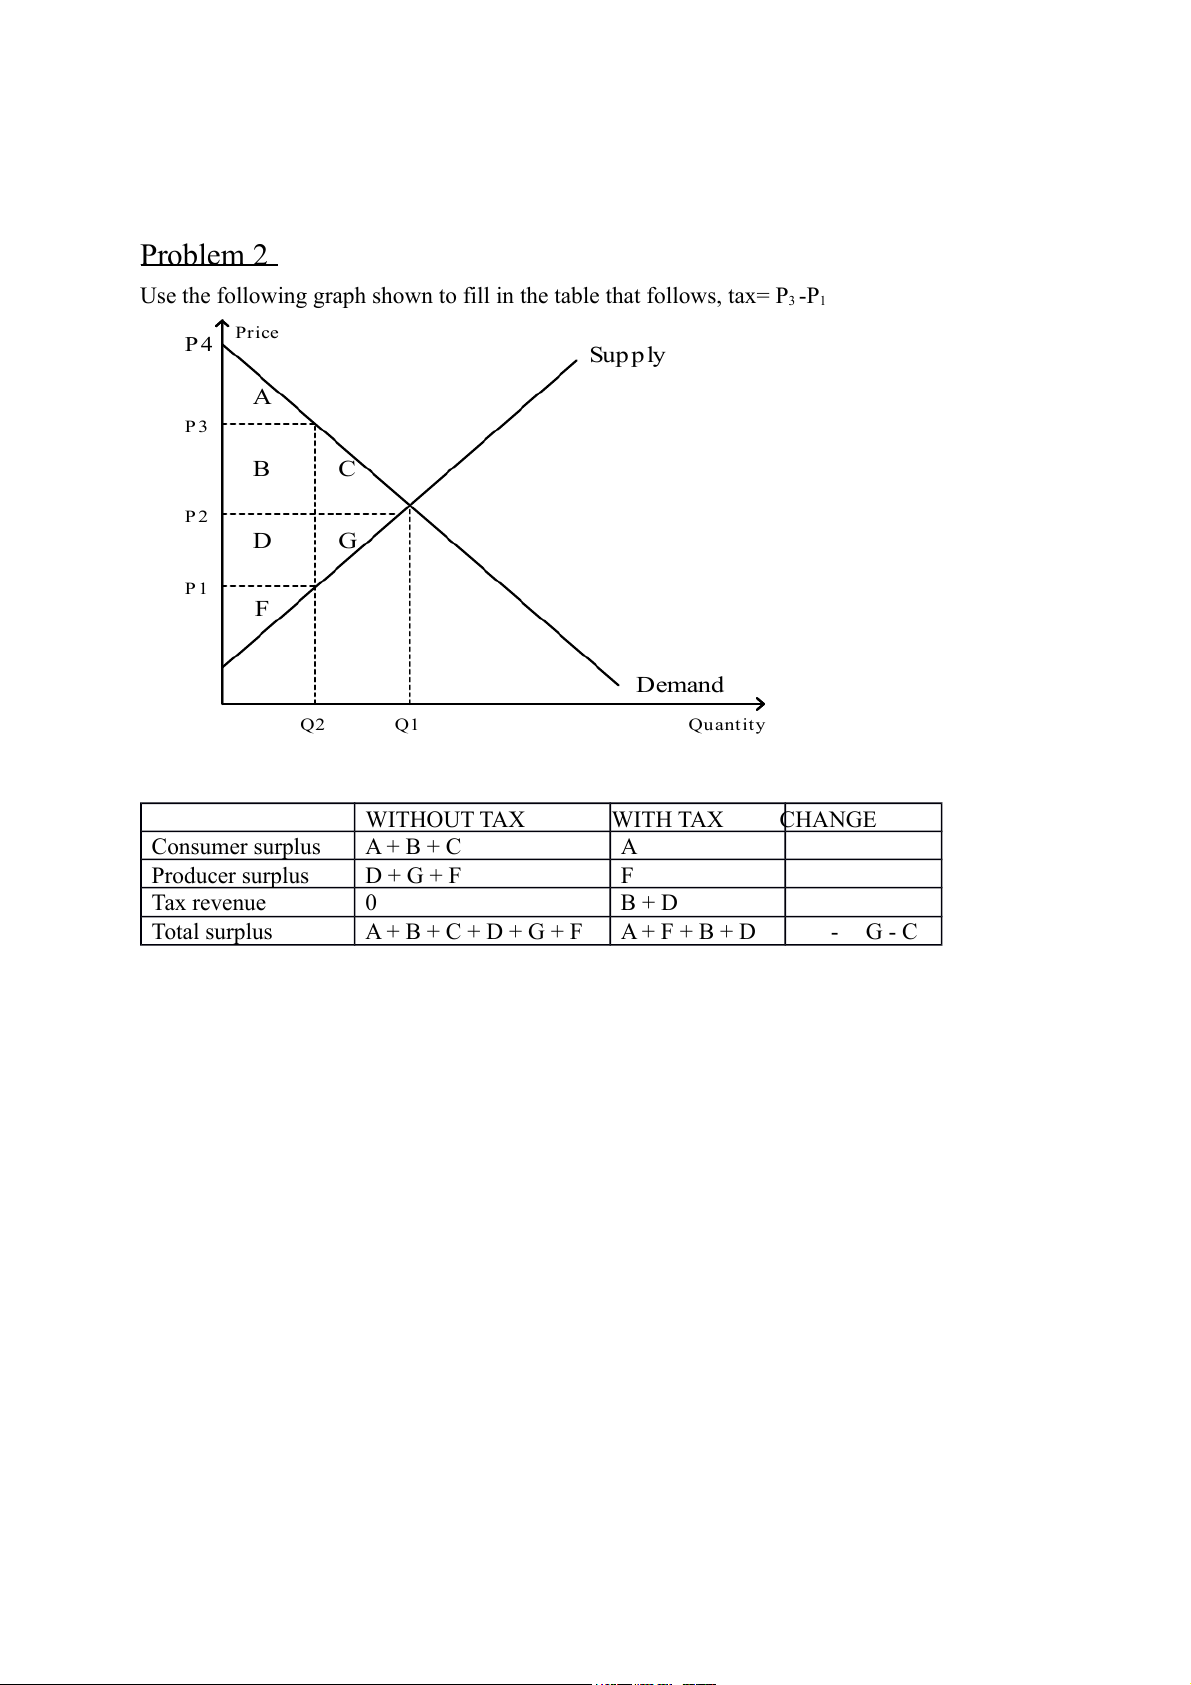
Use the following graph shown to fill in the table that follows, tax= P3 -P1 Price P 4 Sup p ly A P 3 B C P 2 D G P 1 F Demand Q2 Q1 Quantity WITHOUT TAX WITH TAX CHANGE Consumer surplus A + B + C A Producer surplus D + G + F F Tax revenue 0 B + D Total surplus A + B + C + D + G + F A + F + B + D - G - C Problem 3
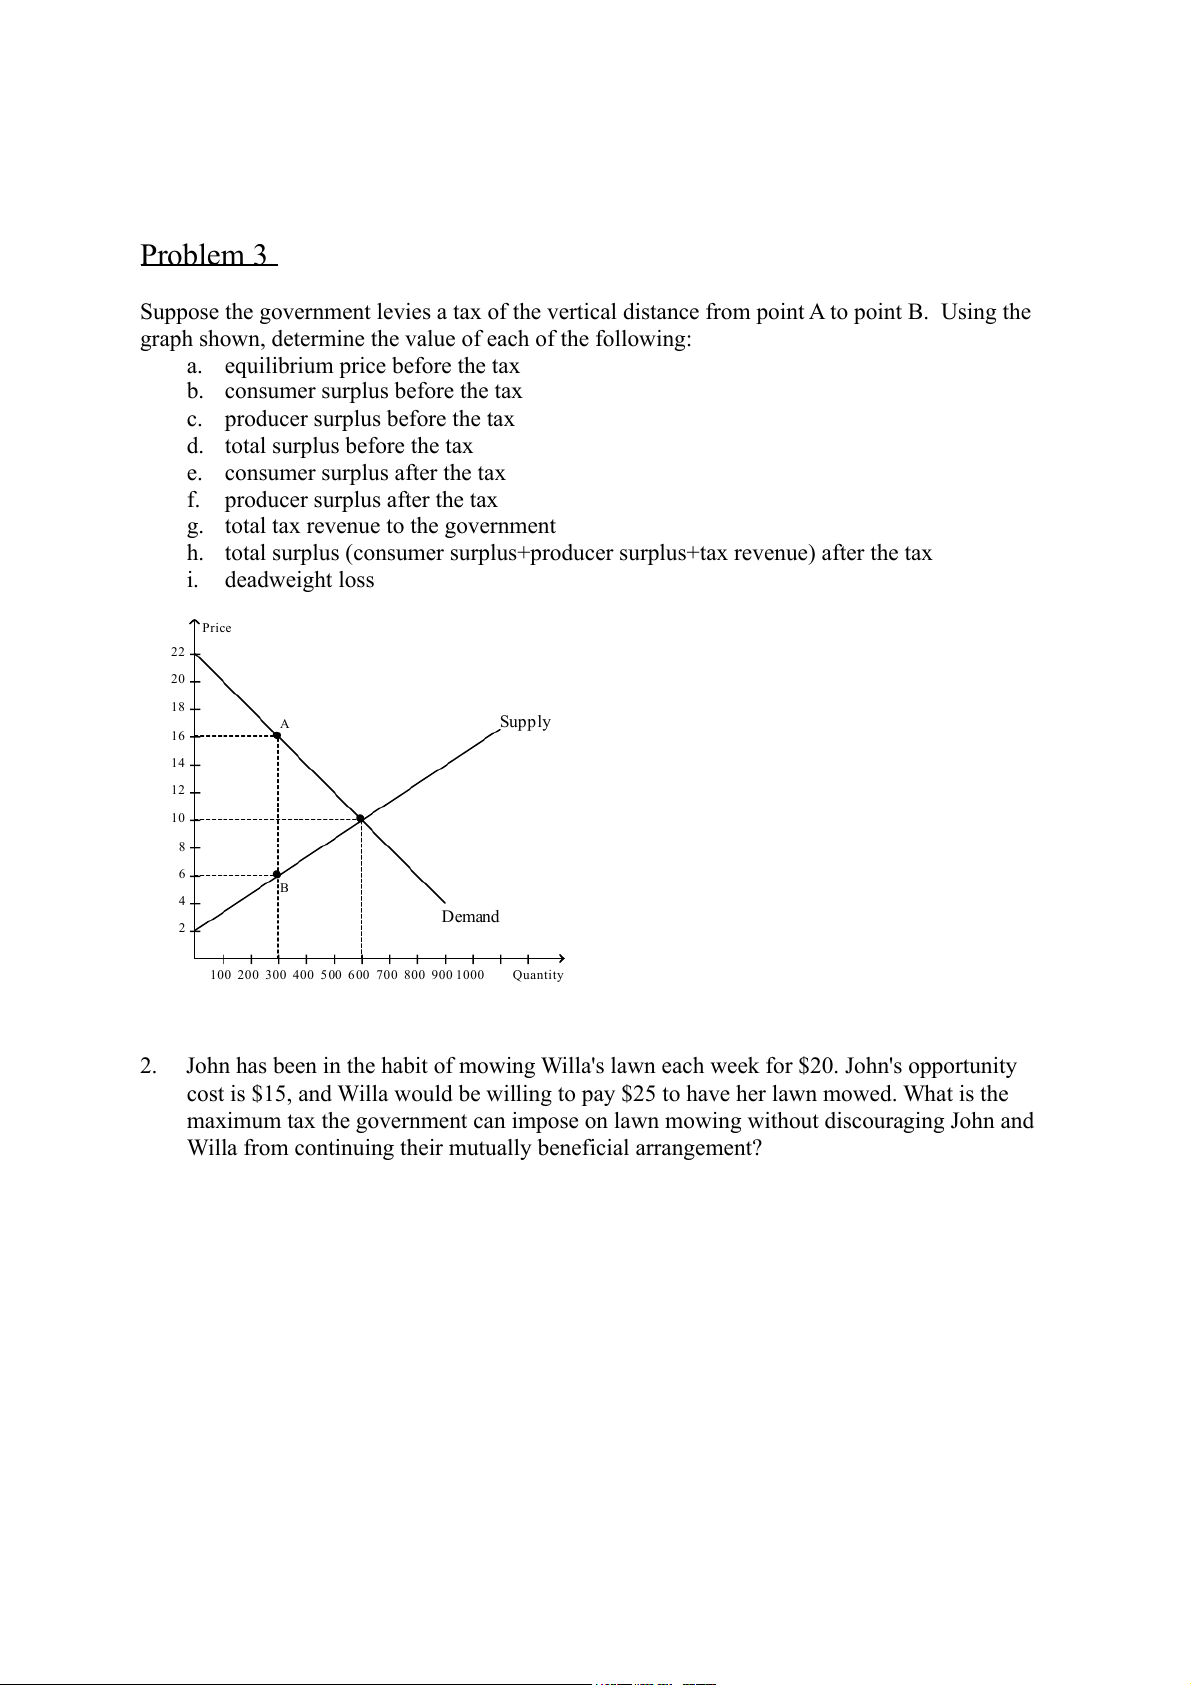
Suppose the government levies a tax of the vertical distance from point A to point B. Using the
graph shown, determine the value of each of the following:
a. equilibrium price before the tax
b. consumer surplus before the tax
c. producer surplus before the tax
d. total surplus before the tax
e. consumer surplus after the tax
f. producer surplus after the tax
g. total tax revenue to the government
h. total surplus (consumer surplus+producer surplus+tax revenue) after the tax i. deadweight loss Price 22 20 18 A Supply 16 14 12 10 8 6 B 4 Demand 2
100 200 300 400 500 600 700 800 900 1000 Quantity 2.
John has been in the habit of mowing Willa's lawn each week for $20. John's opportunity
cost is $15, and Willa would be willing to pay $25 to have her lawn mowed. What is the
maximum tax the government can impose on lawn mowing without discouraging John and
Willa from continuing their mutually beneficial arrangement? Problem 4:
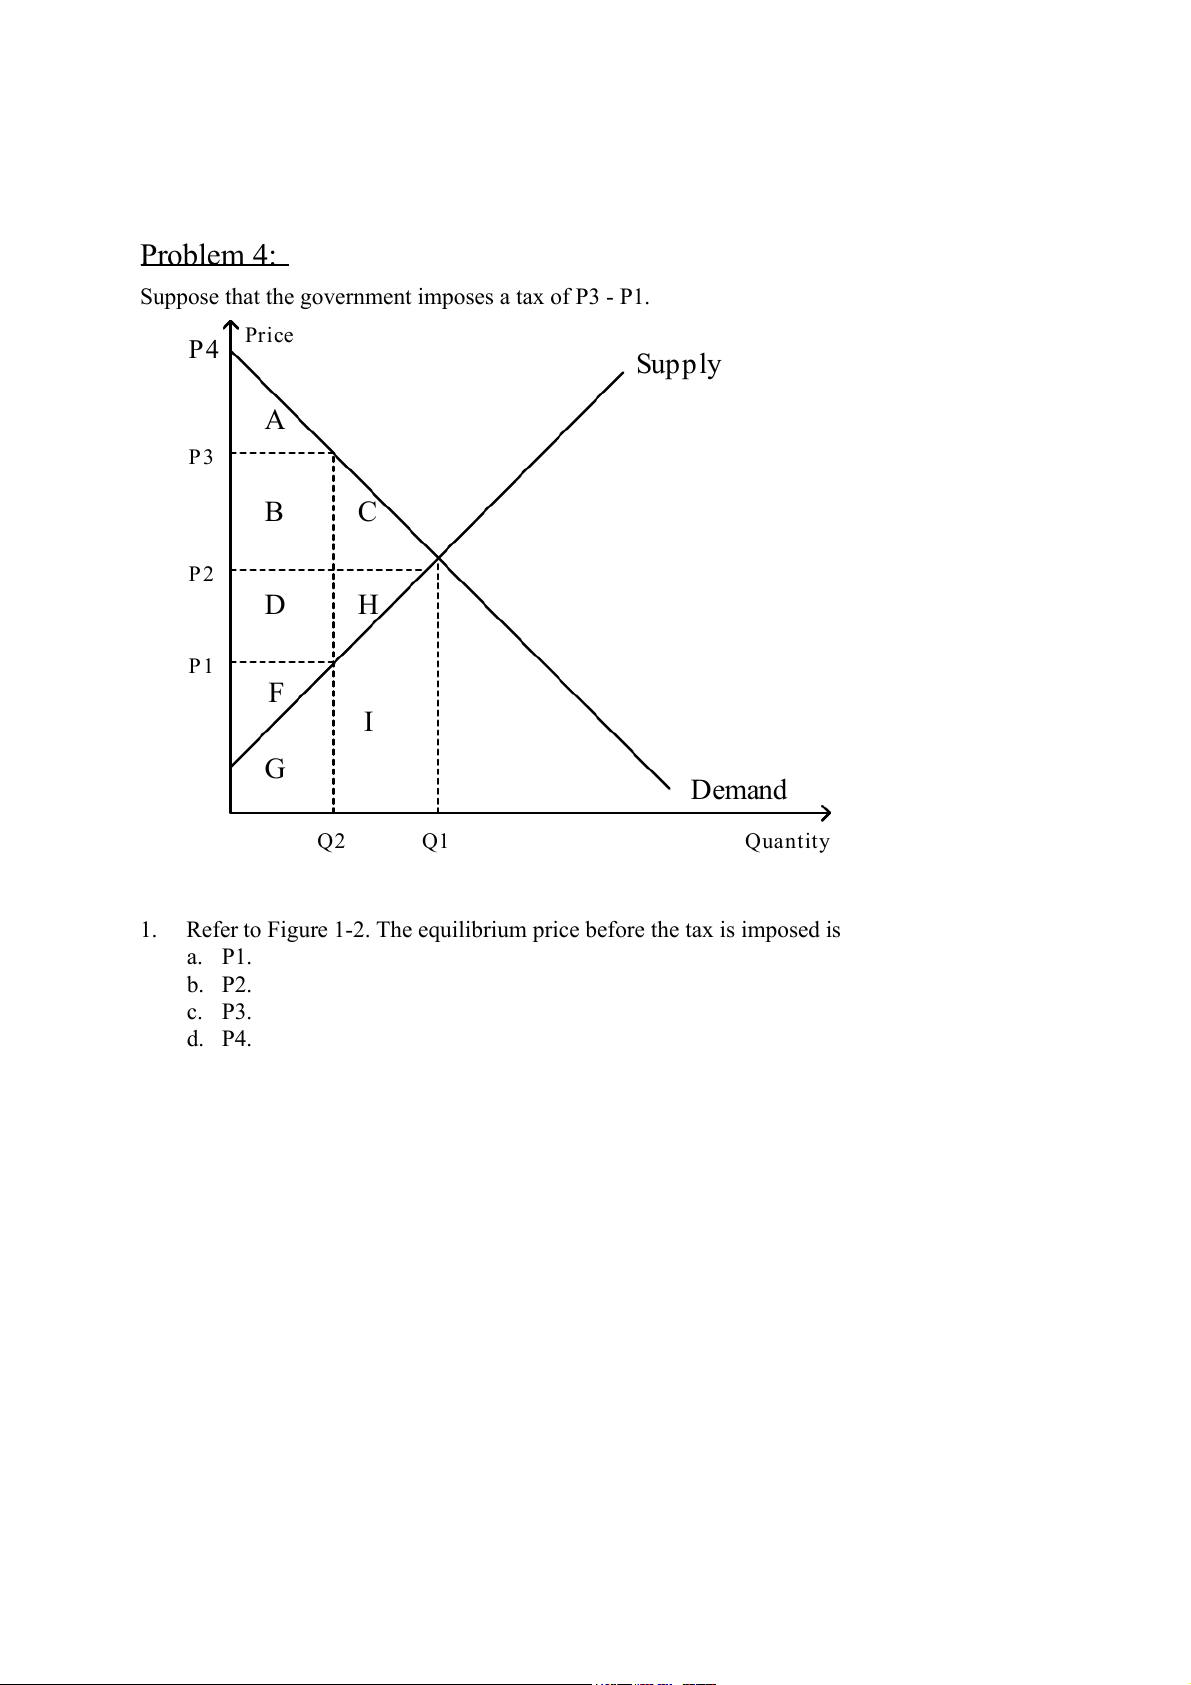
Suppose that the government imposes a tax of P3 - P1. P4 Price Supply A P3 B C P2 D H P1 F I G Demand Q2 Q1 Quantity 1.
Refer to Figure 1-2. The equilibrium price before the tax is imposed is a. P1. b. P2. c. P3. d. P4. 2.
Refer to Figure 1-2. The price that buyers effectively pay after the tax is imposed is a. P1. b. P2. c. P3. d. P4. 3.
Refer to Figure 1-2. The price that sellers effectively receive after the tax is imposed is a. P1. b. P2. c. P3. d. P4. 4.
Refer to Figure 1-2. The tax is levied on a. buyers only. b. sellers only. c. both buyers and sellers.
d. This is impossible to determine from the figure. 5.
Refer to Figure 1-2. Consumer surplus before the tax was levied is represented by area a. A. b. A+B+C. c. D+H+F. d. F. 6.
Refer to Figure 1-2. Producer surplus before the tax was levied is represented by area a. A. b. A+B+C. c. D+H+F. d. F. 7.
Refer to Figure 1-2. After the tax is levied, consumer surplus is represented by area a. A. b. A+B+C. c. D+H+F. d. F. 8.
Refer to Figure 1-2. After the tax is levied, producer surplus is represented by area a. A. b. A+B+C. c. D+H+F. d. F. 9.
Refer to Figure 1-2. The tax causes a reduction in consumer surplus that is represented by area a. A. b. B+C. c. C+H. d. F.
10. Refer to Figure 1-2. The tax causes a reduction in producer surplus that is represented by area a. A. b. C+H. c. D+H. d. F.
11. Refer to Figure 1-2. The benefit to the government is measured by
a. tax revenue and is represented by area A+B.
b. tax revenue and is represented by area B+D.
c. the net gain in total surplus and is represented by area B+D.
d. the net gain in total surplus and is represented by area C+H.
12. Refer to Figure 1-2. The total surplus with the tax is represented by area a. C+H. b. A+B+C. c. D+H+F. d. A+B+D+F.
13. Refer to Figure 1-2. The loss in total welfare that results from the tax is represented by area a. A+B+D+F. b. A+B+C. c. D+H+F. d. C+H.
Tài liệu liên quan:
-

Chương 3: độ co giãn và các nhân tố ảnh hưởng | Microeconomics | Trường Đại học Quốc tế, Đại học Quốc gia Thành phố Hồ Chí Minh
4 2 -

Microeconomics Syllabus | Microeconomics | Trường Đại học Quốc tế, Đại học Quốc gia Thành phố Hồ Chí Minh
4 2 -

Microeconomics Course Syllabus & Assessment Details | Microeconomics | Trường Đại học Quốc tế, Đại học Quốc gia Thành phố Hồ Chí Minh
4 2 -

Assignment 3 - Elasticity MCQs and Key Concepts | Microeconomics | Trường Đại học Quốc tế, Đại học Quốc gia Thành phố Hồ Chí Minh
4 2 -

Assignment 2 - Economic Equilibrium Analysis of Fridges and Motorcycles | Microeconomics | Trường Đại học Quốc tế, Đại học Quốc gia Thành phố Hồ Chí Minh
4 2