Group Assignment 1: Analyzing Opportunity Costs | Microeconomics | Trường Đại học Quốc tế, Đại học Quốc gia Thành phố Hồ Chí Minh
In conclusion, there is an increase in opportunity costs for missile production. b) The opportunity costs of increasing output from point C to D (2 million cars) is 9 thousand missiles so the opportunity costs of producing 1 million more cars is 9 2 = 4.5 thousand missiles. Tài liệu được sưu tầm và soạn thảo dưới dạng file PDF để gửi tới các bạn cùng tham khảo, ôn tập đầy đủ kiến thức, chuẩn bị cho các buổi học thật tốt. Mời bạn đọc đón xem!
Môn: Microeconomics 635 tài liệu
Trường: Trường Đại học Quốc tế, Đại học Quốc gia Thành phố Hồ Chí Minh 1.9 K tài liệu
Tác giả:


Preview text:
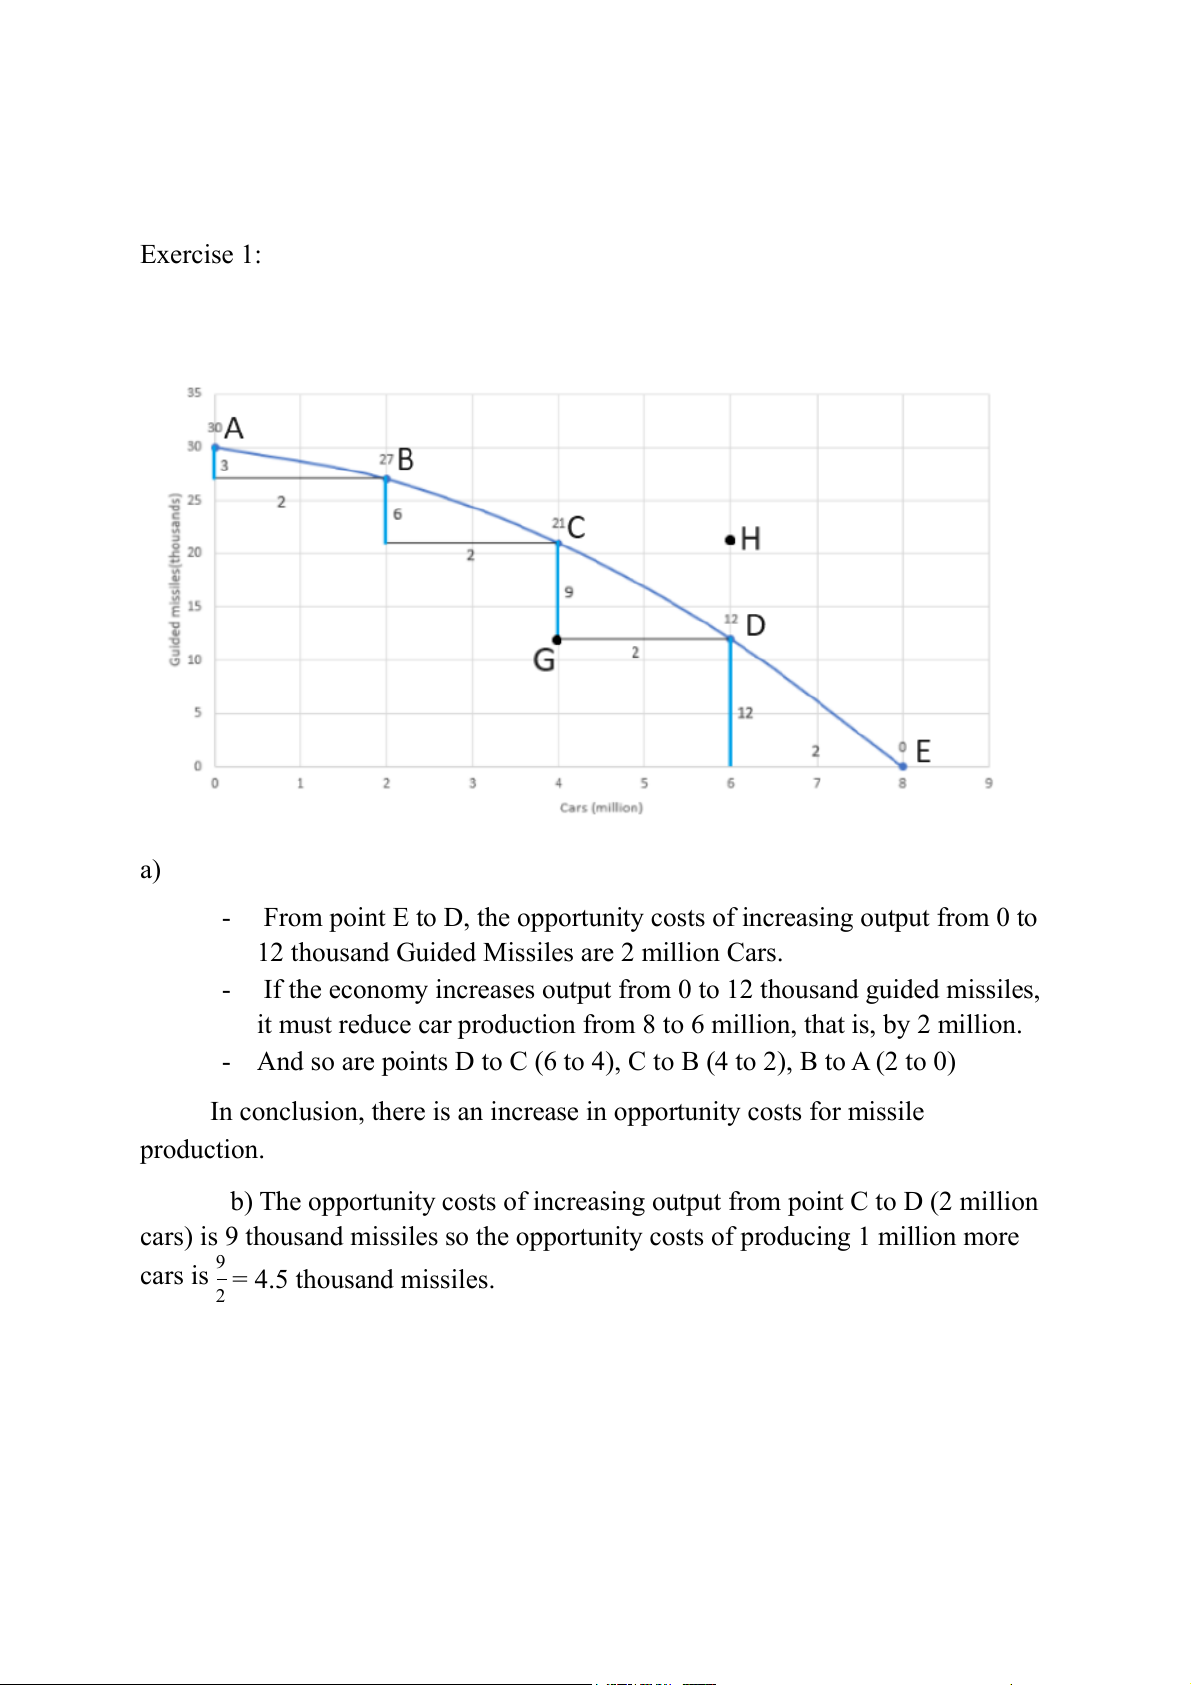
Exercise 1: a)
- From point E to D, the opportunity costs of increasing output from 0 to
12 thousand Guided Missiles are 2 million Cars.
- If the economy increases output from 0 to 12 thousand guided missiles,
it must reduce car production from 8 to 6 million, that is, by 2 million.
- And so are points D to C (6 to 4), C to B (4 to 2), B to A (2 to 0)
In conclusion, there is an increase in opportunity costs for missile production.
b) The opportunity costs of increasing output from point C to D (2 million
cars) is 9 thousand missiles so the opportunity costs of producing 1 million more
cars is 9 = 4.5 thousand missiles. 2
The opportunity costs of increasing output from C to B (6 thousand missiles)
is 2 million cars so the opportunity cost of producing 1 thousand more missiles is 2 6 = 1 million cars. 3
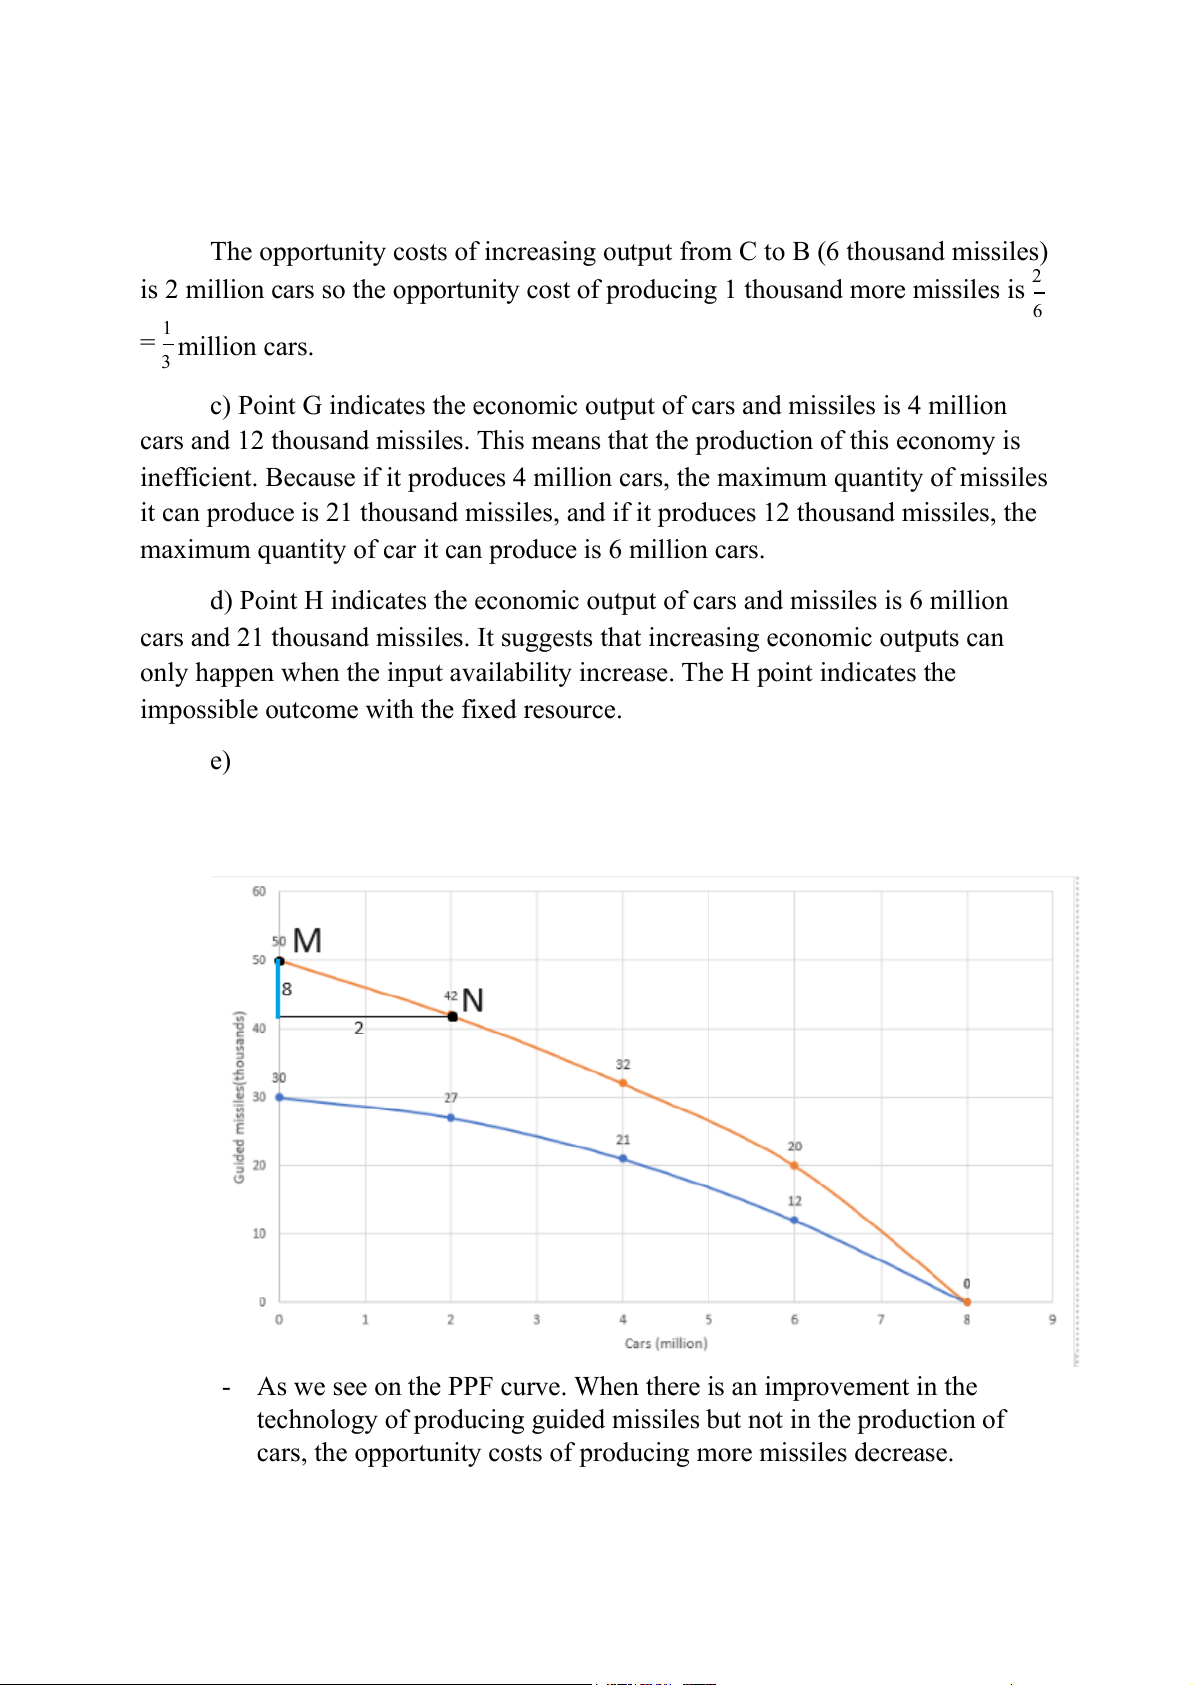
c) Point G indicates the economic output of cars and missiles is 4 million
cars and 12 thousand missiles. This means that the production of this economy is
inefficient. Because if it produces 4 million cars, the maximum quantity of missiles
it can produce is 21 thousand missiles, and if it produces 12 thousand missiles, the
maximum quantity of car it can produce is 6 million cars.
d) Point H indicates the economic output of cars and missiles is 6 million
cars and 21 thousand missiles. It suggests that increasing economic outputs can
only happen when the input availability increase. The H point indicates the
impossible outcome with the fixed resource. e)
- As we see on the PPF curve. When there is an improvement in the
technology of producing guided missiles but not in the production of
cars, the opportunity costs of producing more missiles decrease.
- For example, the opportunity cost of increasing output from N to M (8
thousand missiles) is 2 million cars so the opportunity costs of
producing 1 thousand more missiles is 2 = 1 million cars , which is 8 4
lower than that of before improvement occurs (2 ) 3
- Thus, the slope of the line witnesses a growth. -
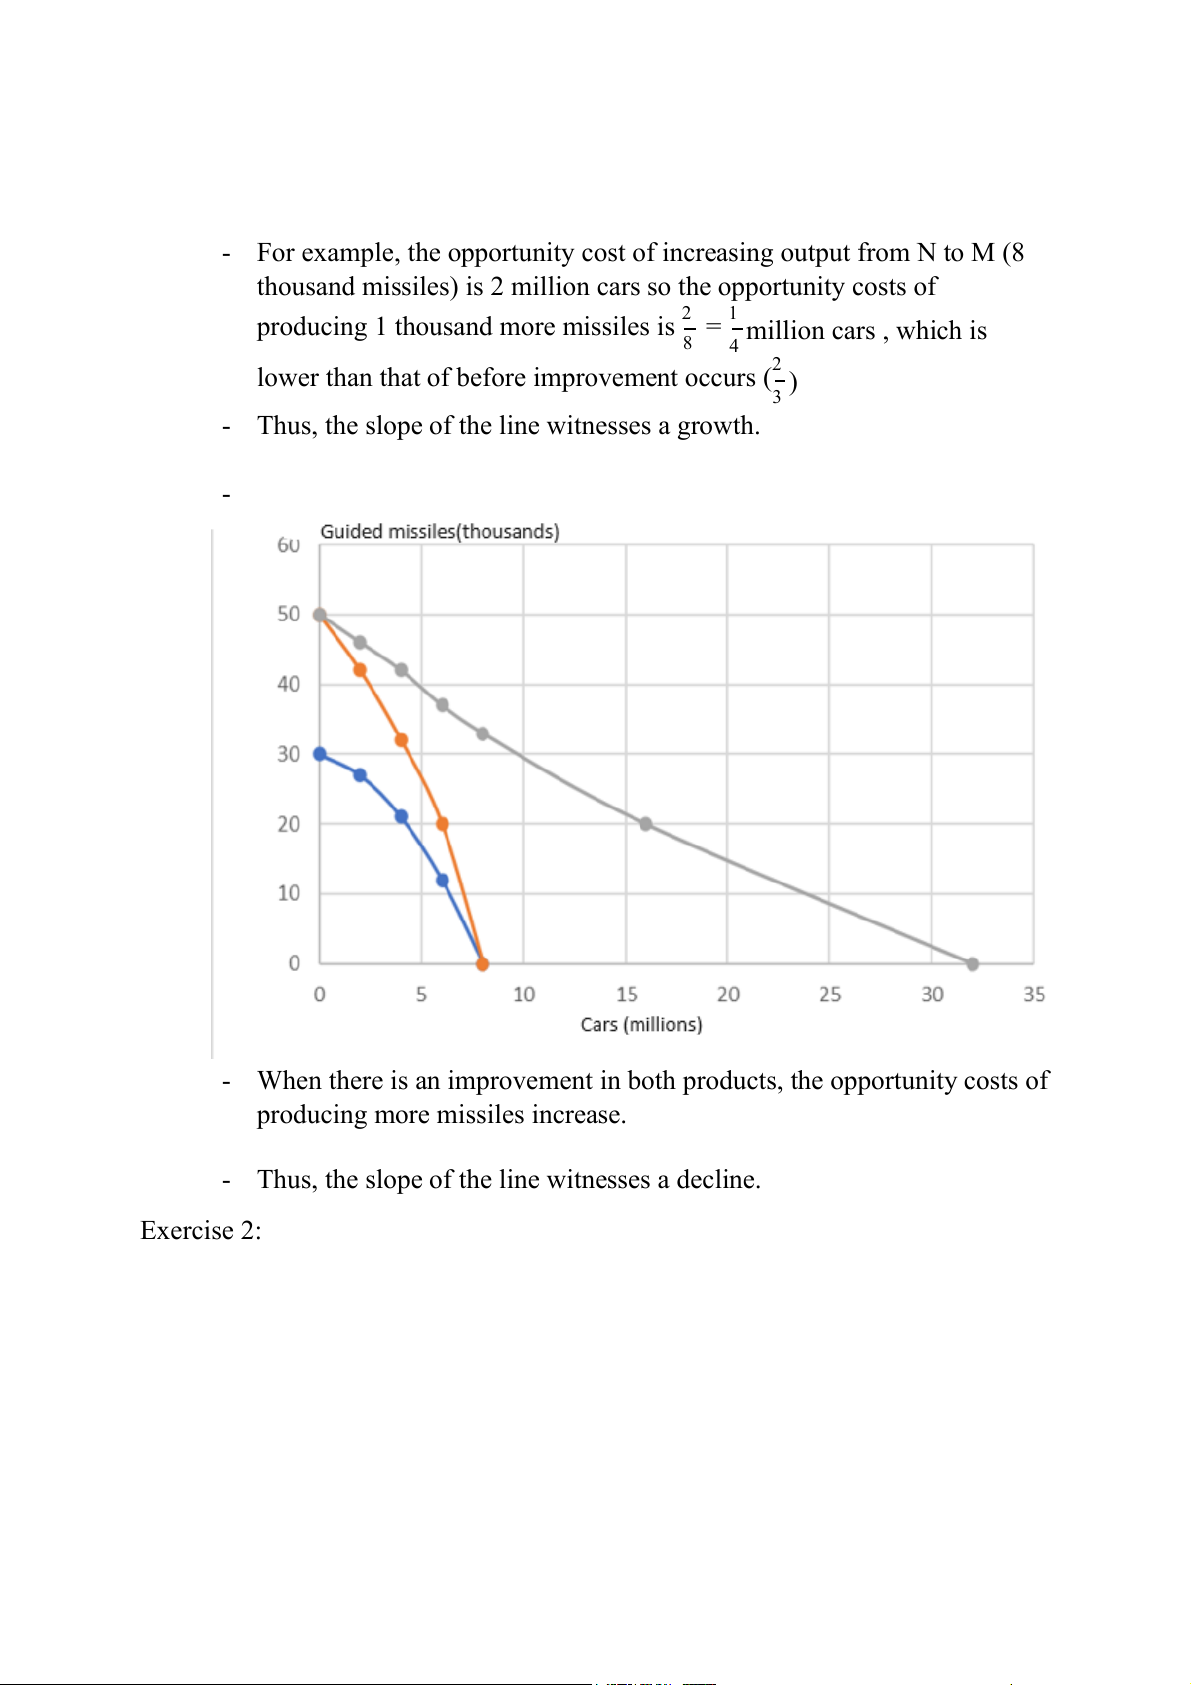
- When there is an improvement in both products, the opportunity costs of
producing more missiles increase.
- Thus, the slope of the line witnesses a decline. Exercise 2: b)
- If the output of Wheat and Cloths are 9 tons of Wheat and 4000 sets of Cloths
→ this economy is not allocative efficient.
- If it produces 9 tons of Wheat, the most set of cloths it can produce is 9000 sets of
cloths or if it produces 4000 sets of cloths, the most of wheat it can produce is 20 tons
→ The point would lie inside the production possibility frontier, at point G in the diagram. Opport Opport Wheat Cloths Wheat Cloths unity unity change change change change costs costs A→B -5 +4 1,25 E→D +9 -1 0,11 B→C -5 +3 1,66 D→C +6 -2 0,33 C→D -6 +2 3 C→B +5 -3 0,6 D→E -9 +1 9 B→A +5 -4 0,8
c, Belong to PPF if output of wheat and cloths are 20 tons of wheat and 10000 set
of cloths that this economy is impossible. If it produces 20 tons of wheat, the
amount of resource is just enough to produce 4000 set of cloths or if it produces
10000 set of cloths, at that time the resource is running out. There will be lack of
resourse to produce wheat. That point would lie outside the PPF, at point T. So it is
impossible for this economy produce 20 tons of wheat and 10000 set of cloths.
d, To produce effectively this economy, there is a contrast between making use of
resources to produce wheat and cloths. From point A to B, while wheat decrease
from 25 tons to 20 tons, clothes have an upward trend from 0 to 4000 set of cloths.
The opportunity cost of producing 4000 set of cloths is 5 tons of wheat → The
opportunity cost of producing 1000 set of cloths is 1,25 tons of wheat → From B to
A the opportunity cost of producing 1 ton of wheat is 0,8 thousand set of cloths.
Similarly, from point B to C the opportunity cost of producing 1000 set of cloths is
1,66 tons of wheat → From C to B the opportunity cost of producing 1 ton of
wheat is 0,6 thousand set of cloths. From point C to D the opportunity cost of
producing 1000 set of cloths is 3 tons of wheat → From D to C the opportunity
cost of producing 1 ton of wheat is 0,33 thousand set of cloths. From point D to E
the opportunity cost of producing 1000 set of cloths is 9 tons of wheat → From E
to D the opportunity cost of producing 1 ton of wheat is 0,11 thousand set of cloths.
Tài liệu liên quan:
-

Chương 3: độ co giãn và các nhân tố ảnh hưởng | Microeconomics | Trường Đại học Quốc tế, Đại học Quốc gia Thành phố Hồ Chí Minh
4 2 -

Microeconomics Syllabus | Microeconomics | Trường Đại học Quốc tế, Đại học Quốc gia Thành phố Hồ Chí Minh
4 2 -

Microeconomics Course Syllabus & Assessment Details | Microeconomics | Trường Đại học Quốc tế, Đại học Quốc gia Thành phố Hồ Chí Minh
4 2 -

Assignment 3 - Elasticity MCQs and Key Concepts | Microeconomics | Trường Đại học Quốc tế, Đại học Quốc gia Thành phố Hồ Chí Minh
4 2 -

Assignment 2 - Economic Equilibrium Analysis of Fridges and Motorcycles | Microeconomics | Trường Đại học Quốc tế, Đại học Quốc gia Thành phố Hồ Chí Minh
4 2