Group Assignment Presentation 3: Housing Market Impact Post-Katrina | Microeconomics | Trường Đại học Quốc tế, Đại học Quốc gia Thành phố Hồ Chí Minh
In the late summer of 2015, Hurricane Katrina caused a storm surge and levee breaks that flooded much of New Orleans and destroyed a large fraction of the city’s housing. Hundreds of thousands of residents were displaced, and about 250,000 relocated to nearby Baton Rouge. The increase in population was so large that Baton Rouge became the largest city in the state, and many people started calling the city “New Baton Roug. Tài liệu được sưu tầm và soạn thảo dưới dạng file PDF để gửi tới các bạn cùng tham khảo, ôn tập đầy đủ kiến thức, chuẩn bị cho các buổi học thật tốt. Mời bạn đọc đón xem!
Môn: Microeconomics 635 tài liệu
Trường: Trường Đại học Quốc tế, Đại học Quốc gia Thành phố Hồ Chí Minh 1.9 K tài liệu
Tác giả:

Preview text:
Tr ầ n Group assignment presentation 3 Đức Vinh_Group 5 1. Case 1
In the late summer of 2015, Hurricane Katrina caused a storm surge and levee breaks that
flooded much of New Orleans and destroyed a large fraction of the city’s housing.
Hundreds of thousands of residents were displaced, and about 250,000 relocated to
nearby Baton Rouge. The increase in population was so large that Baton Rouge became
the largest city in the state, and many people started calling the city “New Baton Rouge”.
Before Katrina, the average price of a single-family home was $130,000. The increase in
the city’s population shifted the demand curve to the right, causing excess demand for
housing at the original price. Just before the hurricane, there were 3,600 homes listed for
sale in the city, but a week after the storm, there were only 500. The excess demand
caused fierce competition among buyers for the limited supply of homes, increasing the
price. Six months later, the average price had risen to $ 156,000 Questions
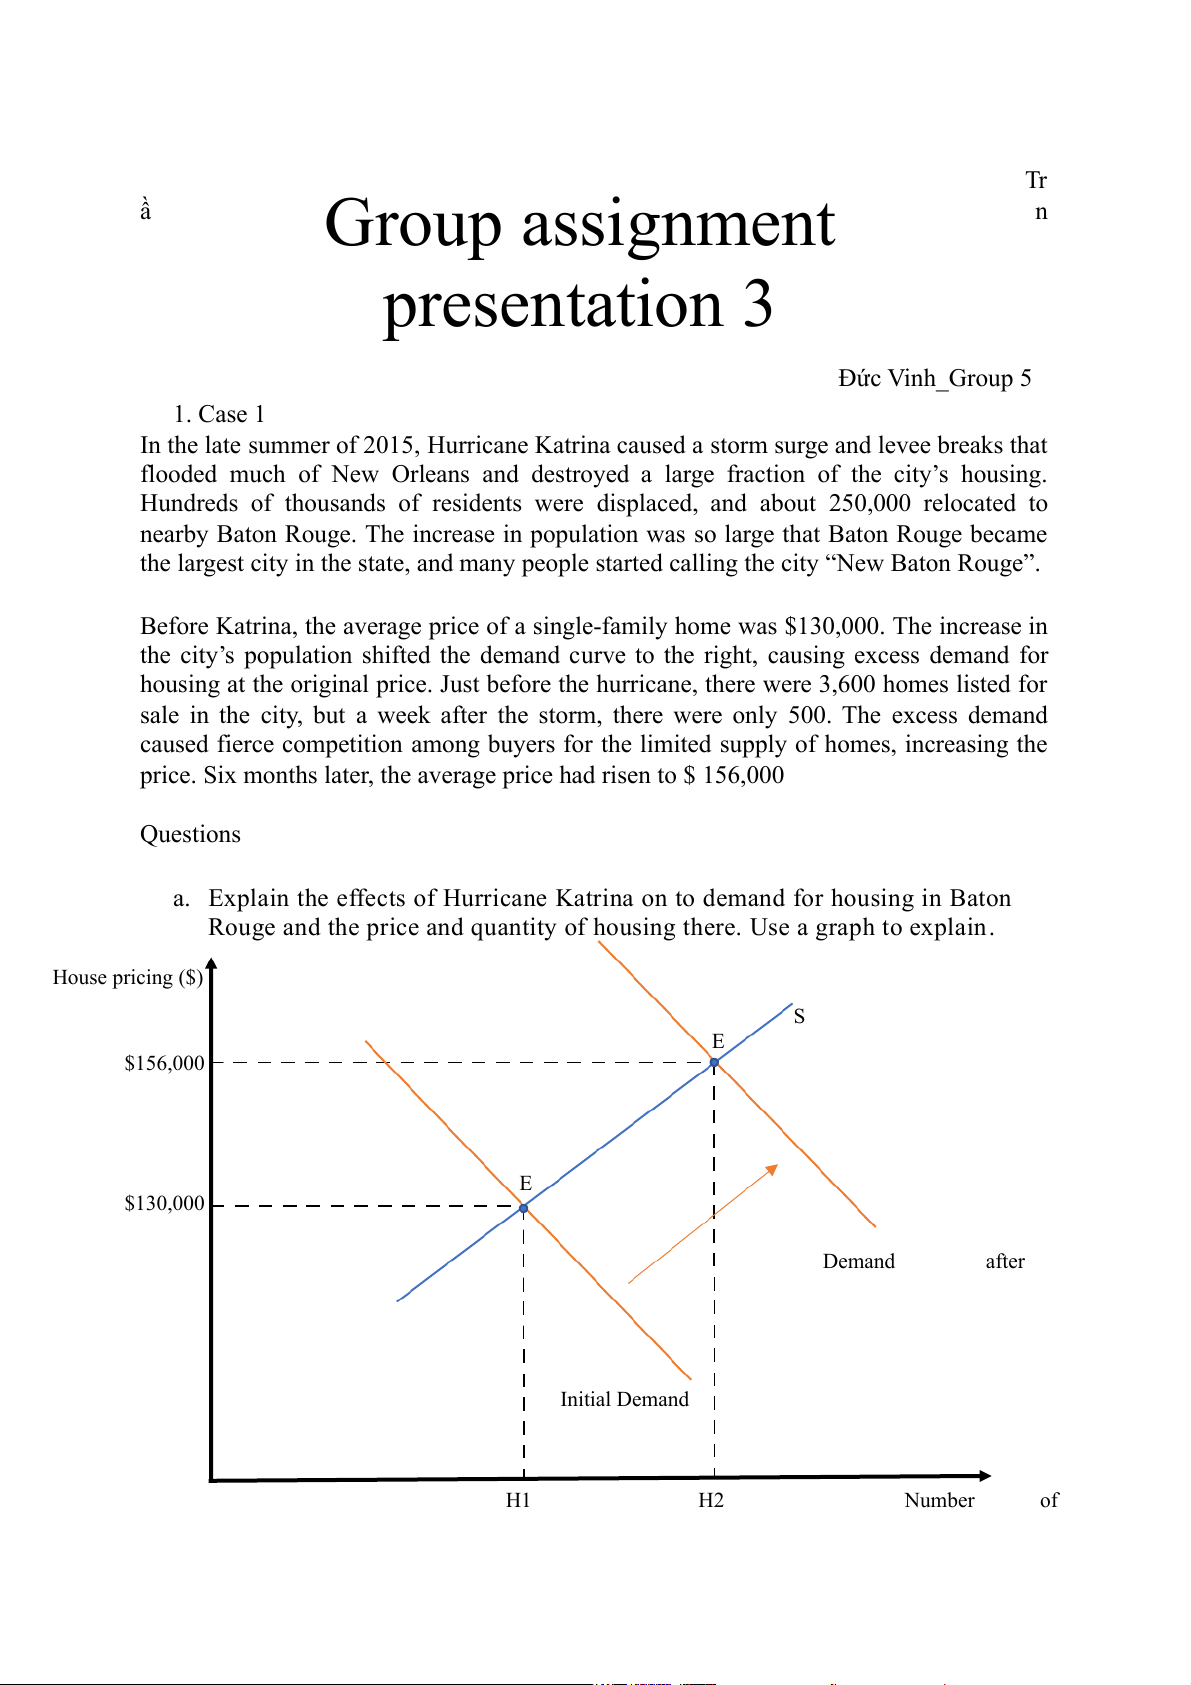
a. Explain the effects of Hurricane Katrina on to demand for housing in Baton
Rouge and the price and quantity of housing there. Use a graph to explain. House pricing ($) S E $156,000 E $130,000 Demand after Initial Demand H1 H2 Number of
Hurricane Katrina destroyed a large fraction of the city’s housing and made
the residents move to Baton Rouge. Therefore, the population increased,
and leaps followed the increase in housing demand, so the demand curve shifted to the right.
By relocating a massive amount of population, the number of homes listed
for sale quickly decreased from 3600 to 500 (that was 3100 homes
decreased) and the price, as the effect of the law of demand and supply,
soared to $26.000 (from $130.000 to $156.000) just in six months
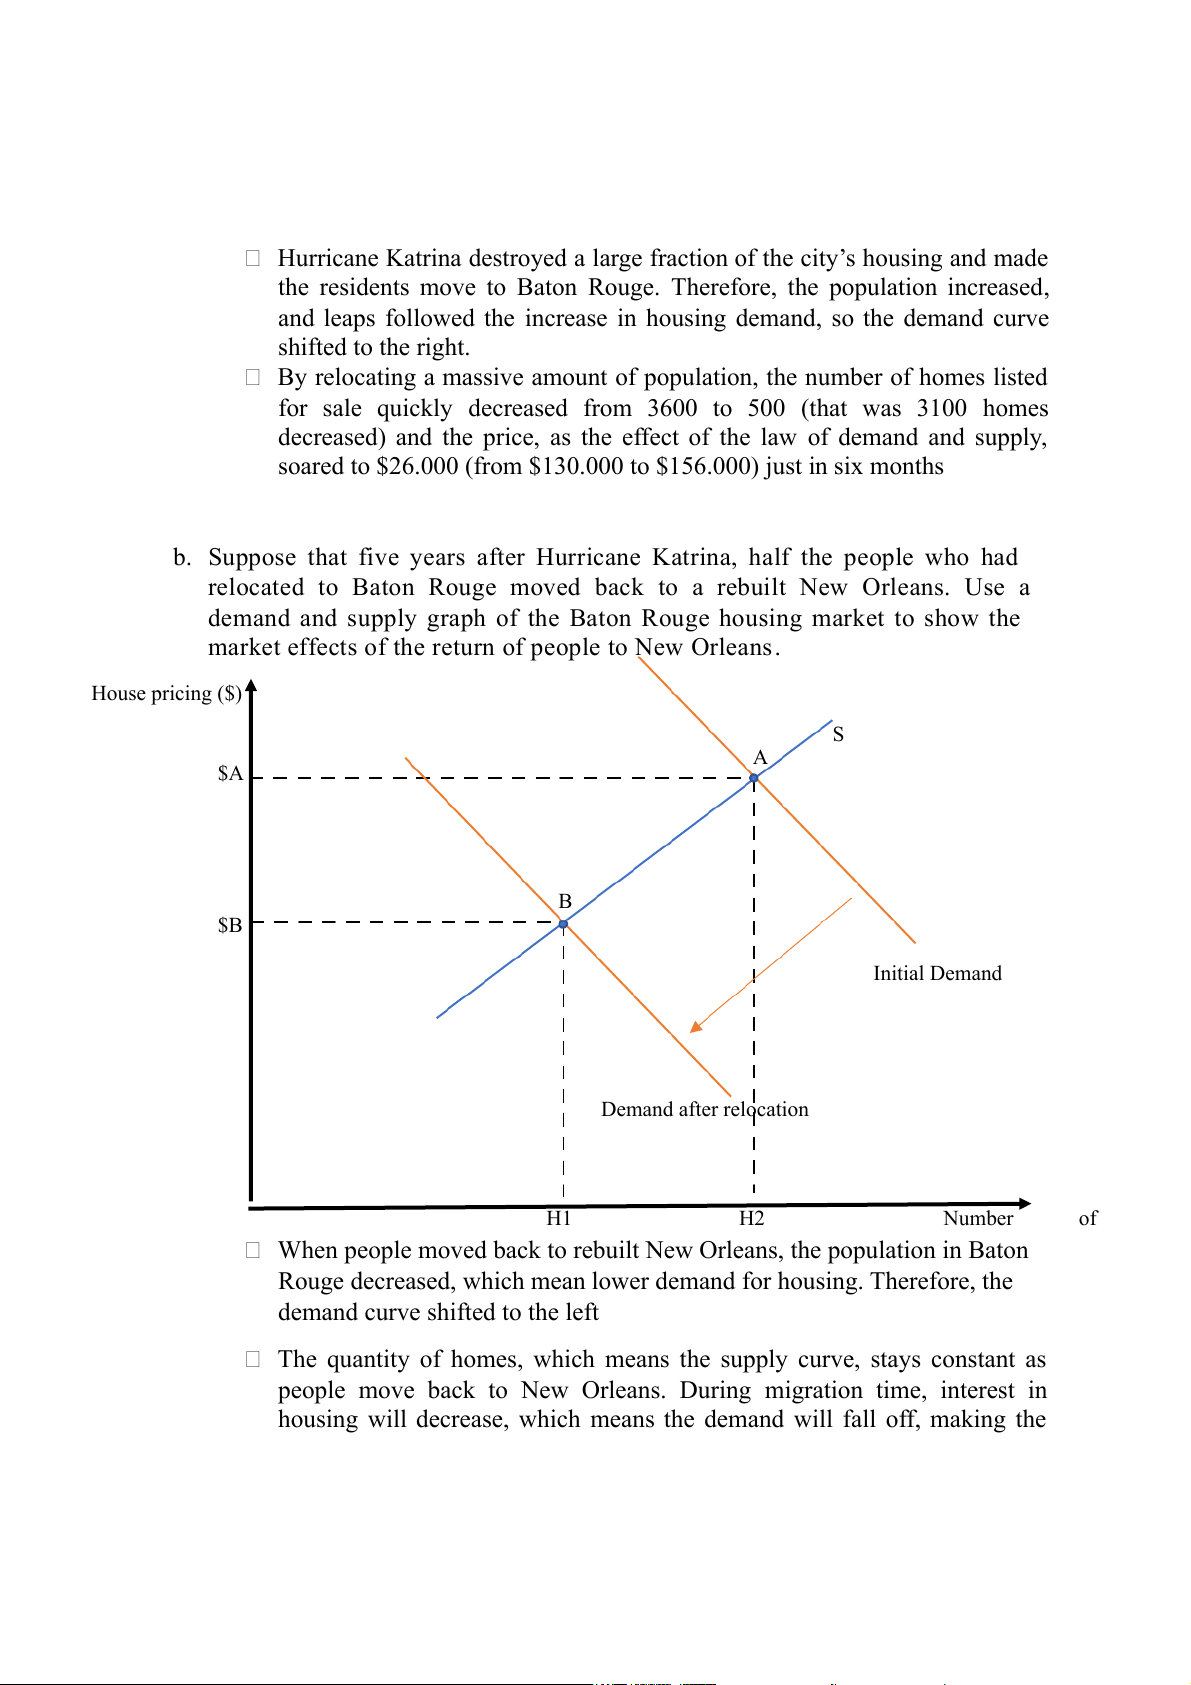
b. Suppose that five years after Hurricane Katrina, half the people who had
relocated to Baton Rouge moved back to a rebuilt New Orleans. Use a
demand and supply graph of the Baton Rouge housing market to show the
market effects of the return of people to New Orleans. House pricing ($) S A $A B $B Initial Demand Demand after relocation H1 H2 Number of
When people moved back to rebuilt New Orleans, the population in Baton
Rouge decreased, which mean lower demand for housing. Therefore, the
demand curve shifted to the left
The quantity of homes, which means the supply curve, stays constant as
people move back to New Orleans. During migration time, interest in
housing will decrease, which means the demand will fall off, making the
demand curve move to the left side. And certainly, the house’s price will diminish from $A to $B. 2. Case 2
In the last few years, thousands of honeybee colonies have vanished due to bee colony
collapse disorder (CCD). Roughly one-third of the US food supply- including a wide
variety of fruits, vegetables, and nuts- depends on pollination from bees. The decline of
honeybees threatens $ 15 billion worth of crops in the US. The decrease in pollination by
bees has decreased the supply of strawberries, raspberries, and almost, leading to higher
prices for these ingredients for ice cream. The higher price for berries and nuts have
increased the cost of producing food products, such as ice cream, increasing their prices as well. Questions
Draw graphs to show the effects of the decline of the bee population on the
market for ice cream and explain that effects. Ice cream pricing S’ S E’ P2 E P1 D D’ B2 B1 Bee
The decline of the bee population on the market in the US prompts the
reduction of fruit and the ingredients of ice cream, leading to the shift of the
supply curve to the left, which means a decrease in supply.
Because of the scarcity of fruit to make an ingredient for ice cream, the
price of it unavoidably increases, making the demand curve shift to the left,
which means a decrease in demand.
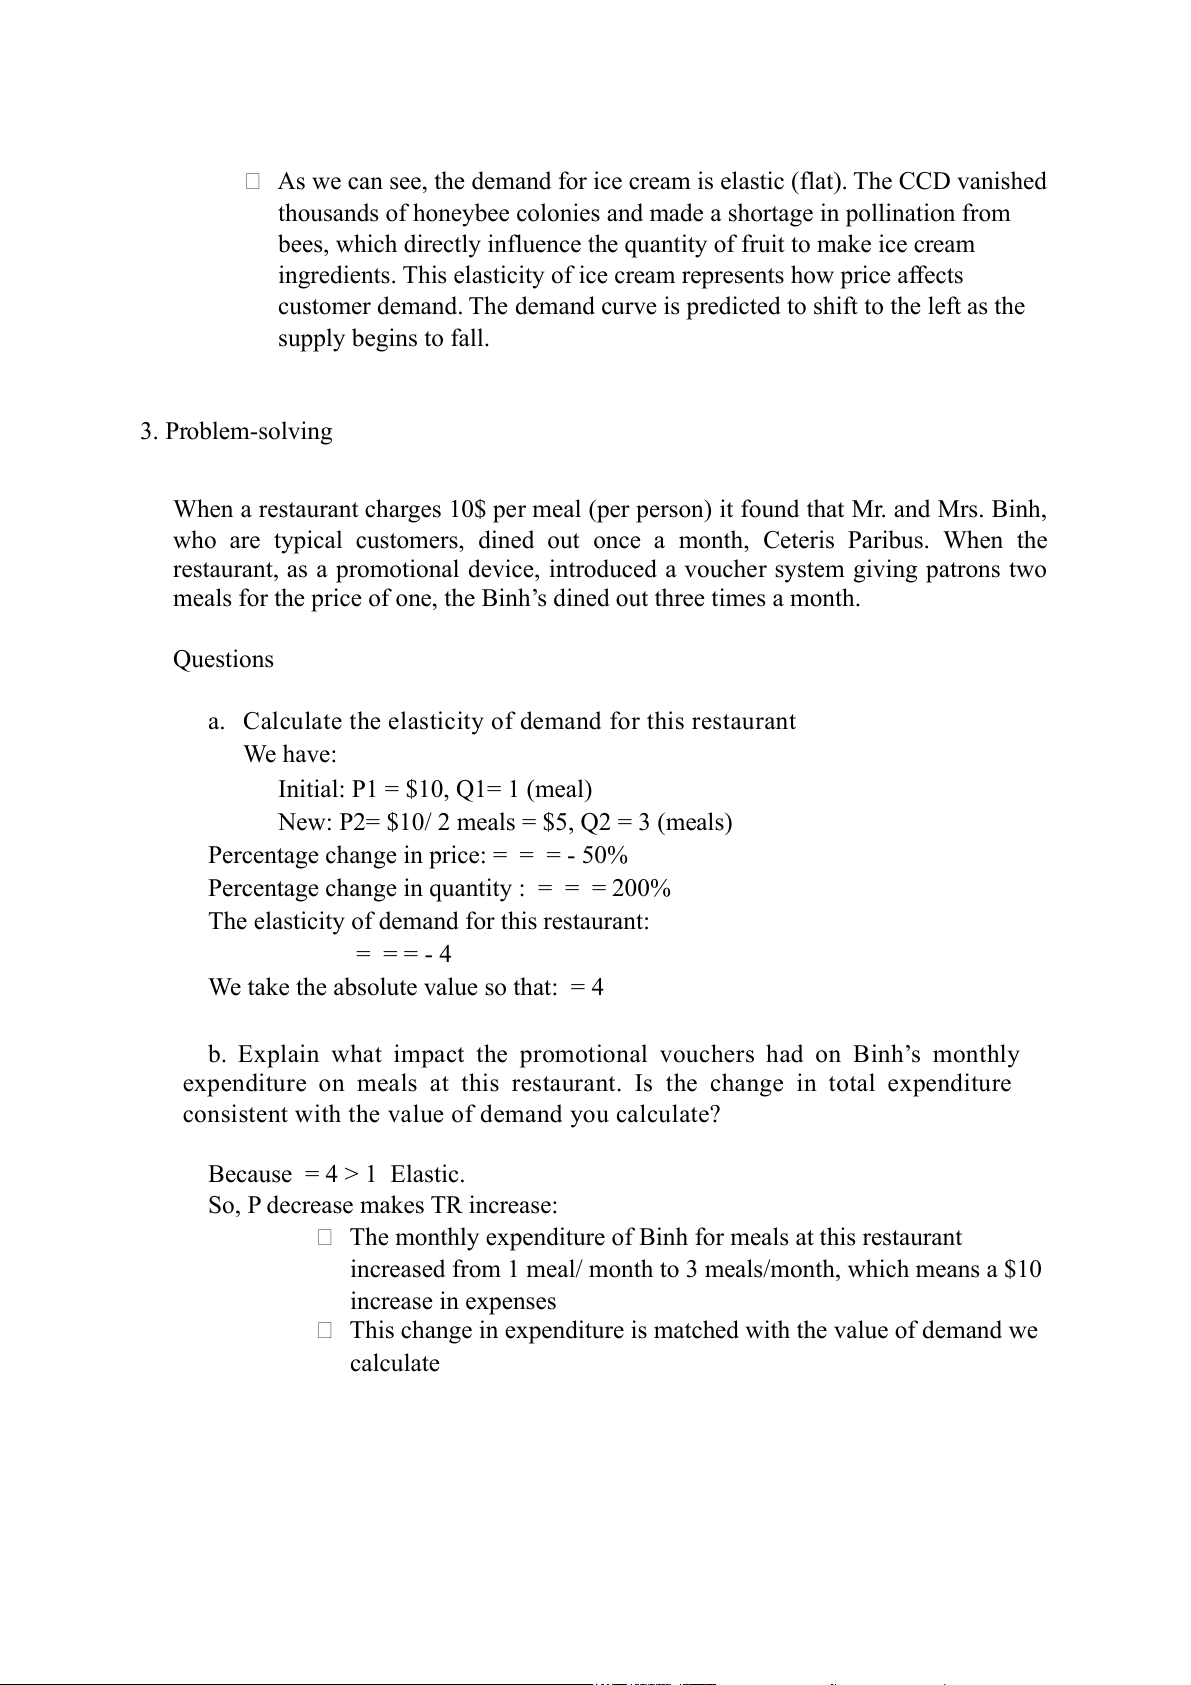
As we can see, the demand for ice cream is elastic (flat). The CCD vanished
thousands of honeybee colonies and made a shortage in pollination from
bees, which directly influence the quantity of fruit to make ice cream
ingredients. This elasticity of ice cream represents how price affects
customer demand. The demand curve is predicted to shift to the left as the supply begins to fall. 3. Problem-solving
When a restaurant charges 10$ per meal (per person) it found that Mr. and Mrs. Binh,
who are typical customers, dined out once a month, Ceteris Paribus. When the
restaurant, as a promotional device, introduced a voucher system giving patrons two
meals for the price of one, the Binh’s dined out three times a month. Questions
a. Calculate the elasticity of demand for this restaurant We have:
Initial: P1 = $10, Q1= 1 (meal)
New: P2= $10/ 2 meals = $5, Q2 = 3 (meals)
Percentage change in price: = = = - 50%
Percentage change in quantity : = = = 200%
The elasticity of demand for this restaurant: = = = - 4
We take the absolute value so that: = 4
b. Explain what impact the promotional vouchers had on Binh’s monthly
expenditure on meals at this restaurant. Is the change in total expenditure
consistent with the value of demand you calculate? Because = 4 > 1 Elastic.
So, P decrease makes TR increase:
The monthly expenditure of Binh for meals at this restaurant
increased from 1 meal/ month to 3 meals/month, which means a $10 increase in expenses
This change in expenditure is matched with the value of demand we calculate
Tài liệu liên quan:
-

Chương 3: độ co giãn và các nhân tố ảnh hưởng | Microeconomics | Trường Đại học Quốc tế, Đại học Quốc gia Thành phố Hồ Chí Minh
3 2 -

Microeconomics Syllabus | Microeconomics | Trường Đại học Quốc tế, Đại học Quốc gia Thành phố Hồ Chí Minh
3 2 -

Microeconomics Course Syllabus & Assessment Details | Microeconomics | Trường Đại học Quốc tế, Đại học Quốc gia Thành phố Hồ Chí Minh
3 2 -

Assignment 3 - Elasticity MCQs and Key Concepts | Microeconomics | Trường Đại học Quốc tế, Đại học Quốc gia Thành phố Hồ Chí Minh
3 2 -

Assignment 2 - Economic Equilibrium Analysis of Fridges and Motorcycles | Microeconomics | Trường Đại học Quốc tế, Đại học Quốc gia Thành phố Hồ Chí Minh
3 2