Group Assignment Presentation on Market Dynamics Post-Katrina | Microeconomics | Trường Đại học Quốc tế, Đại học Quốc gia Thành phố Hồ Chí Minh
Suppose that five years after Hurricane Katrina, half the people who had relocated to Baton Rouge move back to a rebuilt New Orleans, the population in Baton Rouge will decline, and so do the quantity demanded. As a result, house pricing will decrease (From $A to $B). Tài liệu được sưu tầm và soạn thảo dưới dạng file PDF để gửi tới các bạn cùng tham khảo, ôn tập đầy đủ kiến thức, chuẩn bị cho các buổi học thật tốt. Mời bạn đọc đón xem!
Môn: Microeconomics 635 tài liệu
Trường: Trường Đại học Quốc tế, Đại học Quốc gia Thành phố Hồ Chí Minh 1.9 K tài liệu
Tác giả:
Preview text:
Group assignment presentation 3 Case 1: a. -
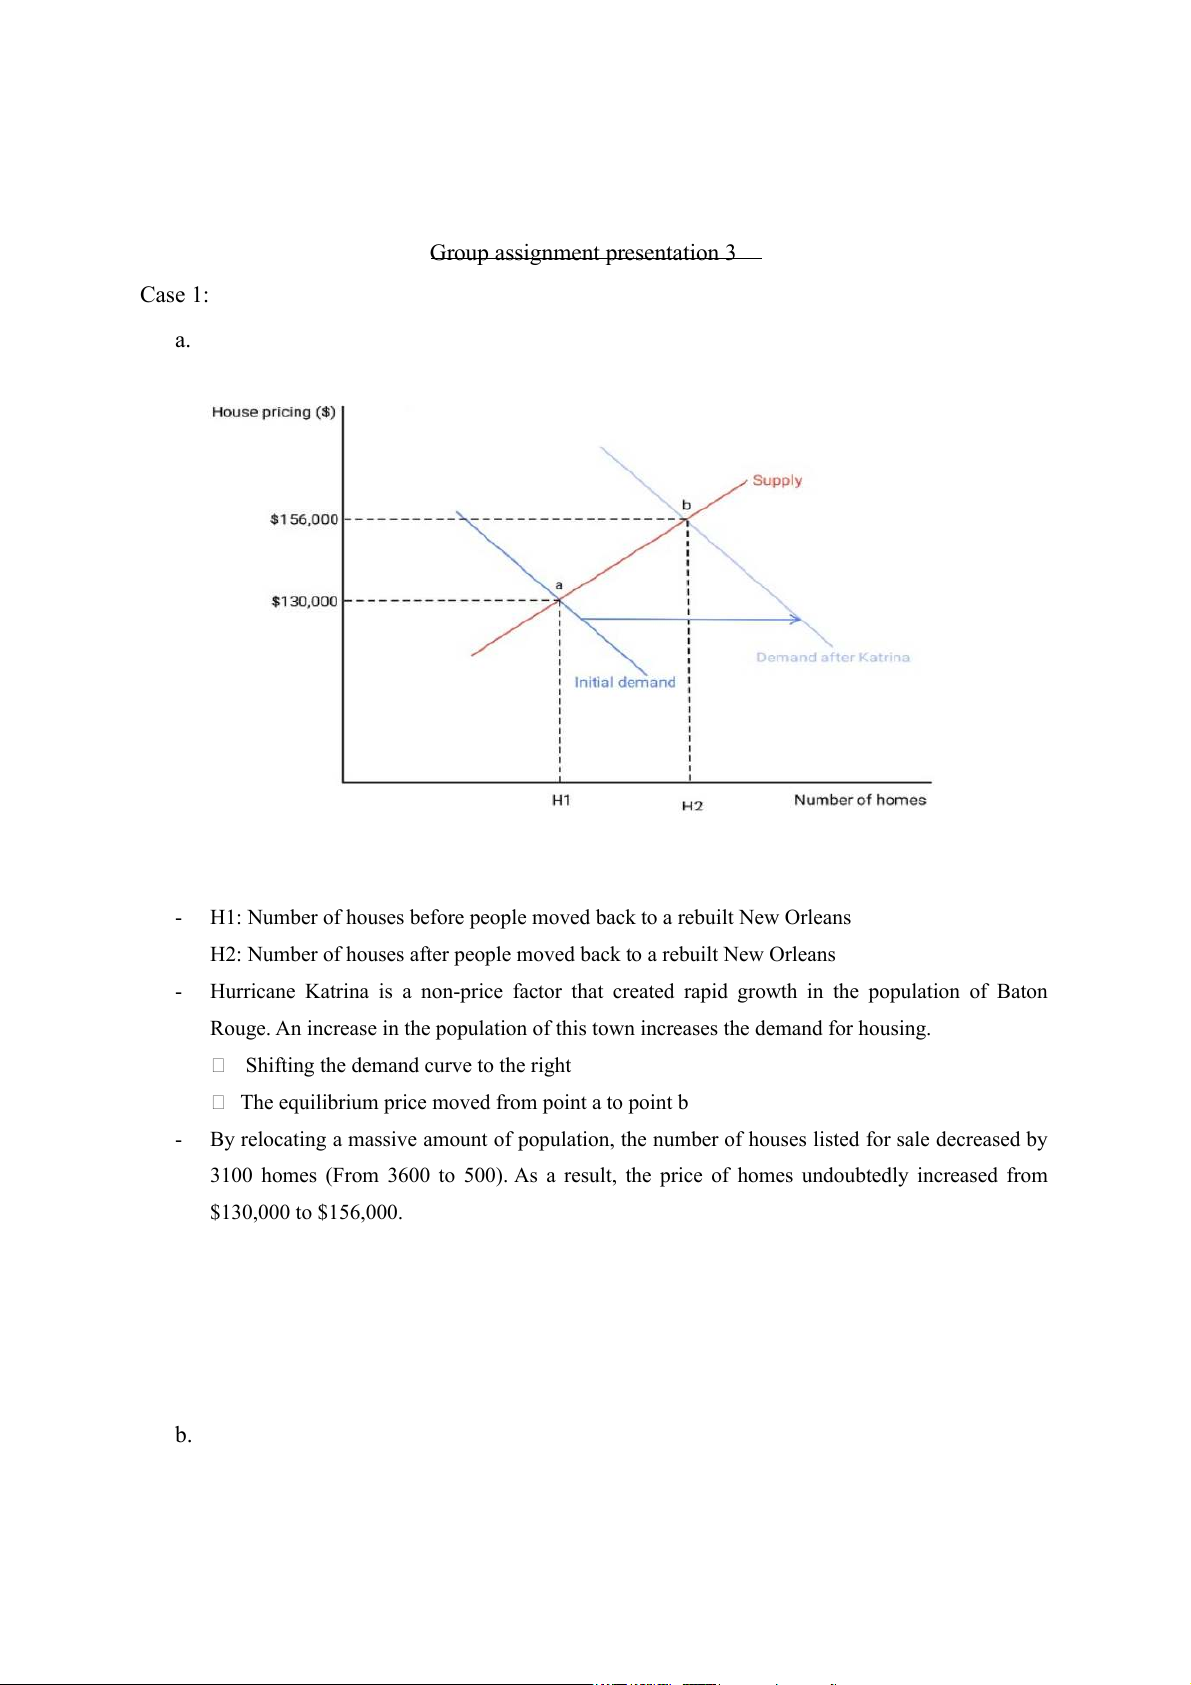
H1: Number of houses before people moved back to a rebuilt New Orleans
H2: Number of houses after people moved back to a rebuilt New Orleans -
Hurricane Katrina is a non-price factor that created rapid growth in the population of Baton
Rouge. An increase in the population of this town increases the demand for housing.
Shifting the demand curve to the right
The equilibrium price moved from point a to point b -
By relocating a massive amount of population, the number of houses listed for sale decreased by
3100 homes (From 3600 to 500). As a result, the price of homes undoubtedly increased from $130,000 to $156,000. b. -
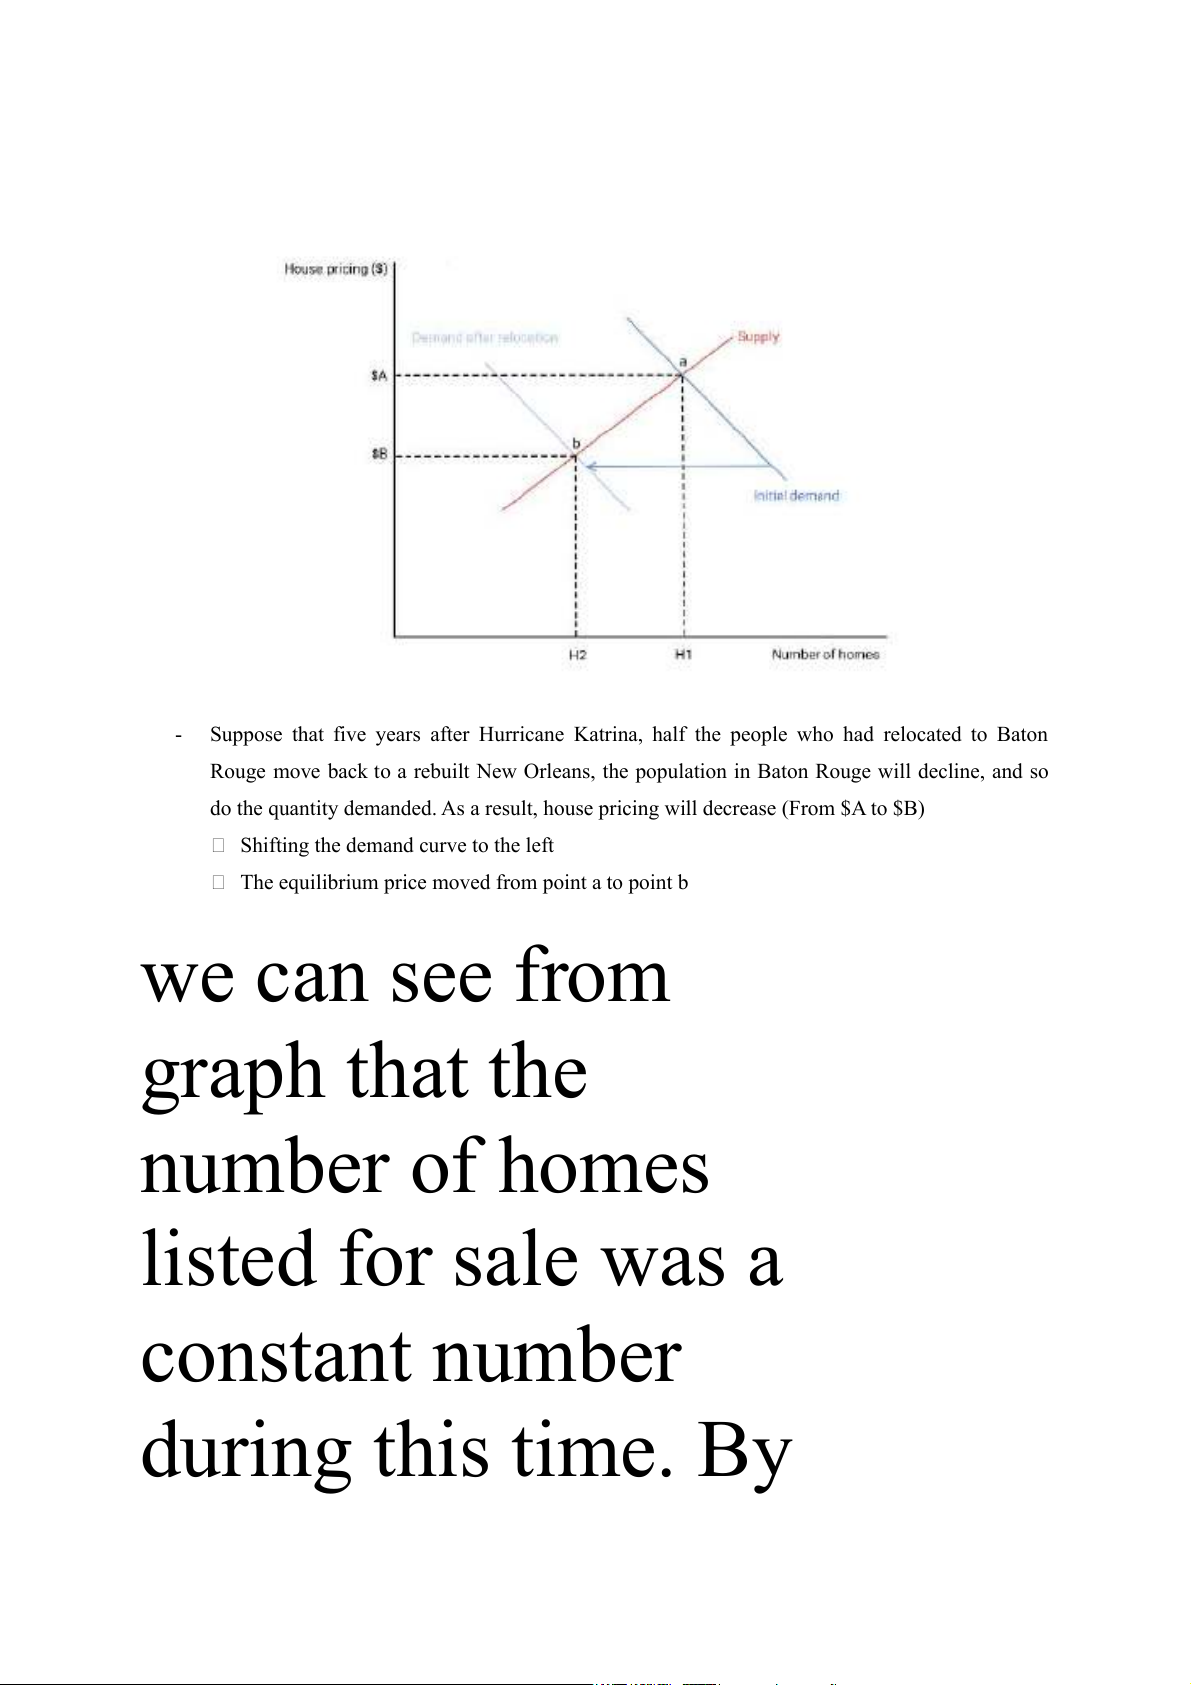
Suppose that five years after Hurricane Katrina, half the people who had relocated to Baton
Rouge move back to a rebuilt New Orleans, the population in Baton Rouge will decline, and so
do the quantity demanded. As a result, house pricing will decrease (From $A to $B)
Shifting the demand curve to the left
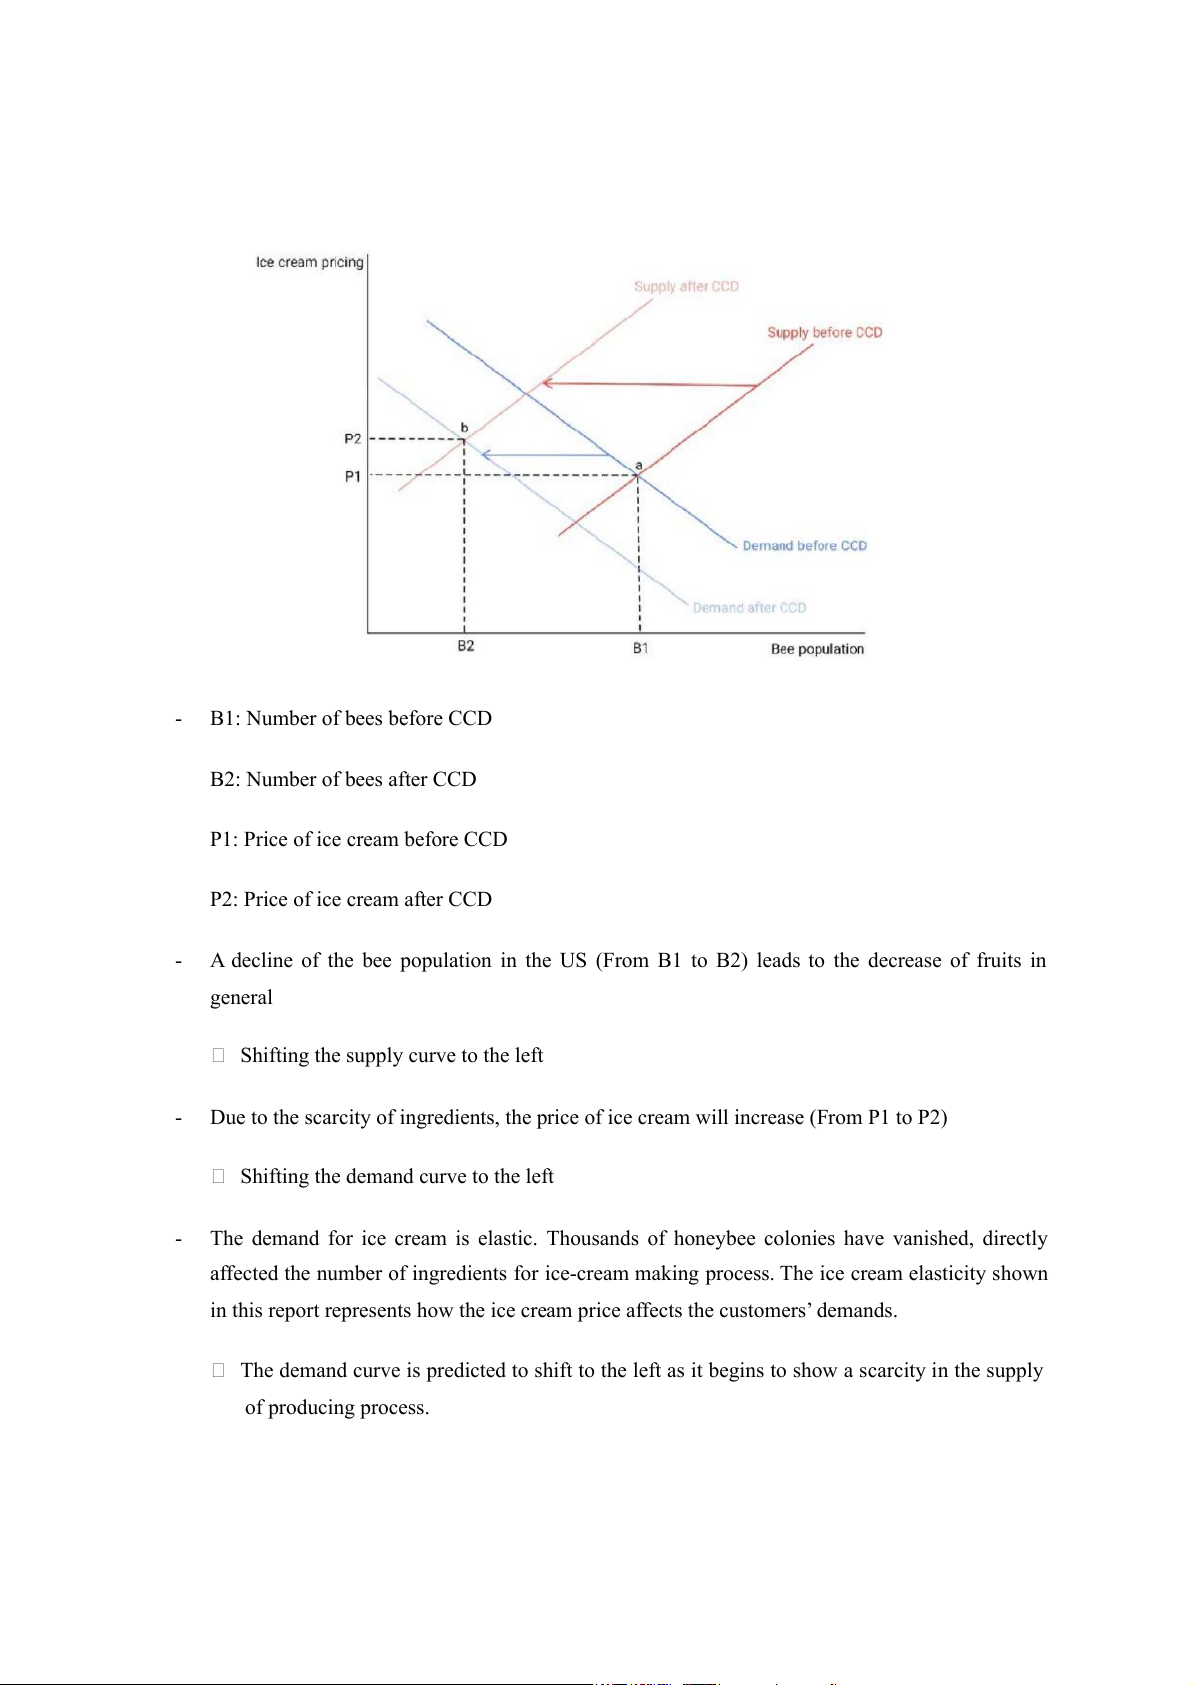
The equilibrium price moved from point a to point b we can see from graph that the number of homes listed for sale was a constant number during this time. By relocating a massive amount of population, this number quickly decreased by 3,100 homes (From 3,600 to 500). Along with the scarcity in the number of “living places”, the price undoubtedly increased to $16,000 (From $130,000 to $ 156,000) just in six months we can see from graph that the number of homes listed for sale was a constant number during this time. By relocating a massive amount of population, this number quickly decreased by 3,100 homes (From 3,600 to 500). Along with the scarcity in the number of “living places”, the price undoubtedly increased to $16,000 (From $130,000 to $ 156,000) just in six months Case 2: - B1: Number of bees before CCD B2: Number of bees after CCD
P1: Price of ice cream before CCD
P2: Price of ice cream after CCD -
A decline of the bee population in the US (From B1 to B2) leads to the decrease of fruits in general
Shifting the supply curve to the left -
Due to the scarcity of ingredients, the price of ice cream will increase (From P1 to P2)
Shifting the demand curve to the left -
The demand for ice cream is elastic. Thousands of honeybee colonies have vanished, directly
affected the number of ingredients for ice-cream making process. The ice cream elasticity shown
in this report represents how the ice cream price affects the customers’ demands.
The demand curve is predicted to shift to the left as it begins to show a scarcity in the supply of producing process.
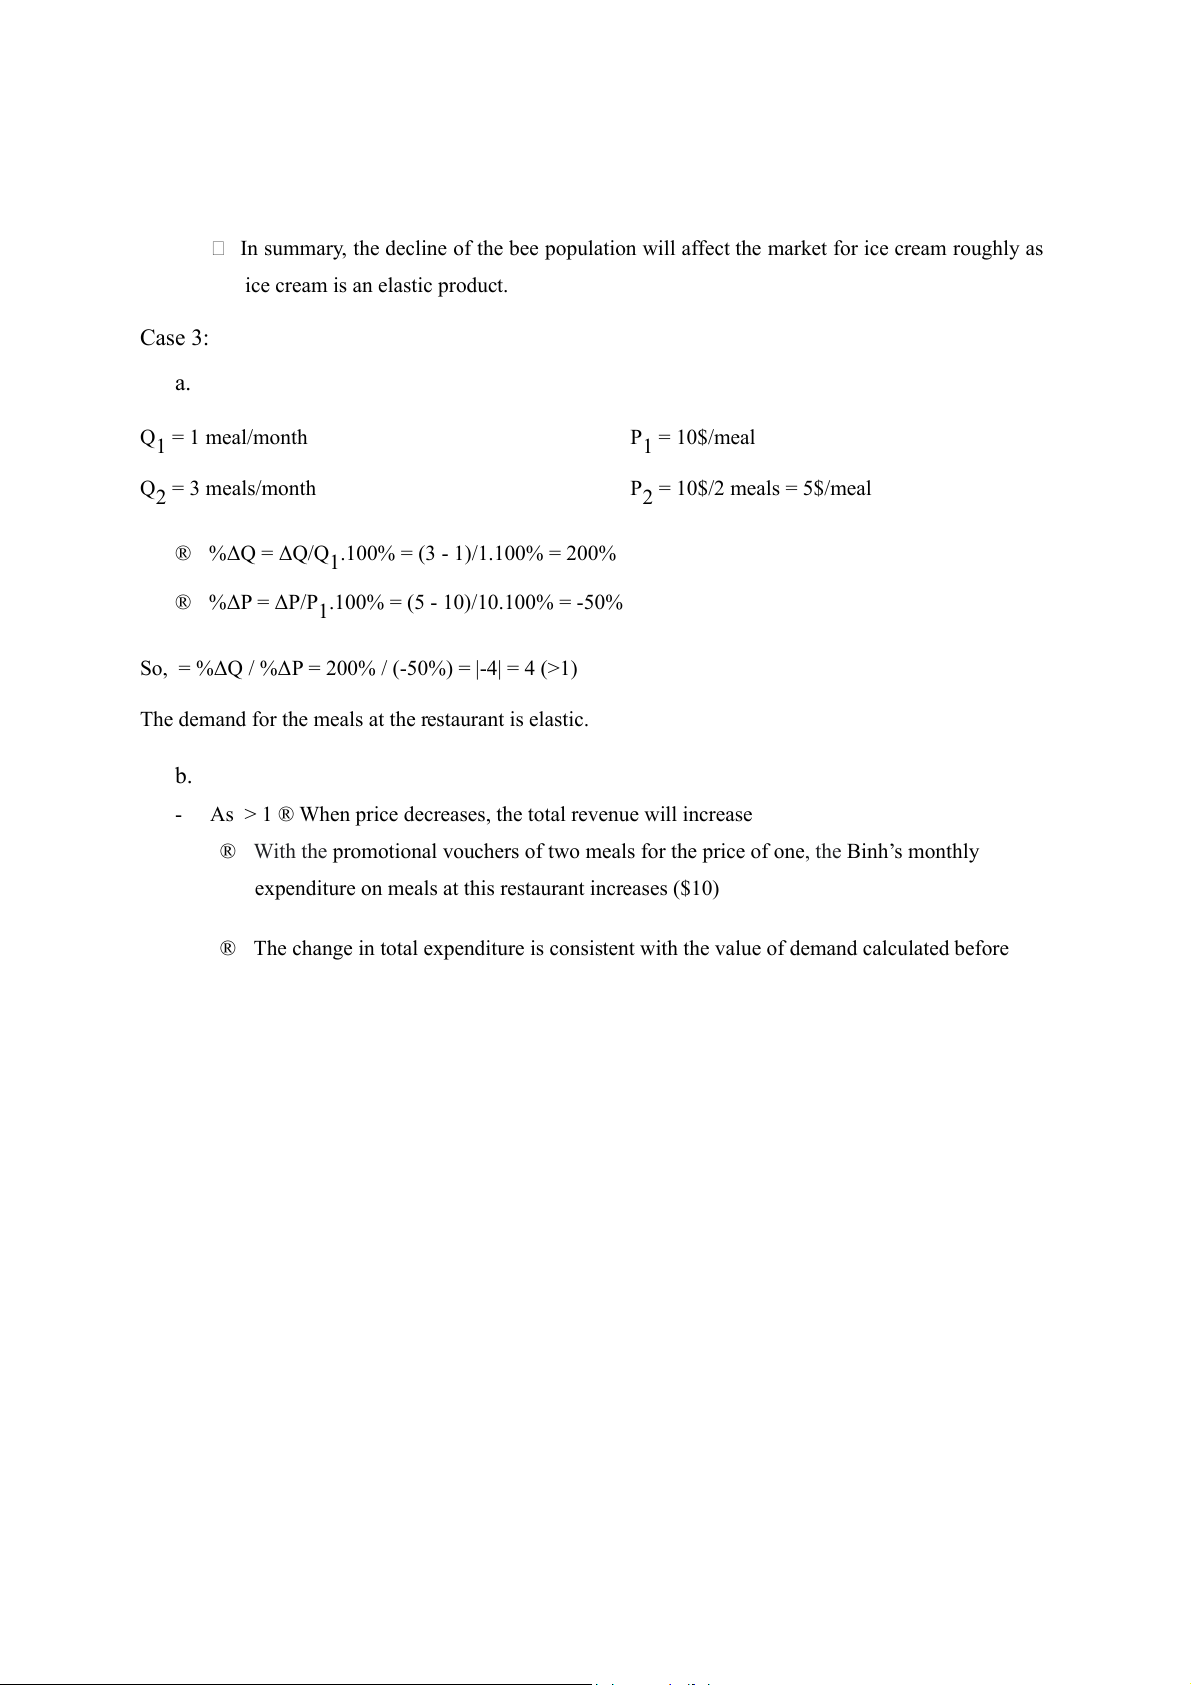
In summary, the decline of the bee population will affect the market for ice cream roughly as
ice cream is an elastic product. Case 3: a. Q1 = 1 meal/month P1 = 10$/meal Q2 = 3 meals/month P2 = 10$/2 meals = 5$/meal
® %ΔQ = ΔQ/Q .100% = (3 - 1)/1.100% = 200% 1
® %ΔP = ΔP/P .100% = (5 - 10)/10.100% = -50% 1
So, = %ΔQ / %ΔP = 200% / (-50%) = |-4| = 4 (>1)
The demand for the meals at the restaurant is elastic. b. -
As > 1 ® When price decreases, the total revenue will increase
® With the promotional vouchers of two meals for the price of one, the Binh’s monthly
expenditure on meals at this restaurant increases ($10)
® The change in total expenditure is consistent with the value of demand calculated before
Tài liệu liên quan:
-

Chương 3: độ co giãn và các nhân tố ảnh hưởng | Microeconomics | Trường Đại học Quốc tế, Đại học Quốc gia Thành phố Hồ Chí Minh
0 0 -

Microeconomics Syllabus | Microeconomics | Trường Đại học Quốc tế, Đại học Quốc gia Thành phố Hồ Chí Minh
0 0 -

Microeconomics Course Syllabus & Assessment Details | Microeconomics | Trường Đại học Quốc tế, Đại học Quốc gia Thành phố Hồ Chí Minh
0 0 -

Assignment 3 - Elasticity MCQs and Key Concepts | Microeconomics | Trường Đại học Quốc tế, Đại học Quốc gia Thành phố Hồ Chí Minh
0 0 -

Assignment 2 - Economic Equilibrium Analysis of Fridges and Motorcycles | Microeconomics | Trường Đại học Quốc tế, Đại học Quốc gia Thành phố Hồ Chí Minh
0 0