Group Presentation 3: Demand & Supply Analysis Post-Katrina | Microeconomics | Trường Đại học Quốc tế, Đại học Quốc gia Thành phố Hồ Chí Minh
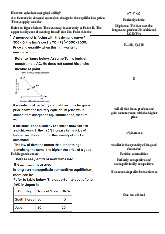
The increase in the population of Baton Rouge due to Hurricane Katrina (a non–priced factor) led to an increase in the demand for accommodation. => The housing price rose. For this reason, the demand curve has moved to the right. The equilibrium price increased from $130,000 to $156,000 (point A to B). Tài liệu được sưu tầm và soạn thảo dưới dạng file PDF để gửi tới các bạn cùng tham khảo, ôn tập đầy đủ kiến thức, chuẩn bị cho các buổi học thật tốt. Mời bạn đọc đón xem!
Môn: Microeconomics 393 tài liệu
Trường: Trường Đại học Quốc tế, Đại học Quốc gia Thành phố Hồ Chí Minh 1.7 K tài liệu
Tác giả:
Preview text:
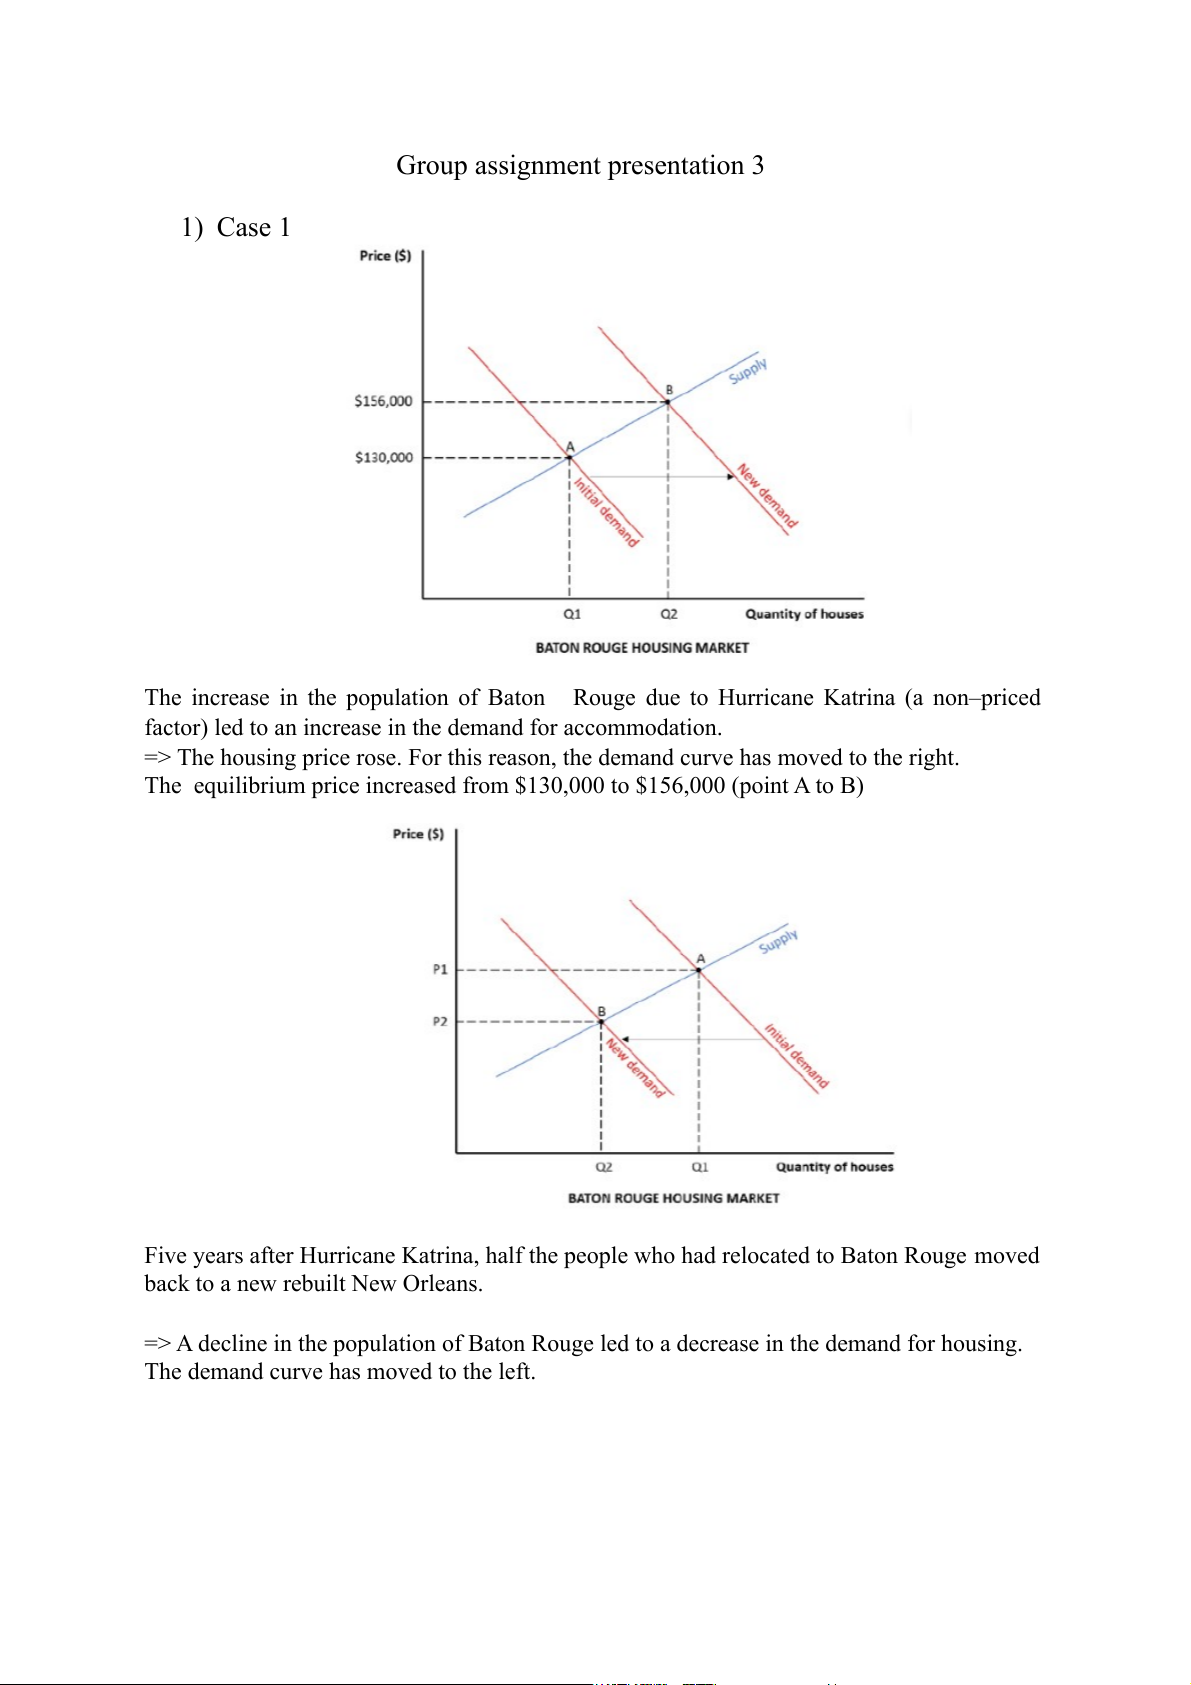
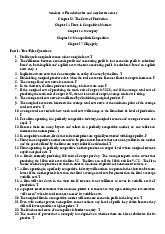
Group assignment presentation 3 1) Case 1
The increase in the population of Baton Rouge due to Hurricane Katrina (a non–priced
factor) led to an increase in the demand for accommodation.
=> The housing price rose. For this reason, the demand curve has moved to the right.
The equilibrium price increased from $130,000 to $156,000 (point A to B)
Five years after Hurricane Katrina, half the people who had relocated to Baton Rouge moved
back to a new rebuilt New Orleans.
=> A decline in the population of Baton Rouge led to a decrease in the demand for housing.
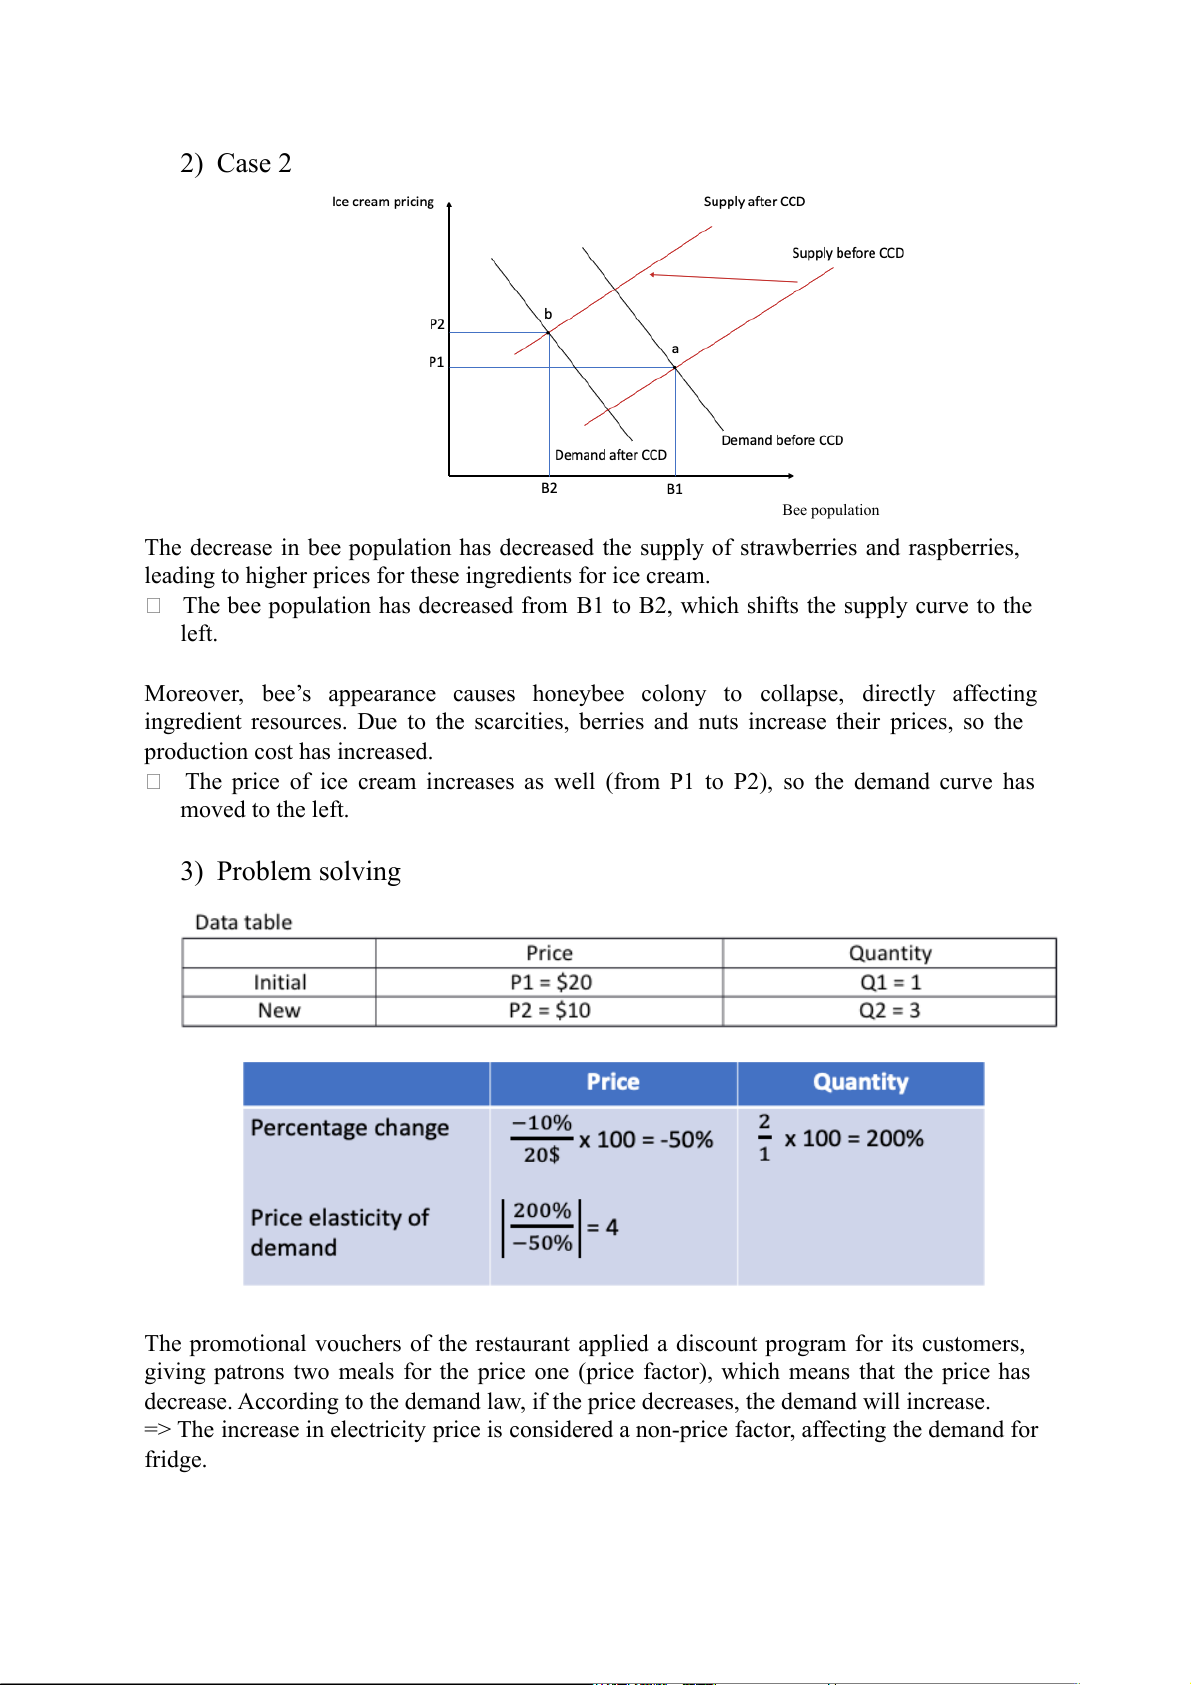
The demand curve has moved to the left. 2) Case 2 Bee population
The decrease in bee population has decreased the supply of strawberries and raspberries,
leading to higher prices for these ingredients for ice cream.
The bee population has decreased from B1 to B2, which shifts the supply curve to the left.
Moreover, bee’s appearance causes honeybee colony to collapse, directly affecting
ingredient resources. Due to the scarcities, berries and nuts increase their prices, so the
production cost has increased.
The price of ice cream increases as well (from P1 to P2), so the demand curve has moved to the left. 3) Problem solving
The promotional vouchers of the restaurant applied a discount program for its customers,
giving patrons two meals for the price one (price factor), which means that the price has
decrease. According to the demand law, if the price decreases, the demand will increase.
=> The increase in electricity price is considered a non-price factor, affecting the demand for fridge.
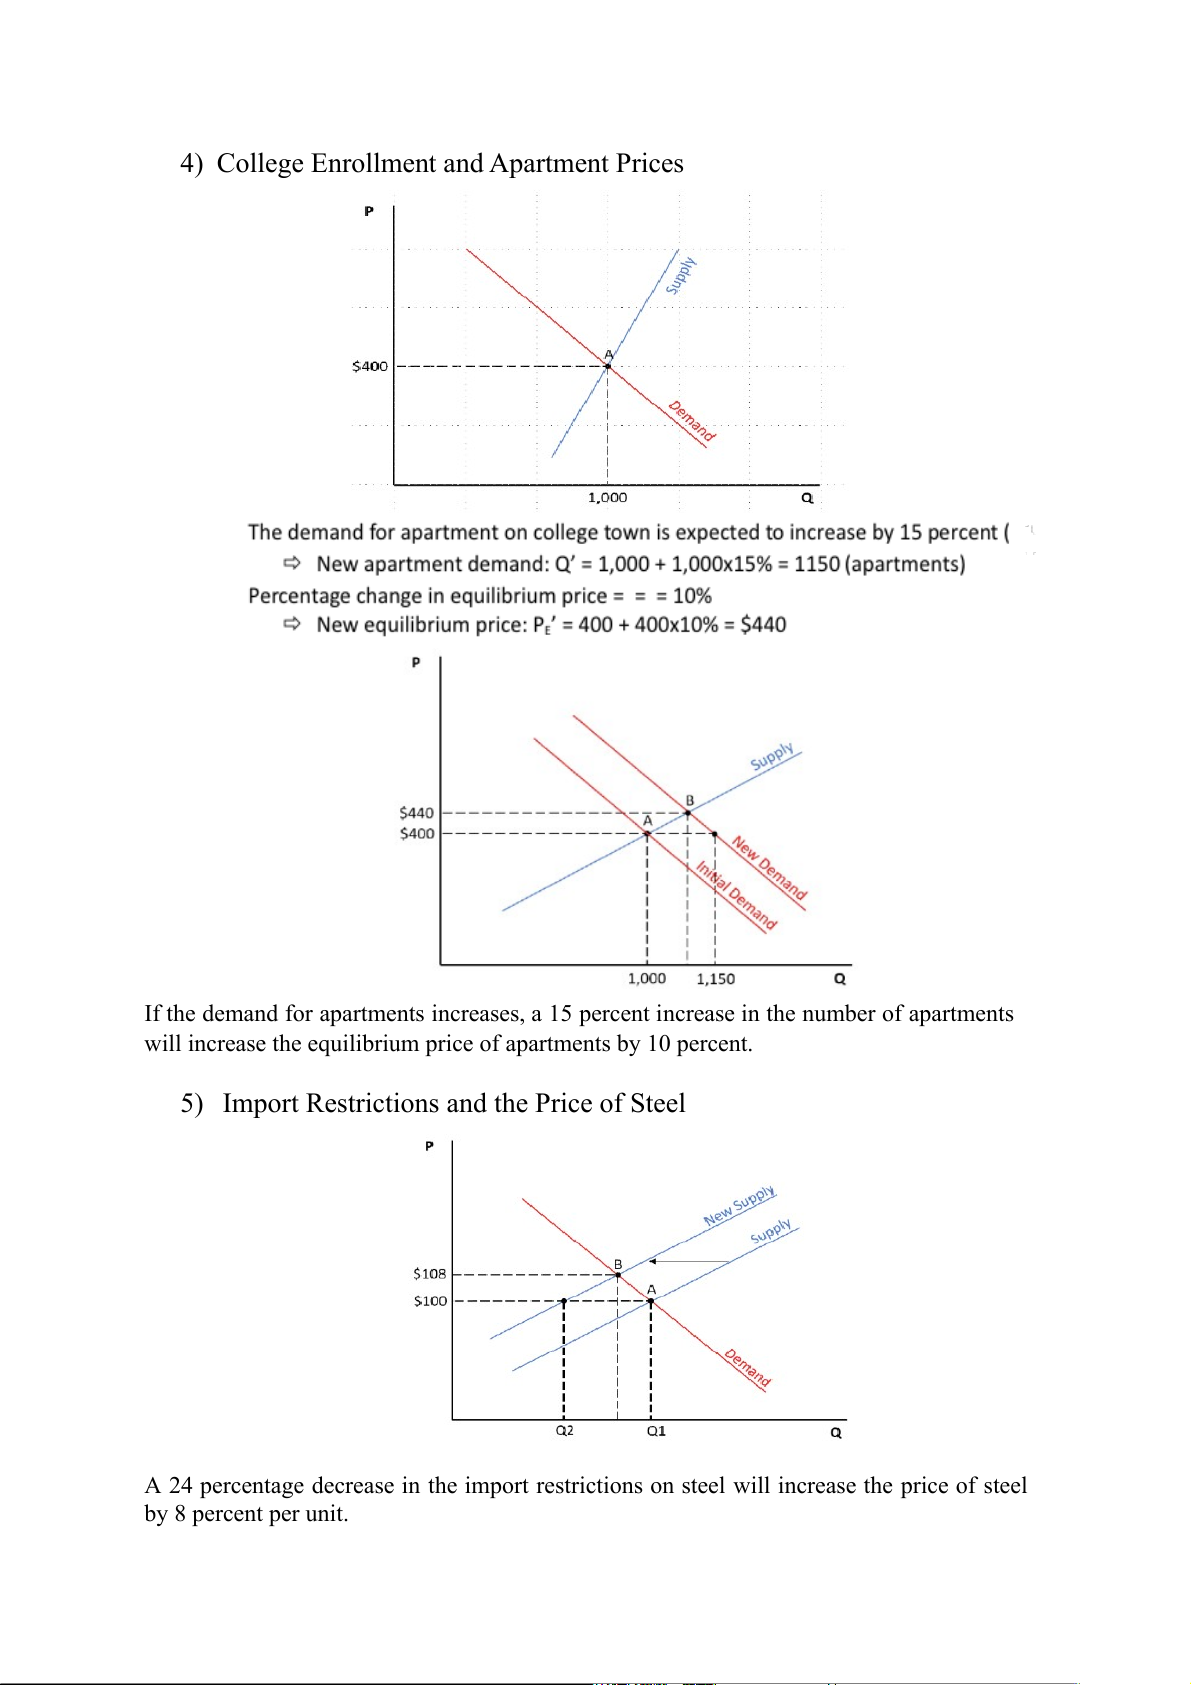
4) College Enrollment and Apartment Prices
If the demand for apartments increases, a 15 percent increase in the number of apartments
will increase the equilibrium price of apartments by 10 percent.
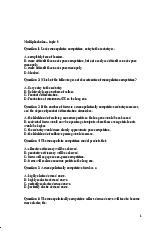
5) Import Restrictions and the Price of Steel
A 24 percentage decrease in the import restrictions on steel will increase the price of steel by 8 percent per unit.
Tài liệu liên quan:
-
Multiple Choice Questions on Monopolistic Competition and Oligopoly | Microeconomics | Trường Đại học Quốc tế, Đại học Quốc gia Thành phố Hồ Chí Minh
1 1 -
Vi mô và Tính Toán Giới Hạn Lợi Ích Cuối Kỳ | Microeconomics | Trường Đại học Quốc tế, Đại học Quốc gia Thành phố Hồ Chí Minh
1 1 -
Firm Behavior & Market Structures Exam Notes | Microeconomics | Trường Đại học Quốc tế, Đại học Quốc gia Thành phố Hồ Chí Minh
1 1 -
Monopolist & Firm Analysis Assignment | Microeconomics | Trường Đại học Quốc tế, Đại học Quốc gia Thành phố Hồ Chí Minh
1 1 -
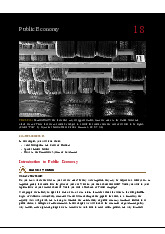
Public Economy 18: The Impact of Tariffs on Voter Participation and Policy | Microeconomics | Trường Đại học Quốc tế, Đại học Quốc gia Thành phố Hồ Chí Minh
1 1