Individual Assignment 3: Case Studies on Market Demand | Microeconomics | Trường Đại học Quốc tế, Đại học Quốc gia Thành phố Hồ Chí Minh
Hurricane Katrina destroyed a large fraction of New Orleans’s quantity of housing, which made hundreds of thousands of residents displaced and made them move to Baton Rouge. As the population of Baton Rough increased, the demand for housing in this city also increased. Therefore, the demand curve shifted to the right. Tài liệu được sưu tầm và soạn thảo dưới dạng file PDF để gửi tới các bạn cùng tham khảo, ôn tập đầy đủ kiến thức, chuẩn bị cho các buổi học thật tốt. Mời bạn đọc đón xem!
Môn: Microeconomics 635 tài liệu
Trường: Trường Đại học Quốc tế, Đại học Quốc gia Thành phố Hồ Chí Minh 1.9 K tài liệu
Tác giả:
Preview text:
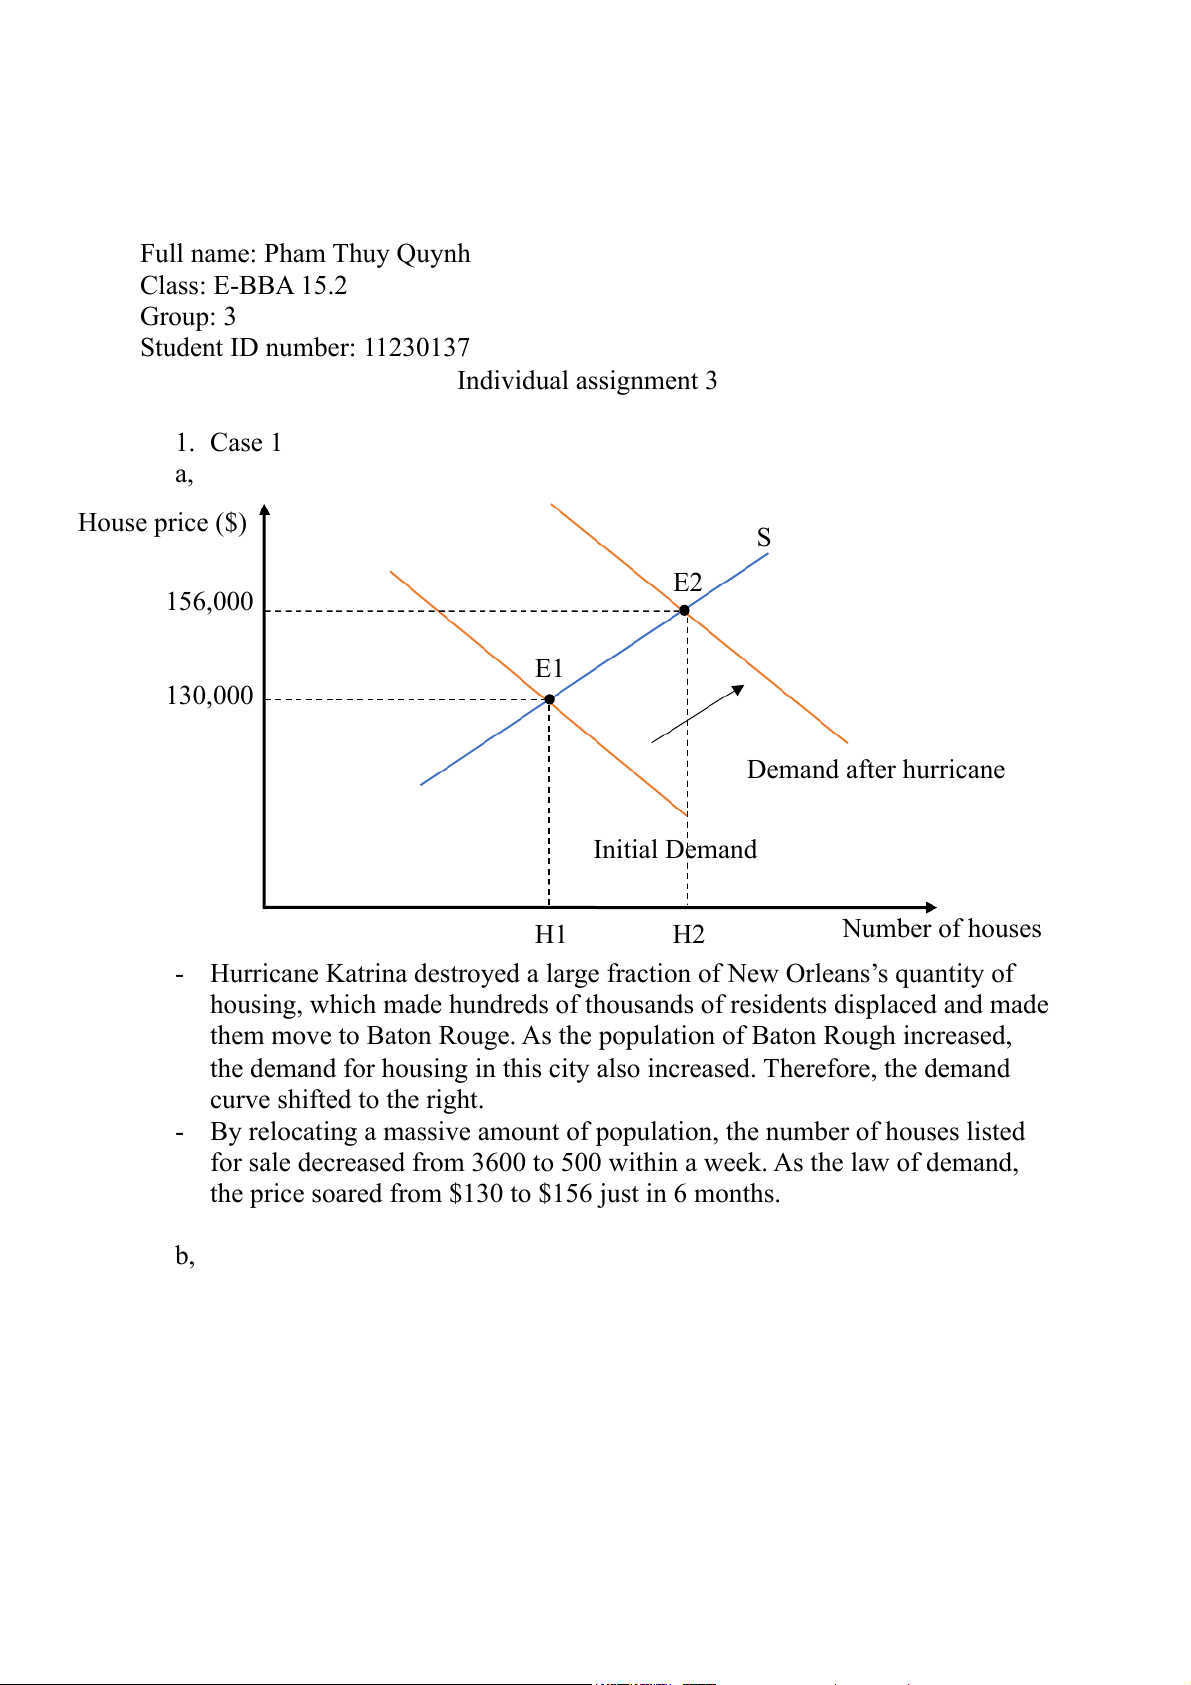
Full name: Pham Thuy Quynh Class: E-BBA 15.2 Group: 3 Student ID number: 11230137 Individual assignment 3 1. Case 1 a, House price ($) S E2 156,000 E1 130,000 Demand after hurricane Initial Demand H1 H2 Number of houses
- Hurricane Katrina destroyed a large fraction of New Orleans’s quantity of
housing, which made hundreds of thousands of residents displaced and made
them move to Baton Rouge. As the population of Baton Rough increased,
the demand for housing in this city also increased. Therefore, the demand curve shifted to the right.
- By relocating a massive amount of population, the number of houses listed
for sale decreased from 3600 to 500 within a week. As the law of demand,
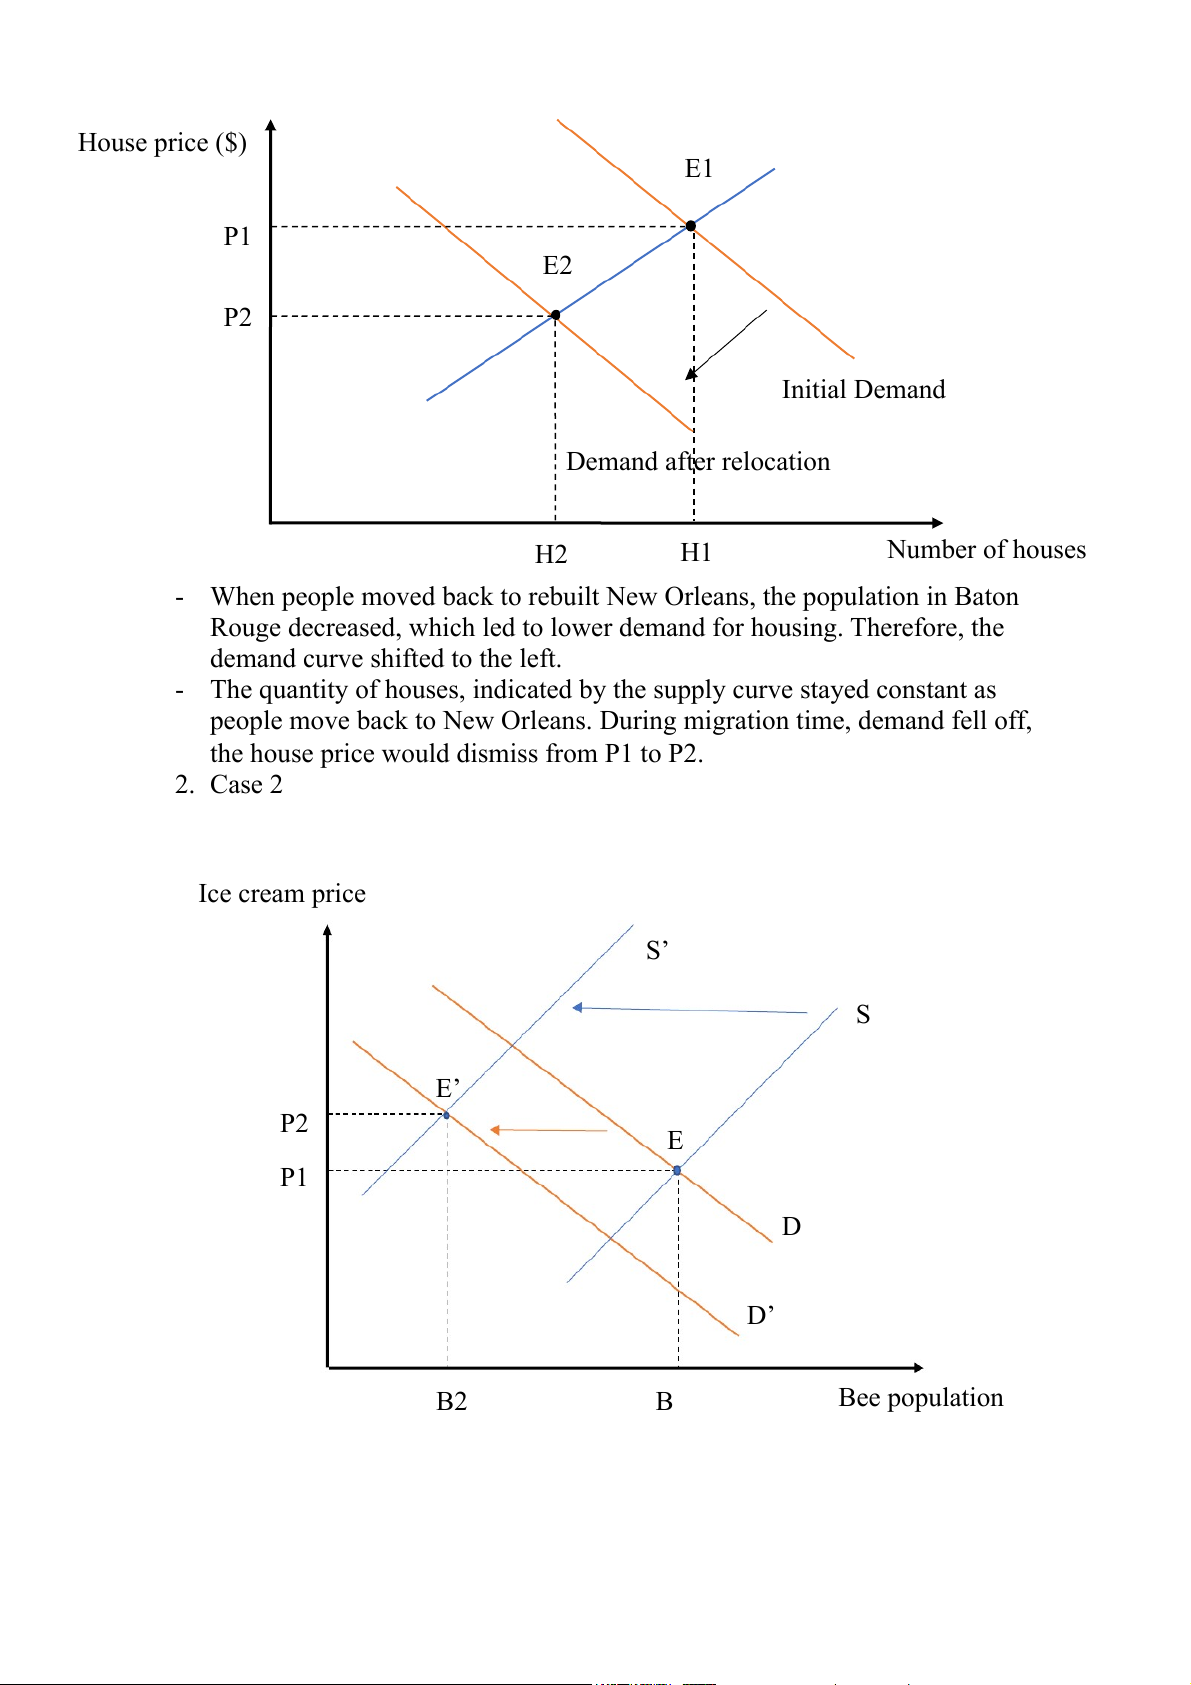
the price soared from $130 to $156 just in 6 months. b, House price ($) E1 P1 E2 P2 Initial Demand Demand after relocation H2 H1 Number of houses
- When people moved back to rebuilt New Orleans, the population in Baton
Rouge decreased, which led to lower demand for housing. Therefore, the
demand curve shifted to the left.
- The quantity of houses, indicated by the supply curve stayed constant as
people move back to New Orleans. During migration time, demand fell off,
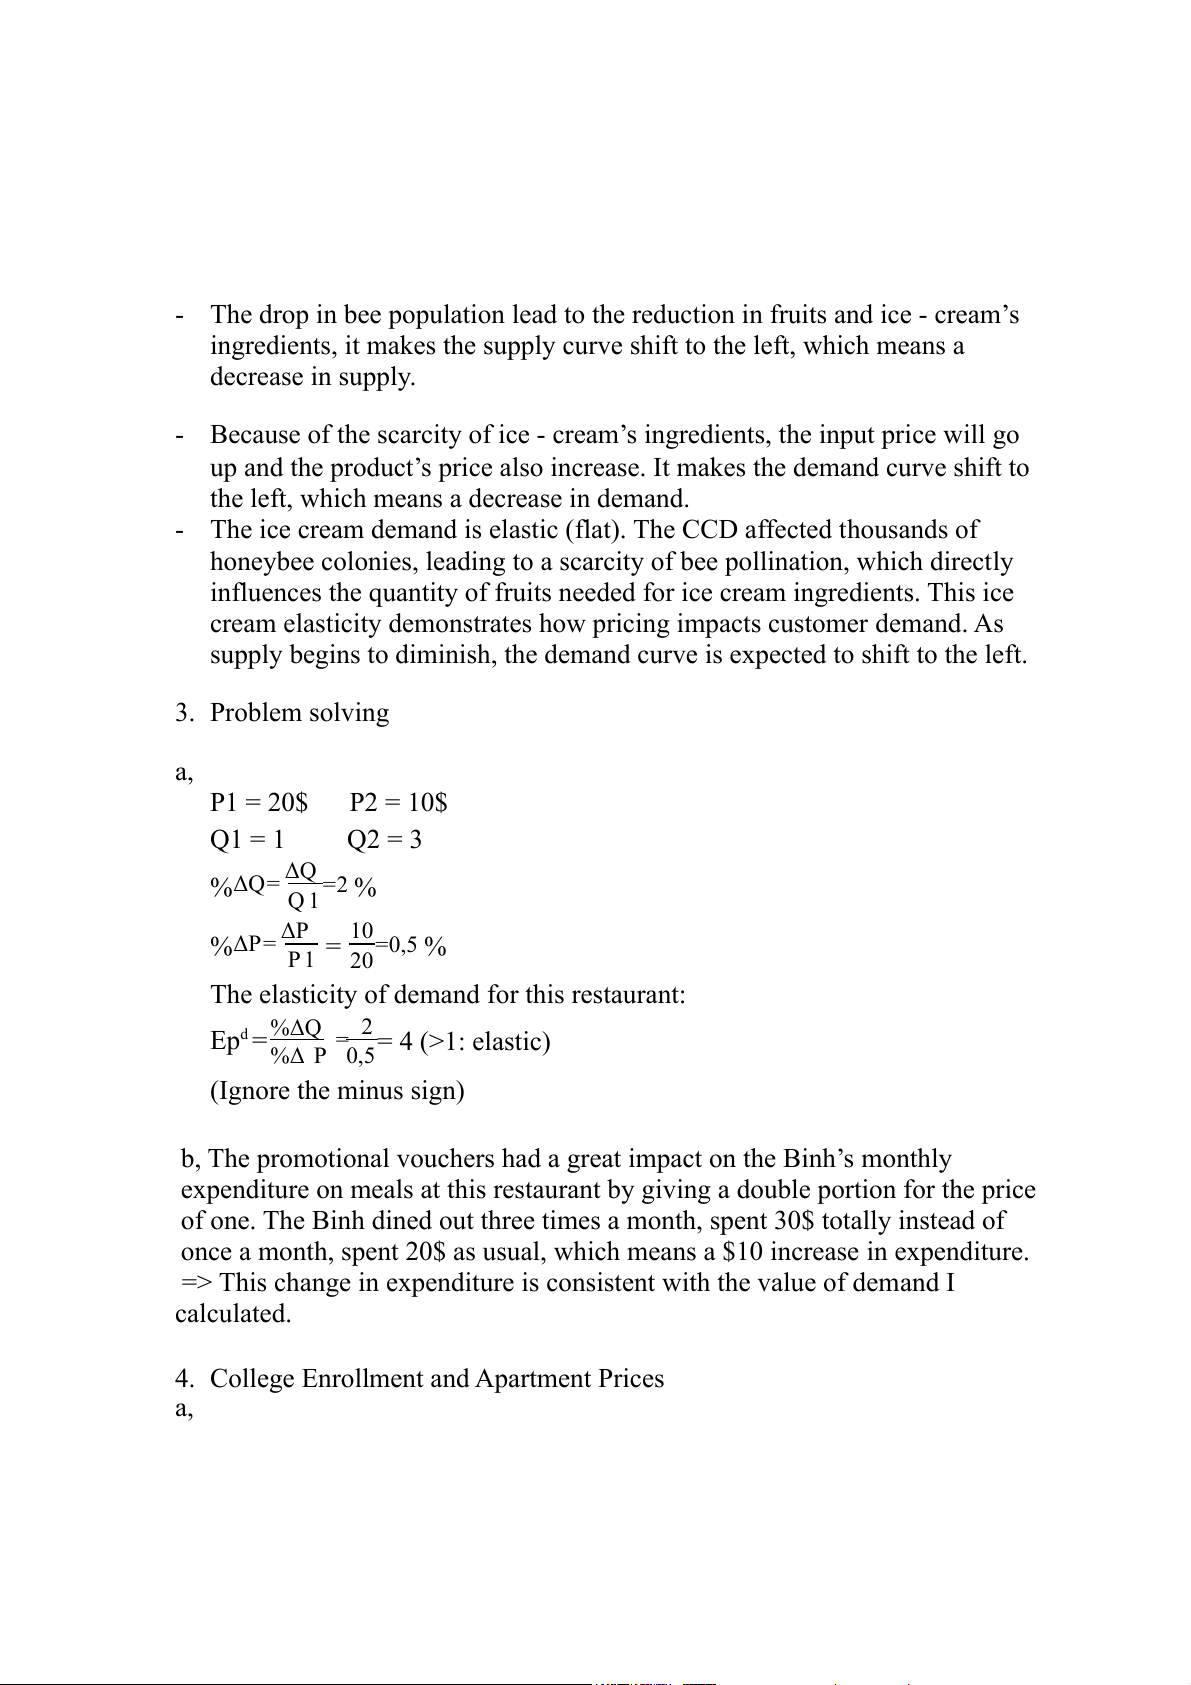
the house price would dismiss from P1 to P2. 2. Case 2 Ice cream price S’ S E’ P2 E P1 D D’ B2 B Bee population
- The drop in bee population lead to the reduction in fruits and ice - cream’s
ingredients, it makes the supply curve shift to the left, which means a decrease in supply.
- Because of the scarcity of ice - cream’s ingredients, the input price will go
up and the product’s price also increase. It makes the demand curve shift to
the left, which means a decrease in demand.
- The ice cream demand is elastic (flat). The CCD affected thousands of
honeybee colonies, leading to a scarcity of bee pollination, which directly
influences the quantity of fruits needed for ice cream ingredients. This ice
cream elasticity demonstrates how pricing impacts customer demand. As
supply begins to diminish, the demand curve is expected to shift to the left. 3. Problem solving a, P1 = 20$ P2 = 10$ Q1 = 1 Q2 = 3 ΔQ %ΔQ= =2 % Q 1 ΔP %ΔP= = 10=0,5 % P 1 20
The elasticity of demand for this restaurant: Epd =%ΔQ 2 = = 4 (>1: elastic) %Δ P 0,5 (Ignore the minus sign)
b, The promotional vouchers had a great impact on the Binh’s monthly
expenditure on meals at this restaurant by giving a double portion for the price
of one. The Binh dined out three times a month, spent 30$ totally instead of
once a month, spent 20$ as usual, which means a $10 increase in expenditure.
=> This change in expenditure is consistent with the value of demand I calculated.
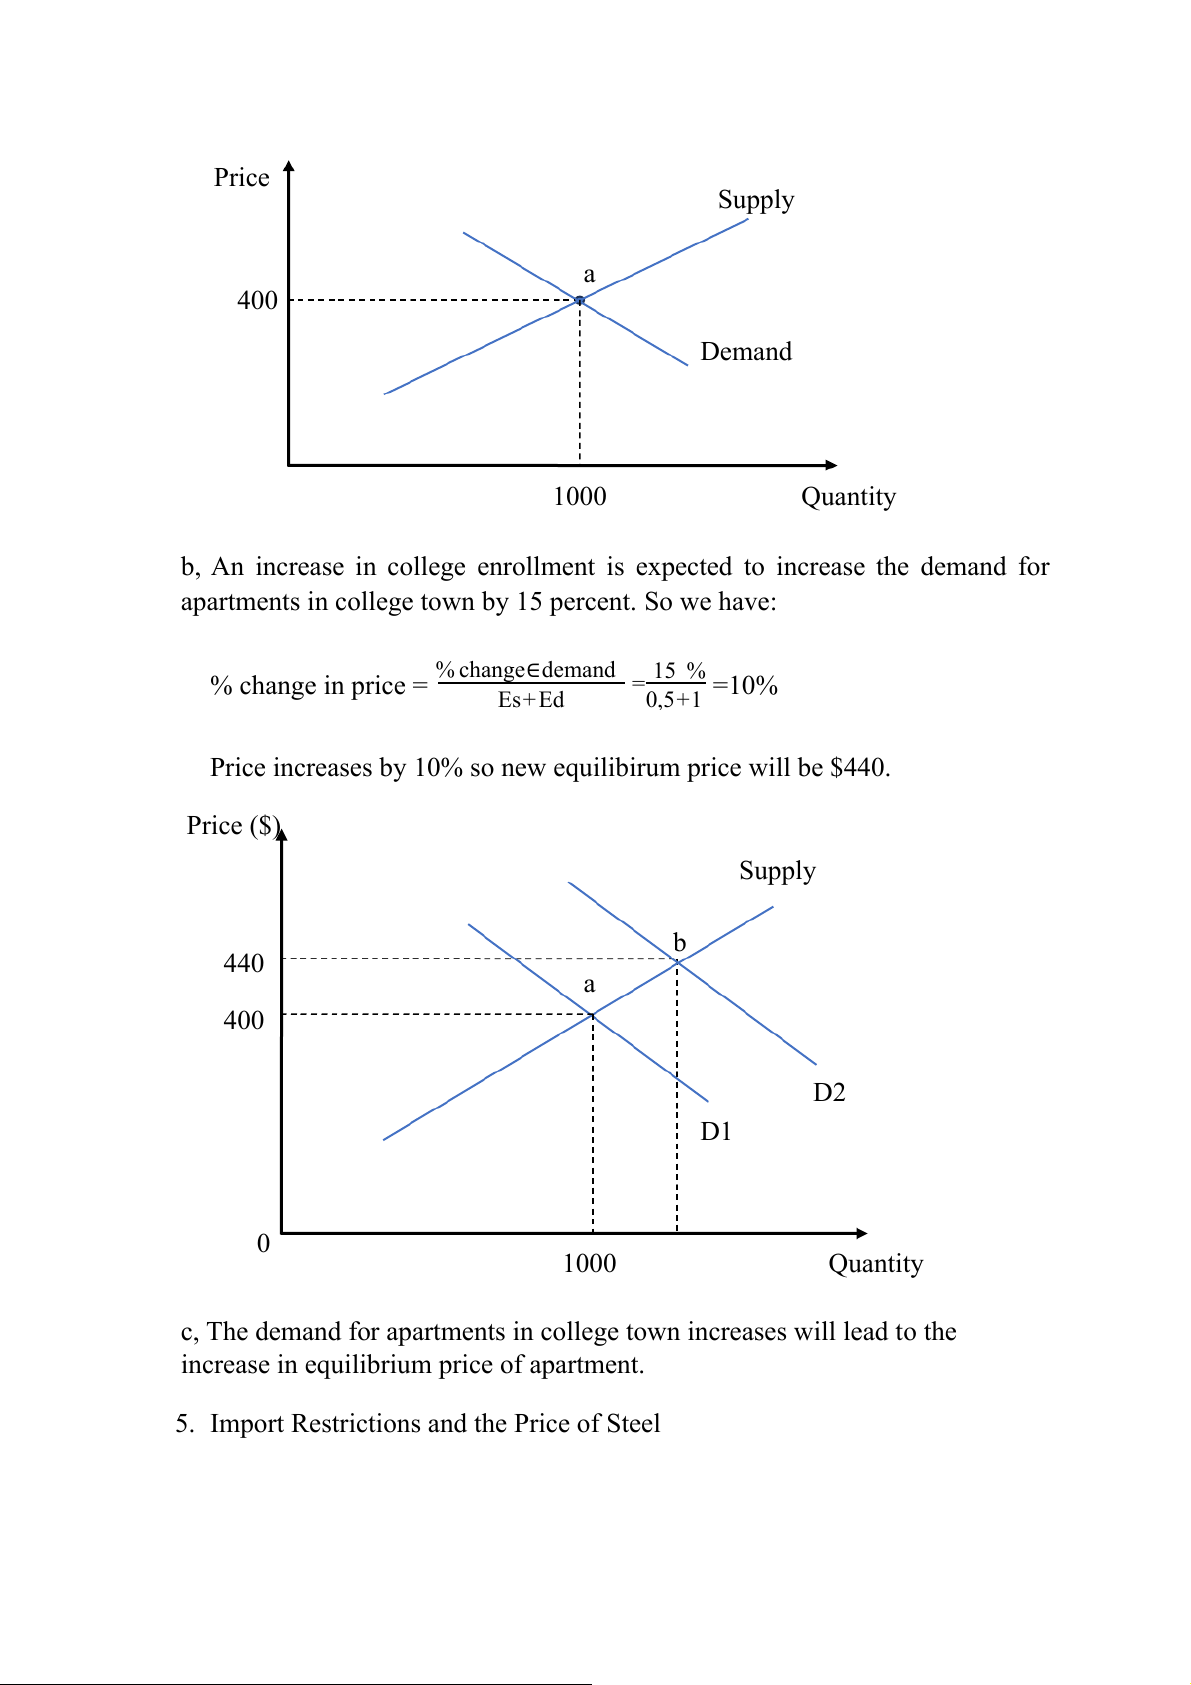
4. College Enrollment and Apartment Prices a, Price Supply a 400 Demand 1000 Quantity
b, An increase in college enrollment is expected to increase the demand for
apartments in college town by 15 percent. So we have: % change∈demand 15 % % change in price = = =10% Es+Ed 0,5+1
Price increases by 10% so new equilibirum price will be $440. Price ($) Supply b 440 a 400 D2 D1 0 1000 Quantity
c, The demand for apartments in college town increases will lead to the
increase in equilibrium price of apartment.
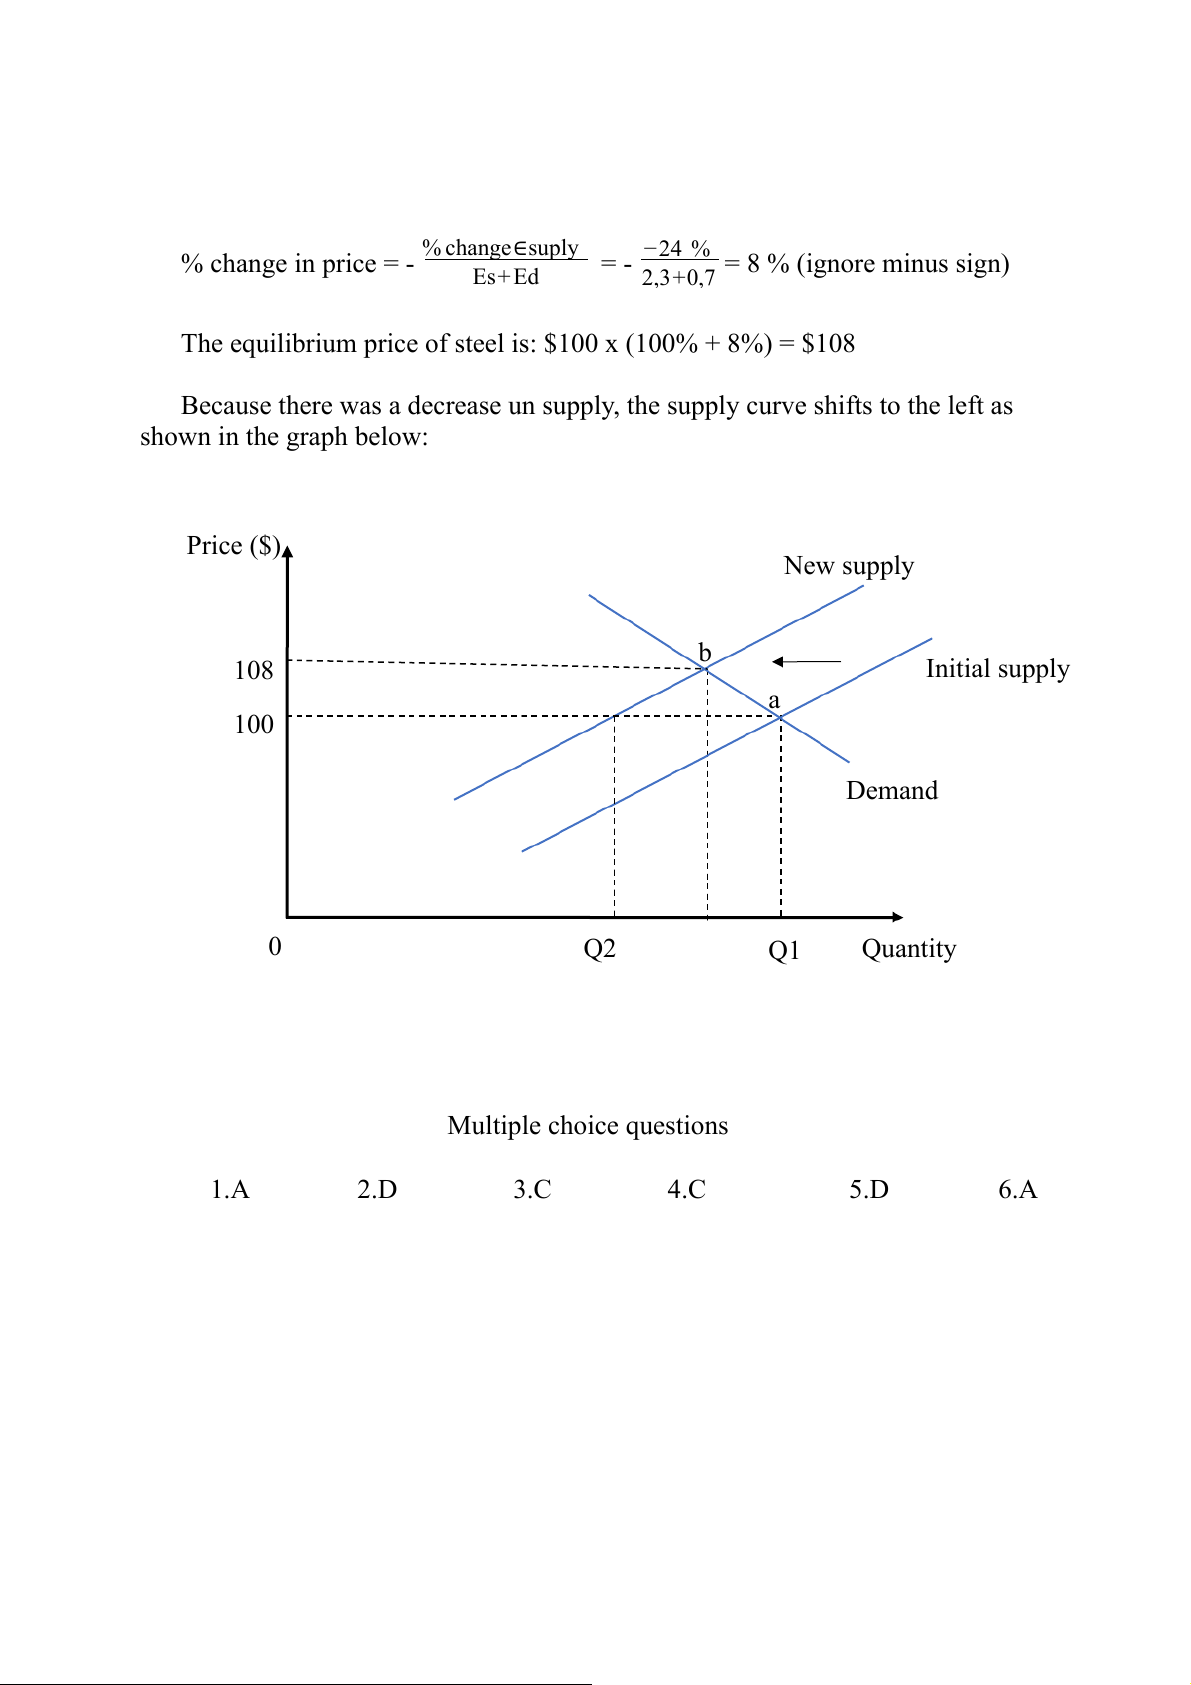
5. Import Restrictions and the Price of Steel % change∈suply % change in price = -
= - −24 % = 8 % (ignore minus sign) Es+Ed 2,3+0,7
The equilibrium price of steel is: $100 x (100% + 8%) = $108
Because there was a decrease un supply, the supply curve shifts to the left as shown in the graph below: Price ($) New supply b 108 Initial supply a 100 Demand 0 Q2 Q1 Quantity Multiple choice questions 1.A 2.D 3.C 4.C 5.D 6.A
Tài liệu liên quan:
-

Chương 3: độ co giãn và các nhân tố ảnh hưởng | Microeconomics | Trường Đại học Quốc tế, Đại học Quốc gia Thành phố Hồ Chí Minh
3 2 -

Microeconomics Syllabus | Microeconomics | Trường Đại học Quốc tế, Đại học Quốc gia Thành phố Hồ Chí Minh
3 2 -

Microeconomics Course Syllabus & Assessment Details | Microeconomics | Trường Đại học Quốc tế, Đại học Quốc gia Thành phố Hồ Chí Minh
3 2 -

Assignment 3 - Elasticity MCQs and Key Concepts | Microeconomics | Trường Đại học Quốc tế, Đại học Quốc gia Thành phố Hồ Chí Minh
3 2 -

Assignment 2 - Economic Equilibrium Analysis of Fridges and Motorcycles | Microeconomics | Trường Đại học Quốc tế, Đại học Quốc gia Thành phố Hồ Chí Minh
3 2