Individual Assignment on Opportunity Costs | Microeconomics | Trường Đại học Quốc tế, Đại học Quốc gia Thành phố Hồ Chí Minh
The opportunity cost of increasing output from 0 to 12 thousand Guided Missiles from point E to point D is 2 million cars. (This means that if the economy increases output from 0 to 12 thousand guided missiles, it must reduce car production from 8 to 6 million, or by 2 million) and points D to C (from 6 to 4), C to B (from 4 to 2), and B to A (from 4 to 2). (from 2 to 0). The opportunity cost of increasing output by 2 million cars from point A to point B, B to C, C to D, and D to E is 3, 6, 9, and 12 thousand Guided Missiles, respectively. Finally, the opportunity costs for the production of missiles are rising. Tài liệu được sưu tầm và soạn thảo dưới dạng file PDF để gửi tới các bạn cùng tham khảo, ôn tập đầy đủ kiến thức, chuẩn bị cho các buổi học thật tốt. Mời bạn đọc đón xem!
Môn: Microeconomics 635 tài liệu
Trường: Trường Đại học Quốc tế, Đại học Quốc gia Thành phố Hồ Chí Minh 1.9 K tài liệu
Tác giả:
Preview text:
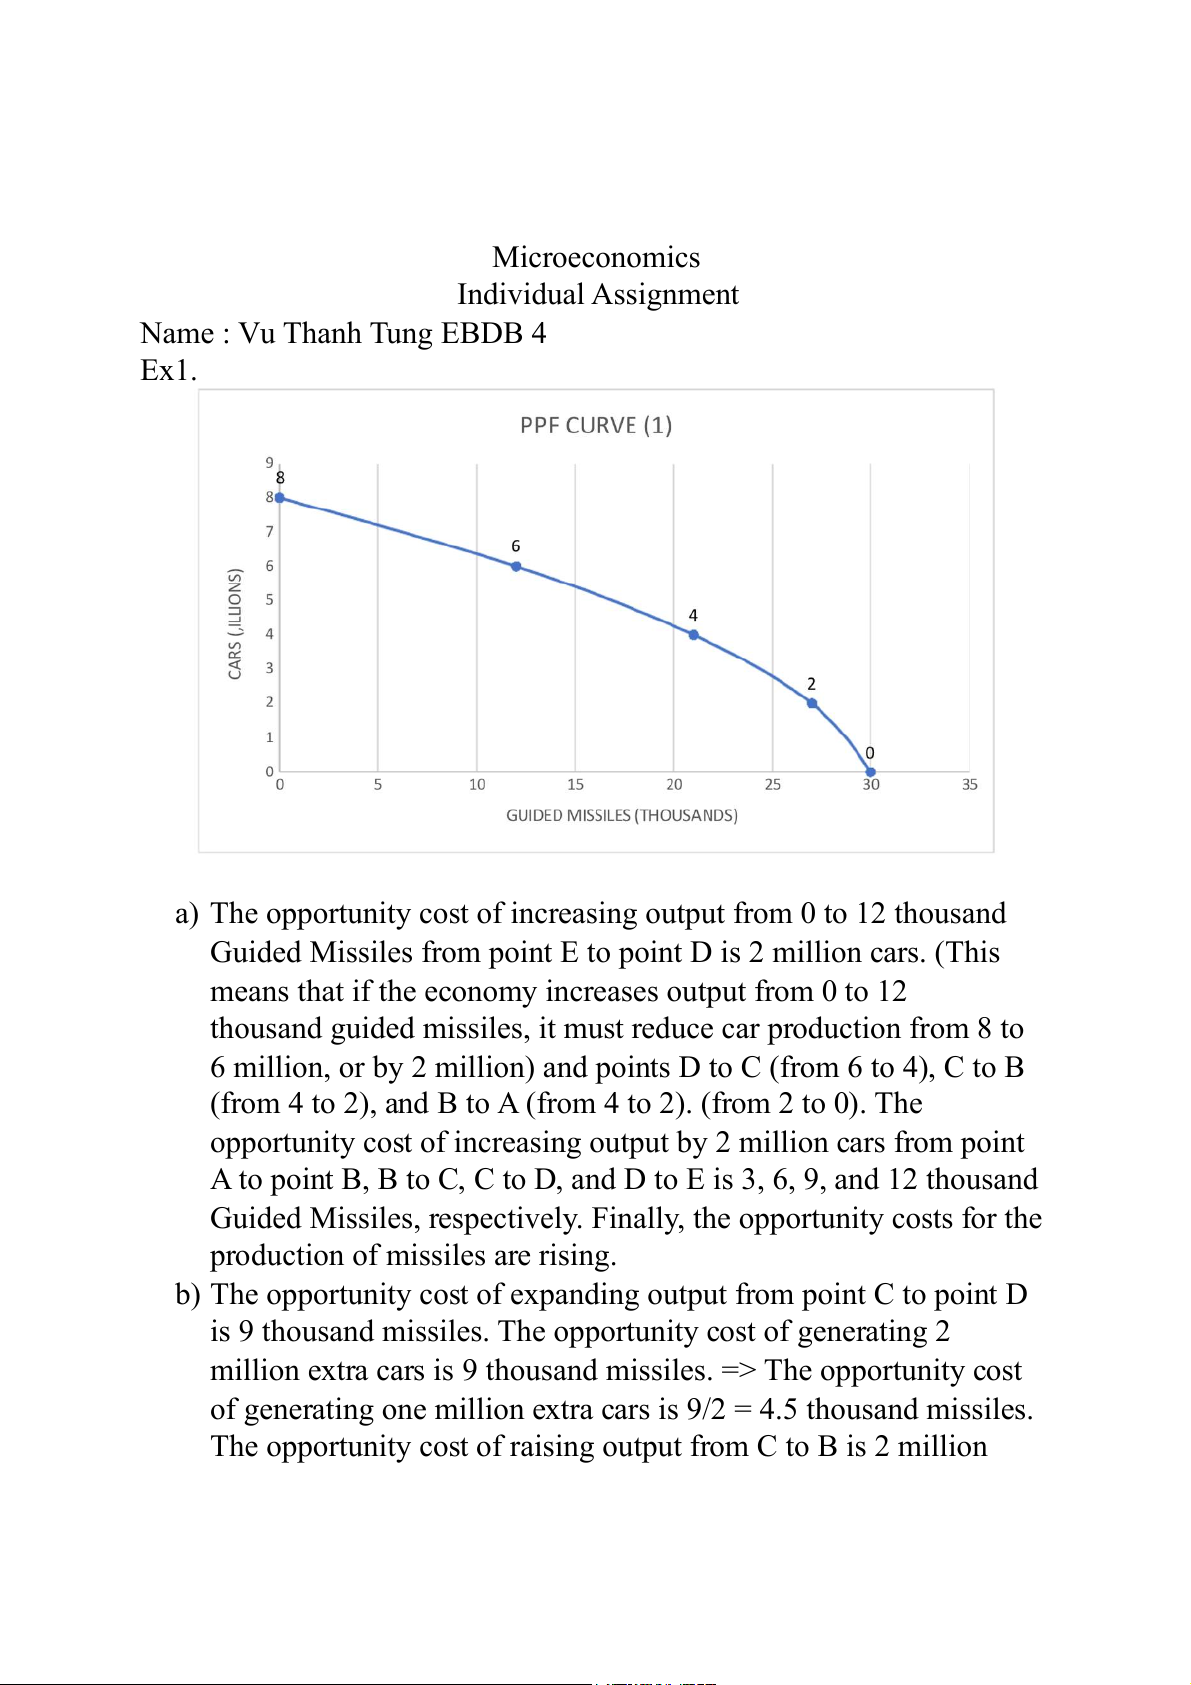
Microeconomics Individual Assignment Name : Vu Thanh Tung EBDB 4 Ex1.
a) The opportunity cost of increasing output from 0 to 12 thousand
Guided Missiles from point E to point D is 2 million cars. (This
means that if the economy increases output from 0 to 12
thousand guided missiles, it must reduce car production from 8 to
6 million, or by 2 million) and points D to C (from 6 to 4), C to B
(from 4 to 2), and B to A (from 4 to 2). (from 2 to 0). The
opportunity cost of increasing output by 2 million cars from point
A to point B, B to C, C to D, and D to E is 3, 6, 9, and 12 thousand
Guided Missiles, respectively. Finally, the opportunity costs for the
production of missiles are rising.
b) The opportunity cost of expanding output from point C to point D
is 9 thousand missiles. The opportunity cost of generating 2
million extra cars is 9 thousand missiles. => The opportunity cost
of generating one million extra cars is 9/2 = 4.5 thousand missiles.
The opportunity cost of raising output from C to B is 2 million
automobiles. The opportunity cost of creating 6,000 extra missiles
is 2 million autos. => The opportunity cost of creating 1,000 extra
missiles is 2/6 = 1/3 million autos.
c) Point G indicates the economic output of Car and Missile are 4
million cars and12 thousand missiles. This means the economy is
inefficient in its production. Because if it produces 4 million cars,
the most of the missiles it can produce is 21 thousand missiles,
and if it produces 12 thousand missiles, the most cars it can produce is 6 million cars.
d) Point H implies that the economic production of automobiles and
missiles is 6 million automobiles and 21,000 missiles. It denotes
economic outputs that can only result from an increase in the
availability of inputs to convert inputs into outputs. The Hpoint
denotes the impossibility of achieving the desired result with the fixed resource.
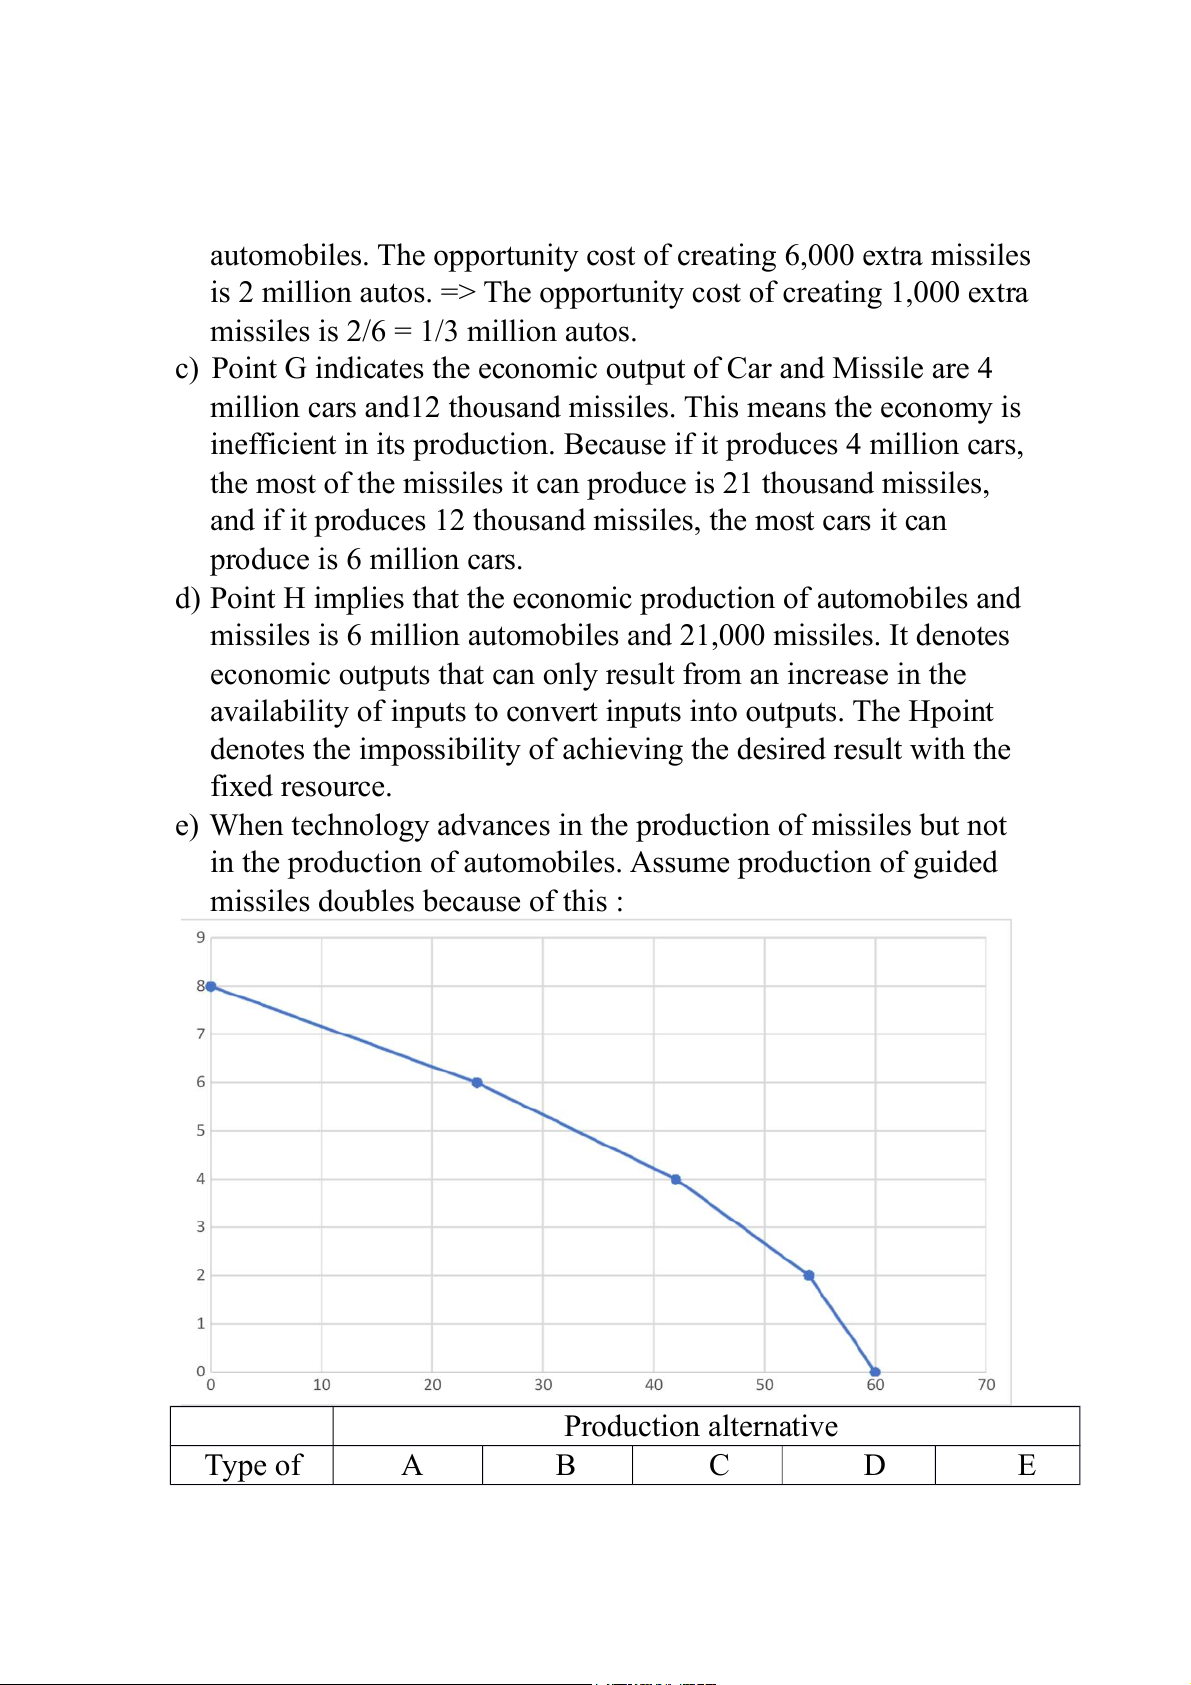
e) When technology advances in the production of missiles but not
in the production of automobiles. Assume production of guided
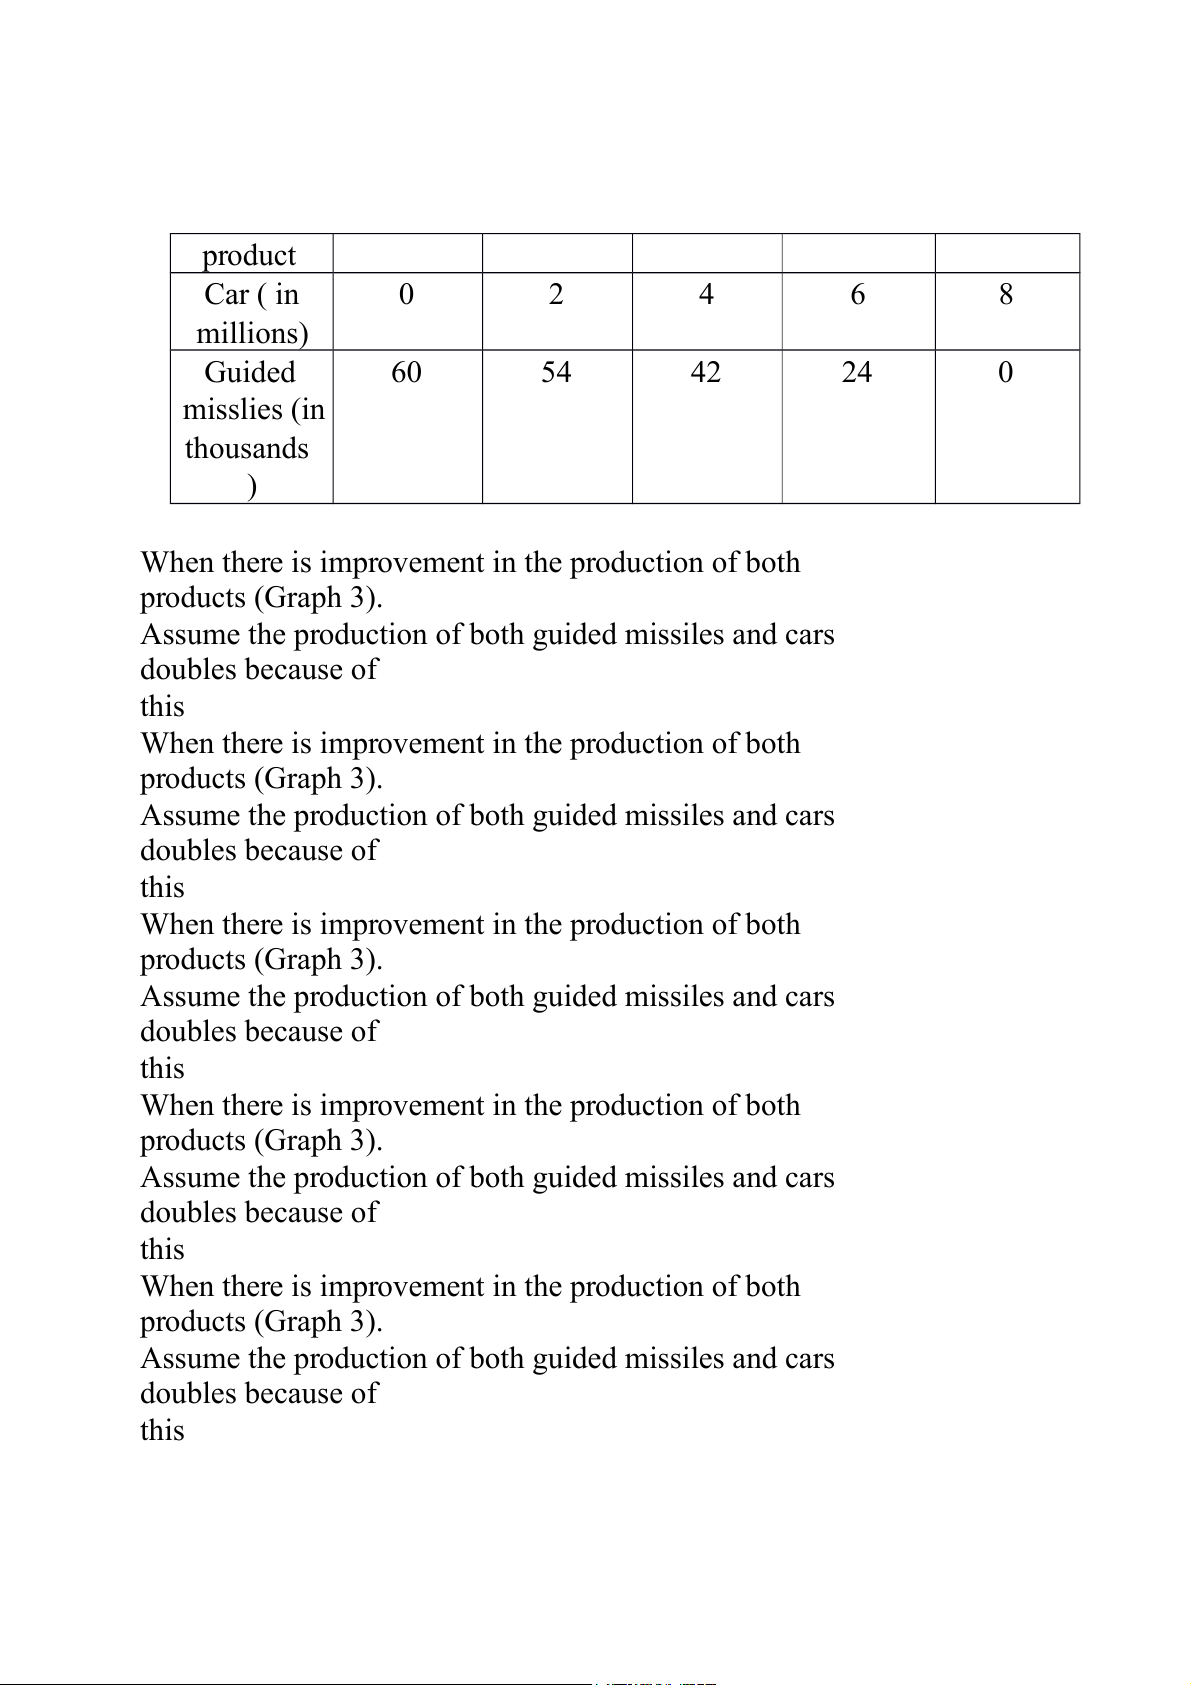
missiles doubles because of this : Production alternative Type of A B C D E product Car ( in 0 2 4 6 8 millions) Guided 60 54 42 24 0 misslies (in thousands )
When there is improvement in the production of both products (Graph 3).
Assume the production of both guided missiles and cars doubles because of this
When there is improvement in the production of both products (Graph 3).
Assume the production of both guided missiles and cars doubles because of this
When there is improvement in the production of both products (Graph 3).
Assume the production of both guided missiles and cars doubles because of this
When there is improvement in the production of both products (Graph 3).
Assume the production of both guided missiles and cars doubles because of this
When there is improvement in the production of both products (Graph 3).
Assume the production of both guided missiles and cars doubles because of this
When there is improvement in the production of both products (Graph 3).
Assume the production of both guided missiles and cars doubles because of
When there is improvement in the production of both products (Graph
3). Assume the production of both guided missiles and cars doubles because of this
When there is improvement in the production of both products (Graph 3).
Assume the production of both guided missiles and cars doubles because of
When there is improvement in the production of both products (Graph 3).
Assume the production of both guided missiles and cars doubles because of
When there is improvement in the production of both products (Graph 3).
Assume the production of both guided missiles and cars doubles because of
When there is improvement in the production of both products (Graph 3).
Assume the production of both guided missiles and cars doubles because of
When there is improvement in the production of both products (Graph 3).
Assume the production of both guided missiles and cars doubles because of
When there is improvement in the production of both products (Graph 3).
Assume the production of both guided missiles and cars doubles because of
al opportunity cost: The opportunity cost of producing 25 tons of Wheat is
10000 set of Cloths. => The opportunity cost of
producing 1 ton of Wheat is 400 set
of Cloths. => The opportunity cost of producing 1 set of Cloths is 1/400 = 0.0025 tons of Wheat.
c) Marginal Opportunity Cost: _ From point E to D, the opportunity cost of producing more 9 tons
When there is improvement in the production of both products (Graph 3).
Assume the production of both guided missiles and cars doubles because of
When there is improvement in the production of both products (Graph 3).
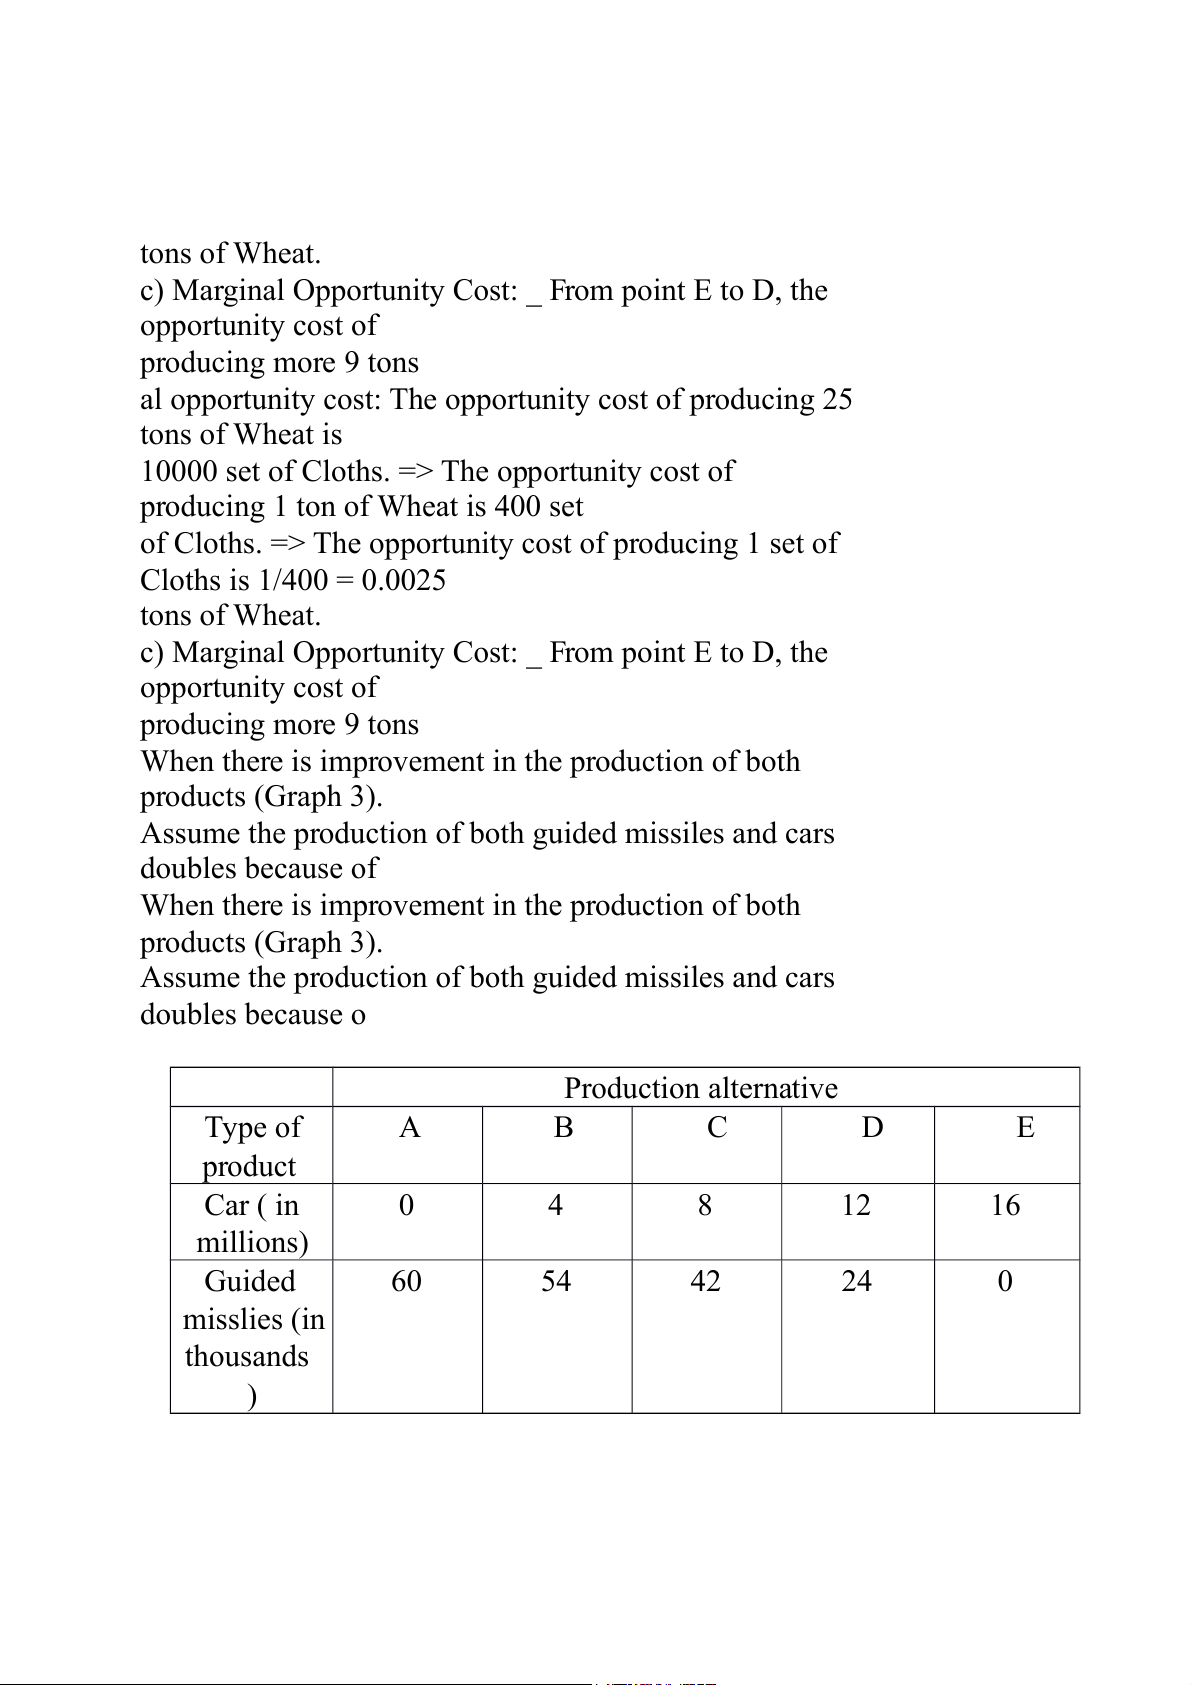
Assume the production of both guided missiles and cars doubles because o Production alternative Type of A B C D E product Car ( in 0 4 8 12 16 millions) Guided 60 54 42 24 0 misslies (in thousands ) Ex2. 70 60 50 40 30 20 10 0 a) 0 1 2 3 4 5 6 7 8 9
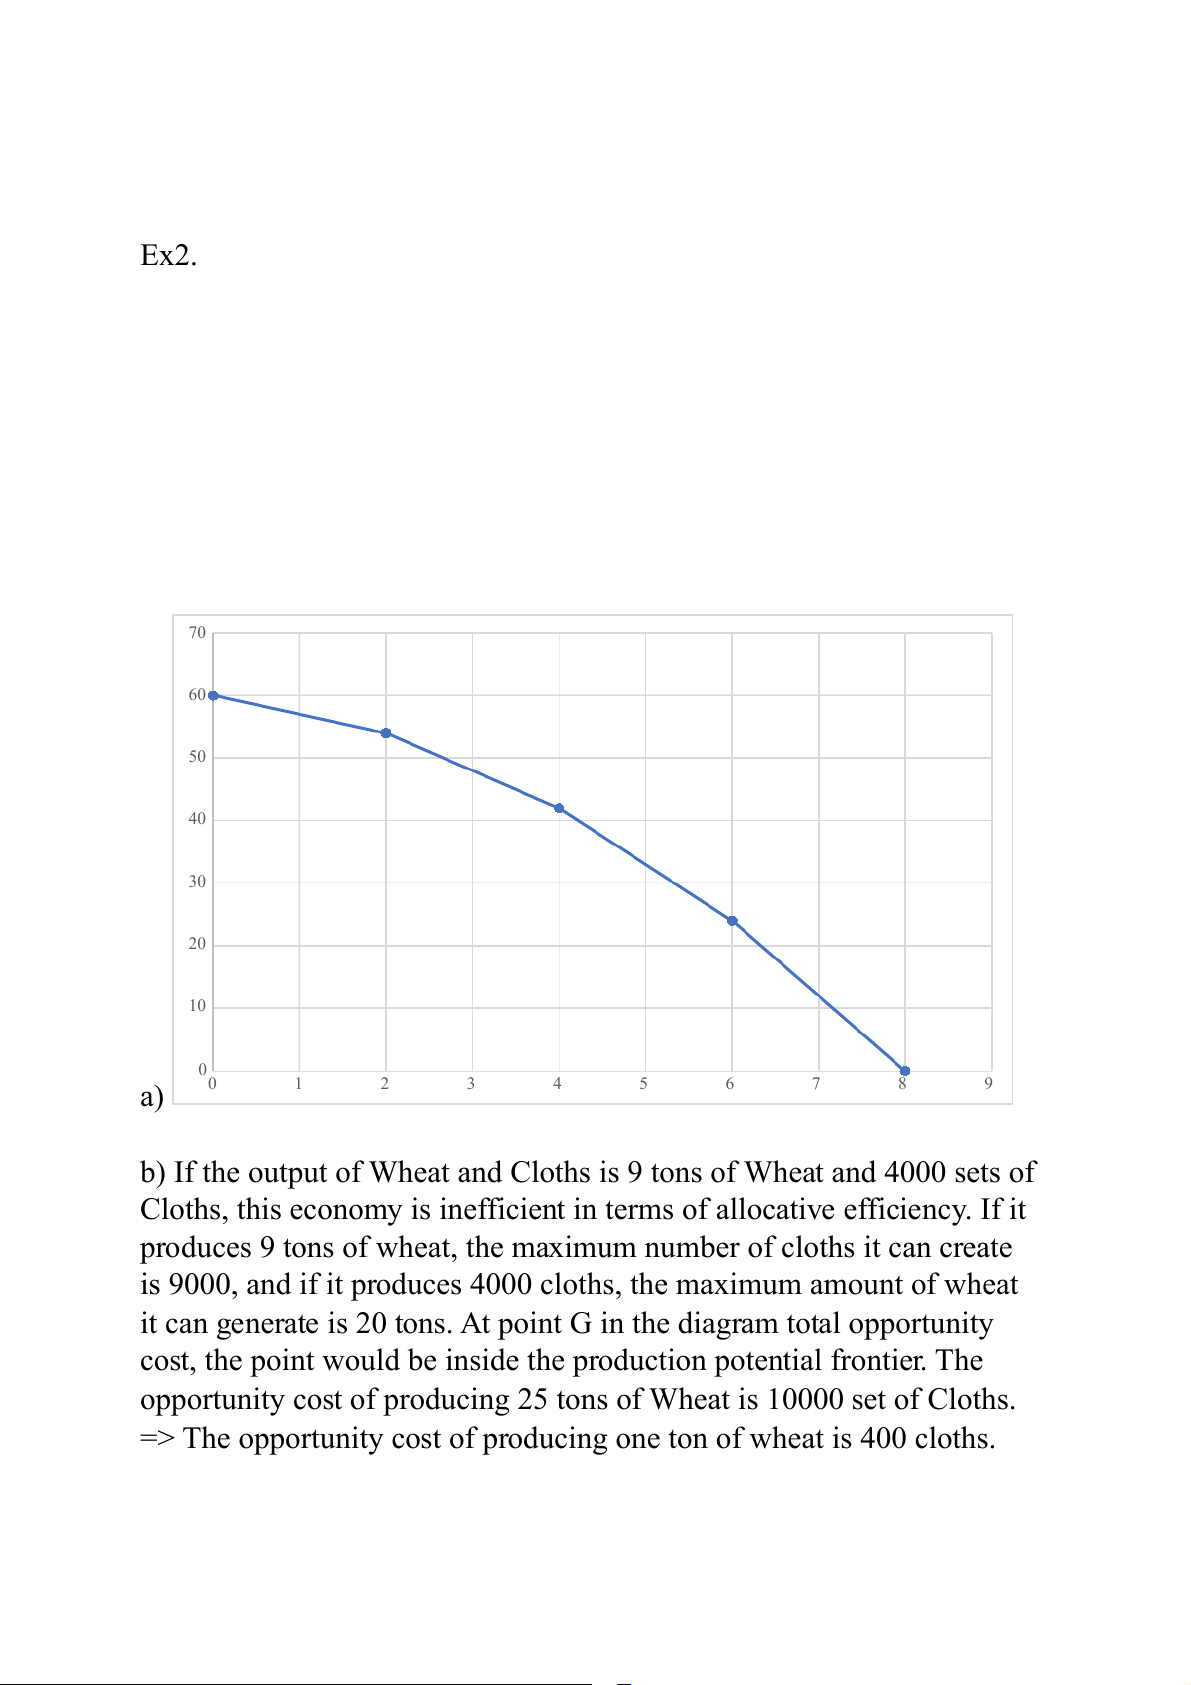
b) If the output of Wheat and Cloths is 9 tons of Wheat and 4000 sets of
Cloths, this economy is inefficient in terms of allocative efficiency. If it
produces 9 tons of wheat, the maximum number of cloths it can create
is 9000, and if it produces 4000 cloths, the maximum amount of wheat
it can generate is 20 tons. At point G in the diagram total opportunity
cost, the point would be inside the production potential frontier. The
opportunity cost of producing 25 tons of Wheat is 10000 set of Cloths.
=> The opportunity cost of producing one ton of wheat is 400 cloths.
The opportunity cost of manufacturing one set of Cloths is 1/400 = 0.0025 tons of Wheat.
c) The marginal opportunity cost of manufacturing an additional 9 tons
of wheat from point E to point D is one thousand sets of Cloths. The
opportunity cost of producing one more ton of wheat is one-nineth of a
thousand sets of cloth. => The potential cost of creating 1000 more sets
of Cloths from point D to E is 9 tons of Wheat. The opportunity cost of
generating 6 extra tons of wheat from point D to point C is 2 thousand
sets of Cloths. The opportunity cost of producing one more ton of
wheat is 2/ 6= one-third of a thousand sets of Cloths. => The potential
cost of producing 1000 more sets of Cloths from point C to point D is 3 tons of Wheat.
d) The opportunity cost of manufacturing 5 extra tons of Wheat from
point C to point B is 3 thousand sets of Cloths. The opportunity cost of
producing one more ton of wheat is three-fifths of a thousand sets of
cloth. => The opportunity cost of generating 1000 more sets of Cloths
from point B to point C is 5/3 tons of Wheat. The opportunity cost of
manufacturing 5 extra tons of Wheat from point B to point A is 4
thousand sets of Cloths. The opportunity cost of producing an
additional ton of wheat is 4/5=0.8 thousand sets of Cloths. => The
opportunity cost of generating 1000 more sets of Cloths from point A to
point B is 5/4= 1.25 tons of Wheat.
Tài liệu liên quan:
-

Chương 3: độ co giãn và các nhân tố ảnh hưởng | Microeconomics | Trường Đại học Quốc tế, Đại học Quốc gia Thành phố Hồ Chí Minh
6 3 -

Microeconomics Syllabus | Microeconomics | Trường Đại học Quốc tế, Đại học Quốc gia Thành phố Hồ Chí Minh
5 3 -

Microeconomics Course Syllabus & Assessment Details | Microeconomics | Trường Đại học Quốc tế, Đại học Quốc gia Thành phố Hồ Chí Minh
5 3 -

Assignment 3 - Elasticity MCQs and Key Concepts | Microeconomics | Trường Đại học Quốc tế, Đại học Quốc gia Thành phố Hồ Chí Minh
5 3 -

Assignment 2 - Economic Equilibrium Analysis of Fridges and Motorcycles | Microeconomics | Trường Đại học Quốc tế, Đại học Quốc gia Thành phố Hồ Chí Minh
6 3