Lesson 2: Demand, Supply, and Government Policies in Economics | Microeconomics | Trường Đại học Quốc tế, Đại học Quốc gia Thành phố Hồ Chí Minh
Demand (Buyer): D: study the behavior of buyers in the market - Definition: Demand not Need/Want The demand of any good is the amount of the good that buyers are willing and able to purchase, at each price, in a given period of time, ceteris paribus. Tài liệu được sưu tầm và soạn thảo dưới dạng file PDF để gửi tới các bạn cùng tham khảo, ôn tập đầy đủ kiến thức, chuẩn bị cho các buổi học thật tốt. Mời bạn đọc đón xem!
Môn: Microeconomics 635 tài liệu
Trường: Trường Đại học Quốc tế, Đại học Quốc gia Thành phố Hồ Chí Minh 1.9 K tài liệu
Tác giả:
Preview text:
Lesson 2: Theory of Demand and Supply and Gov Policies
1.Demand (Buyer): D: study the behavior of buyers in the market
- Definition: Demand not Need/Want
The demand of any good is the amount of the good that buyers are willing and able to purchase, at each
price, in a given period of time, ceteris paribus.
Willing to pay: Need/Preference
Able to buy: afford to buy something: financial ability
Demand: when two properties can be satisfied.
E.g., Macbook 2021 version, Price: $3000
People prefer to buy this Macbook but they do not have enough money No demand
Classification between Demand and Quantity Demanded:
Demand: the amount of goods demanded at each price.
o Study the association between price and quantity demanded.
Quantity Demanded: the amount of goods at a given price. o P1 QD1 o P2 QD2 o … o Pn QDn
Relationship between the price and quantity demanded mentioned above is the demand
- Law of Demand: they way that buyers respond to changes in price
the negative relationship between price and quantity demanded: P ↑→ Q ↓ D P ↓→ Q ↑ D
E.g., normally, price of pork is 15k/g, due to some reasons the price of pork increases to 20k/g. Whether
continue to buy or buy other meats like chicken, beef…
In words, you to want to buy more at a lower price and buys less at a higher price rational behavior of
consumers/buyers in the market. - Reprentation of demand: Demand Schedule Demand curve
Demand function: (D): Q = a-bP P= a’-b’Q
o a’: constant/intercept (The value of P when Q=0) o b’: slope of demand
- Distinguishing between single and market Demand:
Note: We only care about the market demand because the change in market demand leads to change in the
price and quantity in the market. Change in behavior of single demand do not significantly affect the market price.
How to develop the market demand function/curve from the collection of information about single demand function/curve.
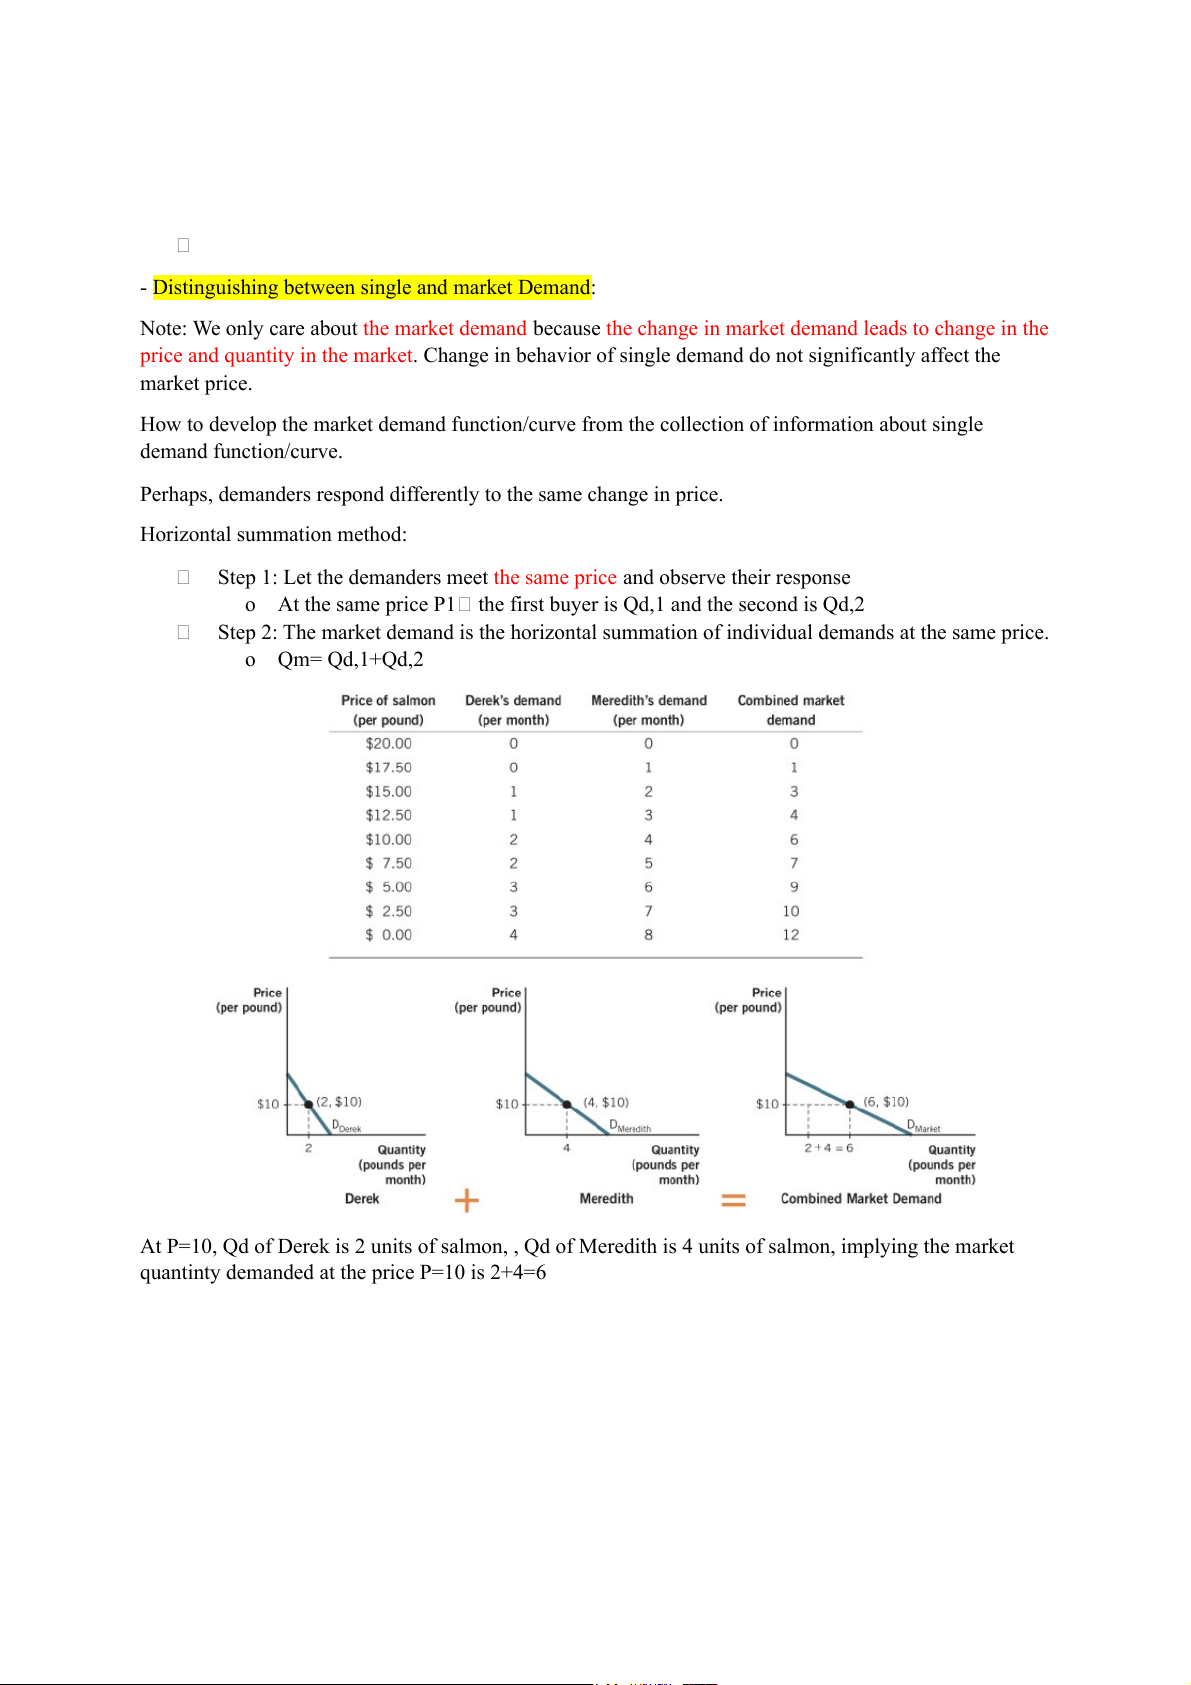
Perhaps, demanders respond differently to the same change in price. Horizontal summation method:
Step 1: Let the demanders meet the same price and observe their response
o At the same price P1 the first buyer is Qd,1 and the second is Qd,2
Step 2: The market demand is the horizontal summation of individual demands at the same price. o Qm= Qd,1+Qd,2
At P=10, Qd of Derek is 2 units of salmon, , Qd of Meredith is 4 units of salmon, implying the market
quantinty demanded at the price P=10 is 2+4=6
Application: Adapting the horizontal summation method to construct the market demand function from the single demand function:
E.g., Assume that there are two buyers in the market of pork (D1): Q =a−b P d ,1
1 : the demand function of the first buyer (D2): Q =c −d P d ,2
2 : the demand function of the second buyer
Solution: Hint: Need to transform the single function into the form Q=f(P) and determine the quantity
demanded of different buyers at the same price (D1): Q =a−bP d ,1 (D2): Q =c −dP d ,2 (Market Demand): Q =Q +Q = (a−c )+(b−d ) P M d ,1 d , 2 -- Determinants of Demand:
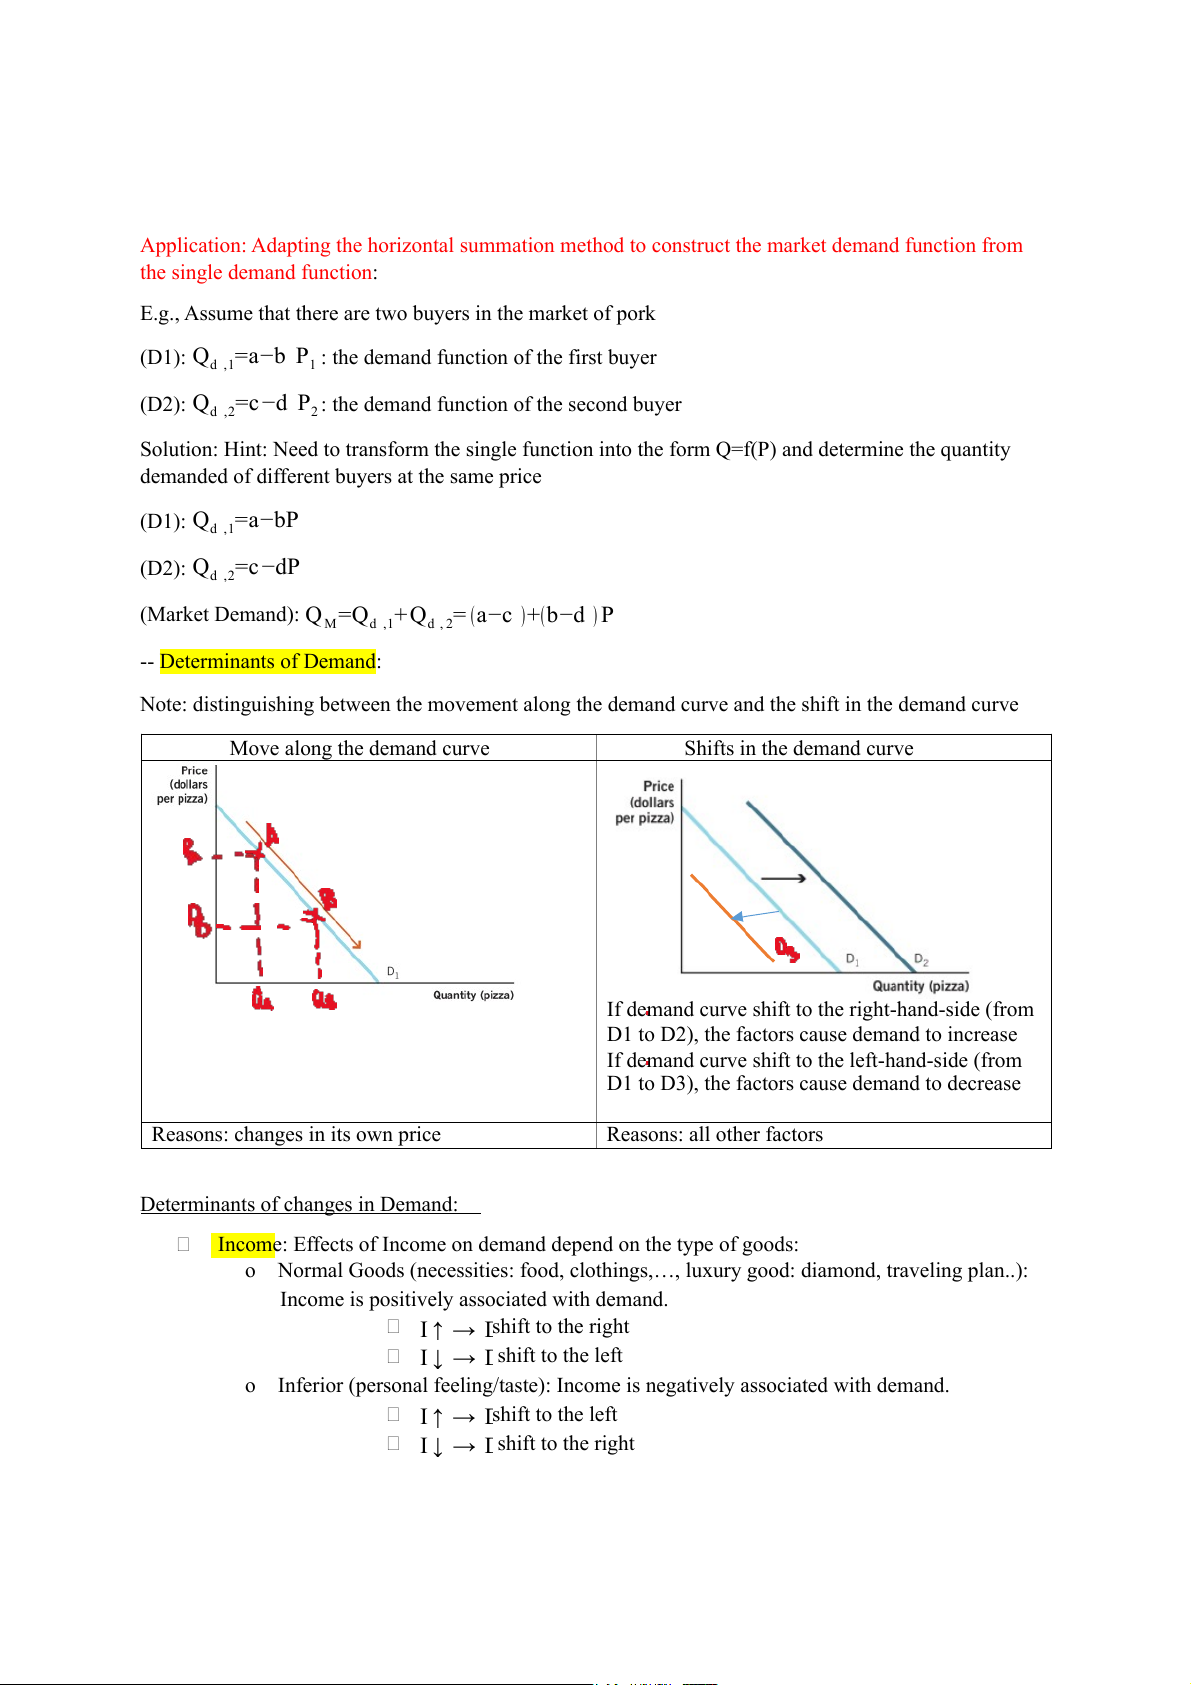
Note: distinguishing between the movement along the demand curve and the shift in the demand curve Move along the demand curve Shifts in the demand curve
If demand curve shift to the right-hand-side (from
D1 to D2), the factors cause demand to increase
If demand curve shift to the left-hand-side (from
D1 to D3), the factors cause demand to decrease
Reasons: changes in its own price Reasons: all other factors
Determinants of changes in Demand:
Income: Effects of Income on demand depend on the type of goods:
o Normal Goods (necessities: food, clothings,…, luxury good: diamond, traveling plan..):
Income is positively associated with demand. I ↑ → Dshift to the right I ↓ → D shift to the left
o Inferior (personal feeling/taste): Income is negatively associated with demand. I ↑ → Dshift to the left I ↓ → D shift to the right
Price of related goods: its effects on demand depend on the type of relationship. We want to
analyse the effects of change in price of Y on the demand of X
o Substituted Goods (e.g shampoo: Clear, Xmen, Sunsilk…) P ↓ →Q ↑ →Q Y y X
When price of Y become relatively cheap as compared to the price of
X customer will shift to buy goods Y Market share of good X decreases. P ↑ →Q ↓ →Q Y y X
There is a positive association between the price of Y and demand of X if X and Y are closely substituted.
o Complementary goods (e.g., coffee goes with milk) P ↓ →Q ↑ →Q Y y X
When price of Y become cheaper customer will buy more good Y and
because X and Y come together Demand of X will increase P ↑ →Q ↓ →Q Y y X
There is a negative association between the price of Y and demand of X if X and Y are complements.
Expectation: the change in price of goods in the future will affect the current demand?
Let discuss about these cases: changes in demand
1. In rainy days, customers are willing to pay more to buy umbrella.
Ans: Reason: Rainy day people buy more (demand increases) demand will shift to the RHS
2. Viettel decreases the calling fee at the weekend that cause amount of calling to increase.
Ans: decrease in calling fee demand increases A move along the demand curve
3. On Woman day, the prices of flowers are often higher than normal but people still buy lots of flowers.
Ans: more demands on flowers because of the Woman day the demand curve will shift to RHS
4. To reduce the amount of private transportation, the government increase the tax on gasoline.
Ans: The demand curve will shift to LHS
2.Supply (Sellers): S: study the behavior of sellers in the market 2. Supply - Definition: - Law of Supply: - Reprentation of Supply:
- Distinguishing between single and market Supply:
E.g., Assume that there two branches of tooth brush in the market: PS and Close-up with the supply
function P=Q+2 , P=0,5Q+5 , respectively. What is Market Supply?
Hint: We need to transform the supply (demand) function into this form: Q=f(P) (PS):P =Q +2 →Q =P−2 Ps PS Ps
(Close-up): P =0.5Q +5 →Q =2 P−10 C c c (Market): Q =Q +Q =3 P−12 M Ps c
A complete example to observe how to adapt the horizontal summation method to construct the market demand/supply function. - Determinants of supply: - Input price Tax or Subsidy Effects:
Tax (subsidy) policy directly impacts the cost of production, then cause supply curve shift to the left (right)
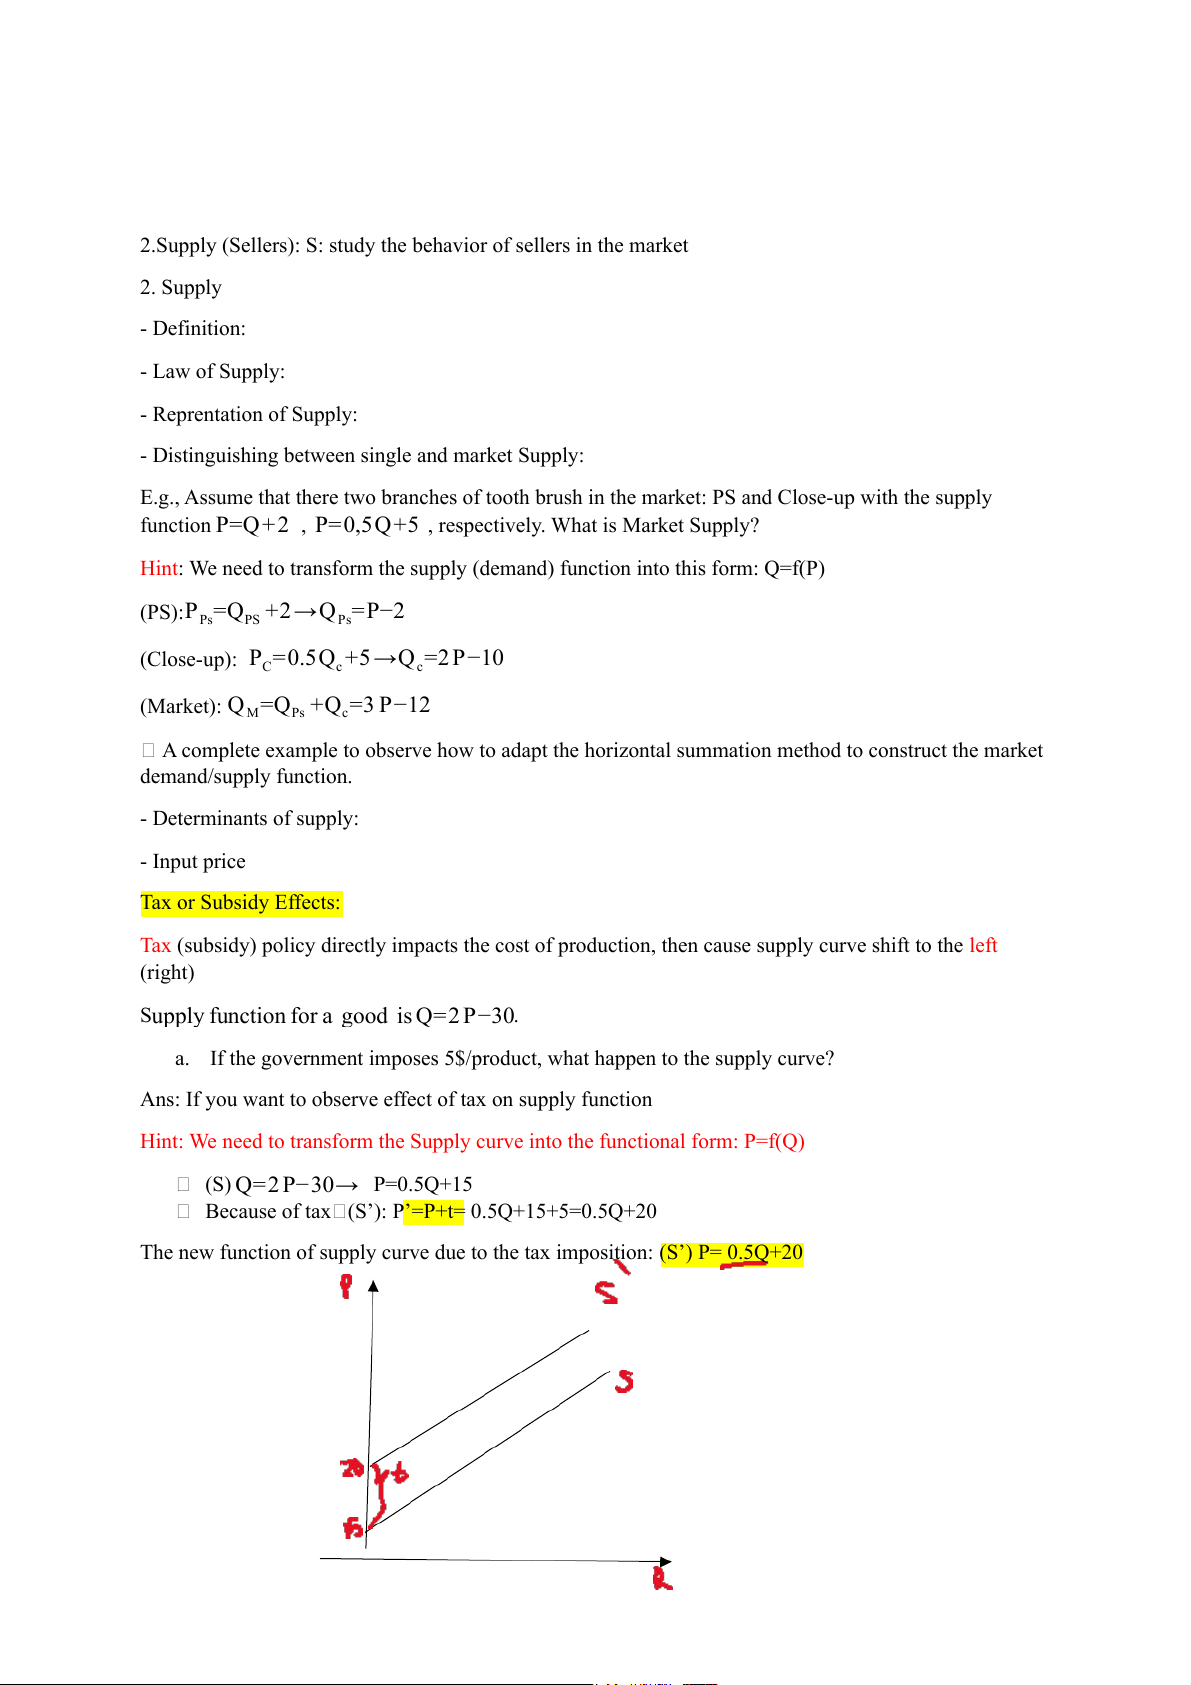
Supply function for a good is Q=2 P−30.
a. If the government imposes 5$/product, what happen to the supply curve?
Ans: If you want to observe effect of tax on supply function
Hint: We need to transform the Supply curve into the functional form: P=f(Q) (S) Q=2 P−30→ P=0.5Q+15
Because of tax (S’): P’=P+t= 0.5Q+15+5=0.5Q+20
The new function of supply curve due to the tax imposition: (S’) P= 0.5Q+20 3. Market Equlibrium
Price of a cup of coffee is 20,oooVND Decide how many cups you want buy.
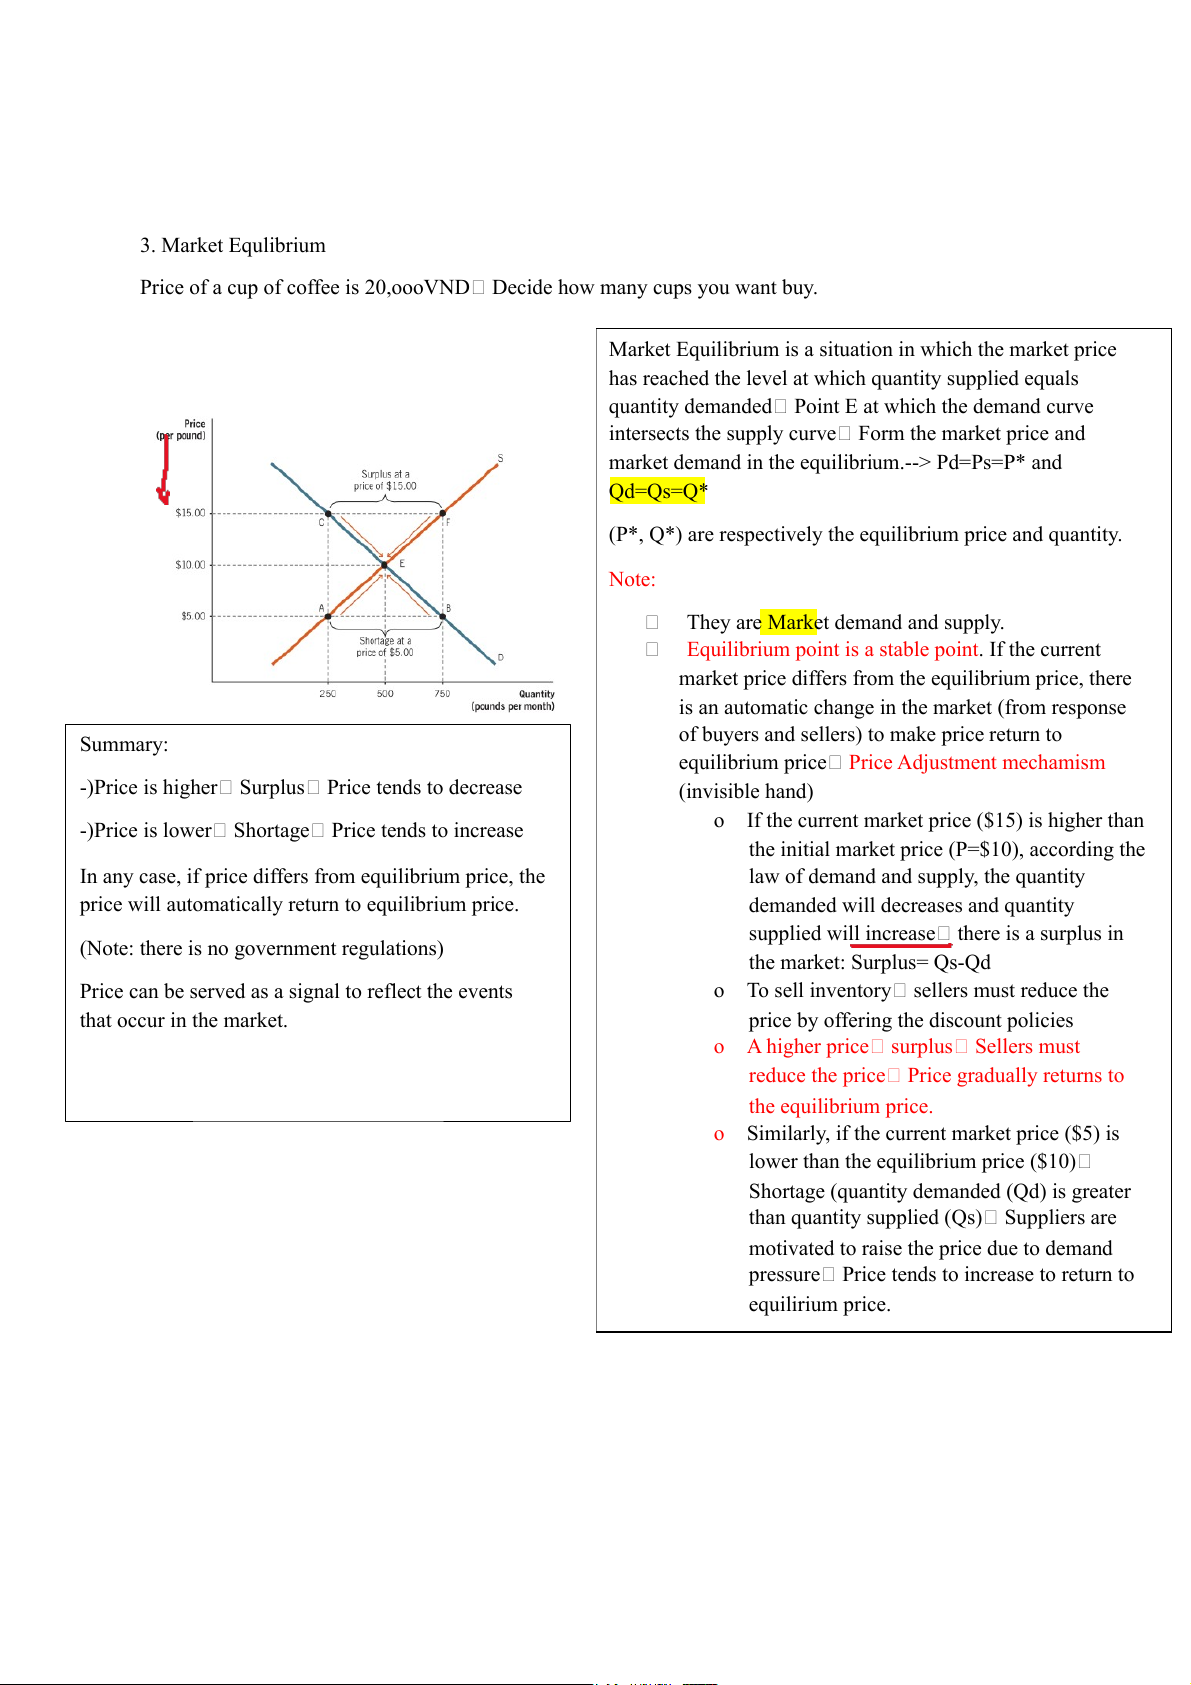
Market Equilibrium is a situation in which the market price
has reached the level at which quantity supplied equals
quantity demanded Point E at which the demand curve
intersects the supply curve Form the market price and
market demand in the equilibrium.--> Pd=Ps=P* and Qd=Qs=Q*
(P*, Q*) are respectively the equilibrium price and quantity. Note:
They are Market demand and supply.
Equilibrium point is a stable point. If the current
market price differs from the equilibrium price, there
is an automatic change in the market (from response
of buyers and sellers) to make price return to Summary:
equilibrium price Price Adjustment mechamism
-)Price is higher Surplus Price tends to decrease (invisible hand)
o If the current market price ($15) is higher than
-)Price is lower Shortage Price tends to increase
the initial market price (P=$10), according the
In any case, if price differs from equilibrium price, the
law of demand and supply, the quantity
price will automatically return to equilibrium price.
demanded will decreases and quantity
supplied will increase there is a surplus in
(Note: there is no government regulations) the market: Surplus= Qs-Qd
Price can be served as a signal to reflect the events
o To sell inventory sellers must reduce the that occur in the market.
price by offering the discount policies
o A higher price surplus Sellers must
reduce the price Price gradually returns to the equilibrium price.
o Similarly, if the current market price ($5) is
lower than the equilibrium price ($10)
Shortage (quantity demanded (Qd) is greater
than quantity supplied (Qs) Suppliers are
motivated to raise the price due to demand
pressure Price tends to increase to return to equilirium price. Assignment
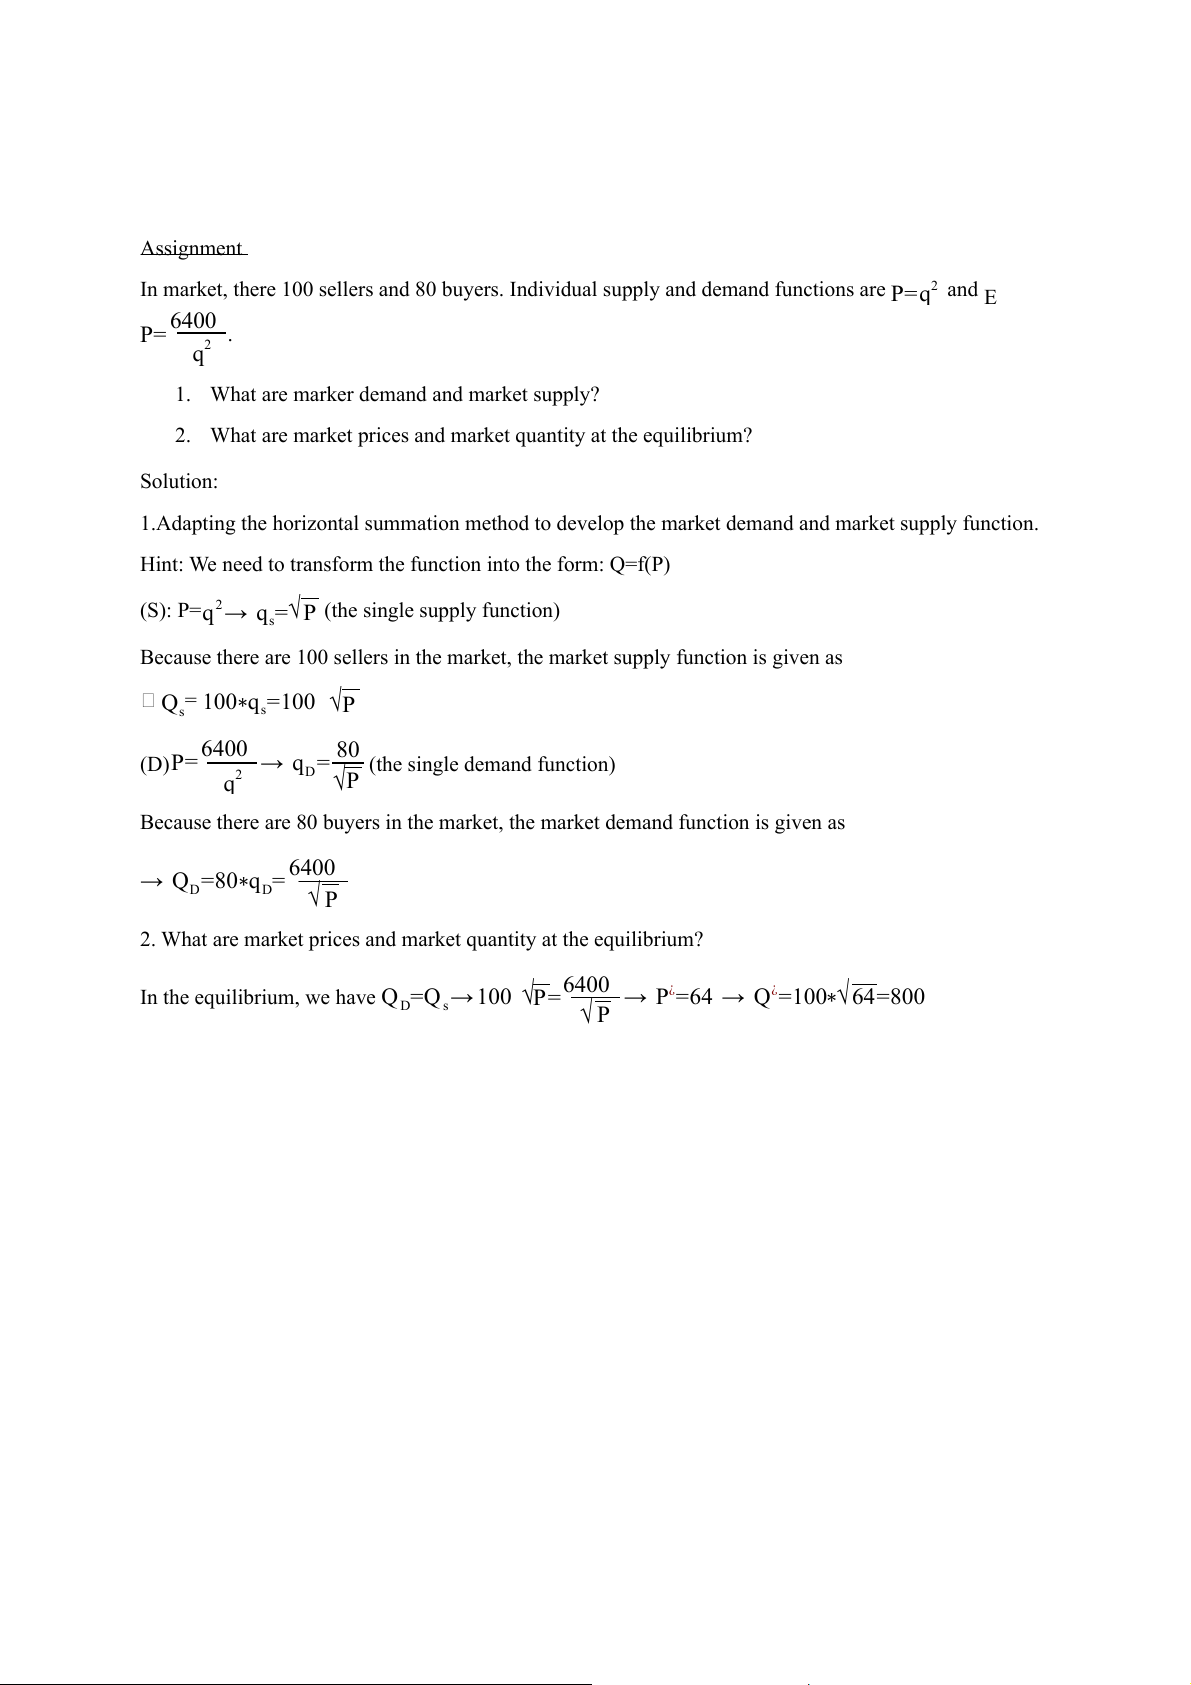
In market, there 100 sellers and 80 buyers. Individual supply and demand functions are P=q2 and E 6400 P= . q2
1. What are marker demand and market supply?
2. What are market prices and market quantity at the equilibrium? Solution:
1.Adapting the horizontal summation method to develop the market demand and market supply function.
Hint: We need to transform the function into the form: Q=f(P)
(S): P=q2→ qs=√P (the single supply function)
Because there are 100 sellers in the market, the market supply function is given as Q = 100∗q s s=100 √P 6400 80 (D)P= → q = (the single demand function) q2 D √P
Because there are 80 buyers in the market, the market demand function is given as 6400 → Q =80 = D ∗qD √ P
2. What are market prices and market quantity at the equilibrium? 6400
In the equilibrium, we have Q =Q → 100 √ → P¿=64 → Q¿=100 = D s P= ∗√ 64 800 √ P
Analyse the change in the market equilibrium:
How to predict the changes in price and quantity due to shocks, external factors 3-step Analysis: -
Step 1: Based on the information we collected, you must indicate that shocks will affect the demand or supply or both -
Step 2: The effects are negative or positive -
Step 3: using the figure to make simulation to show changes in price and quantity. -
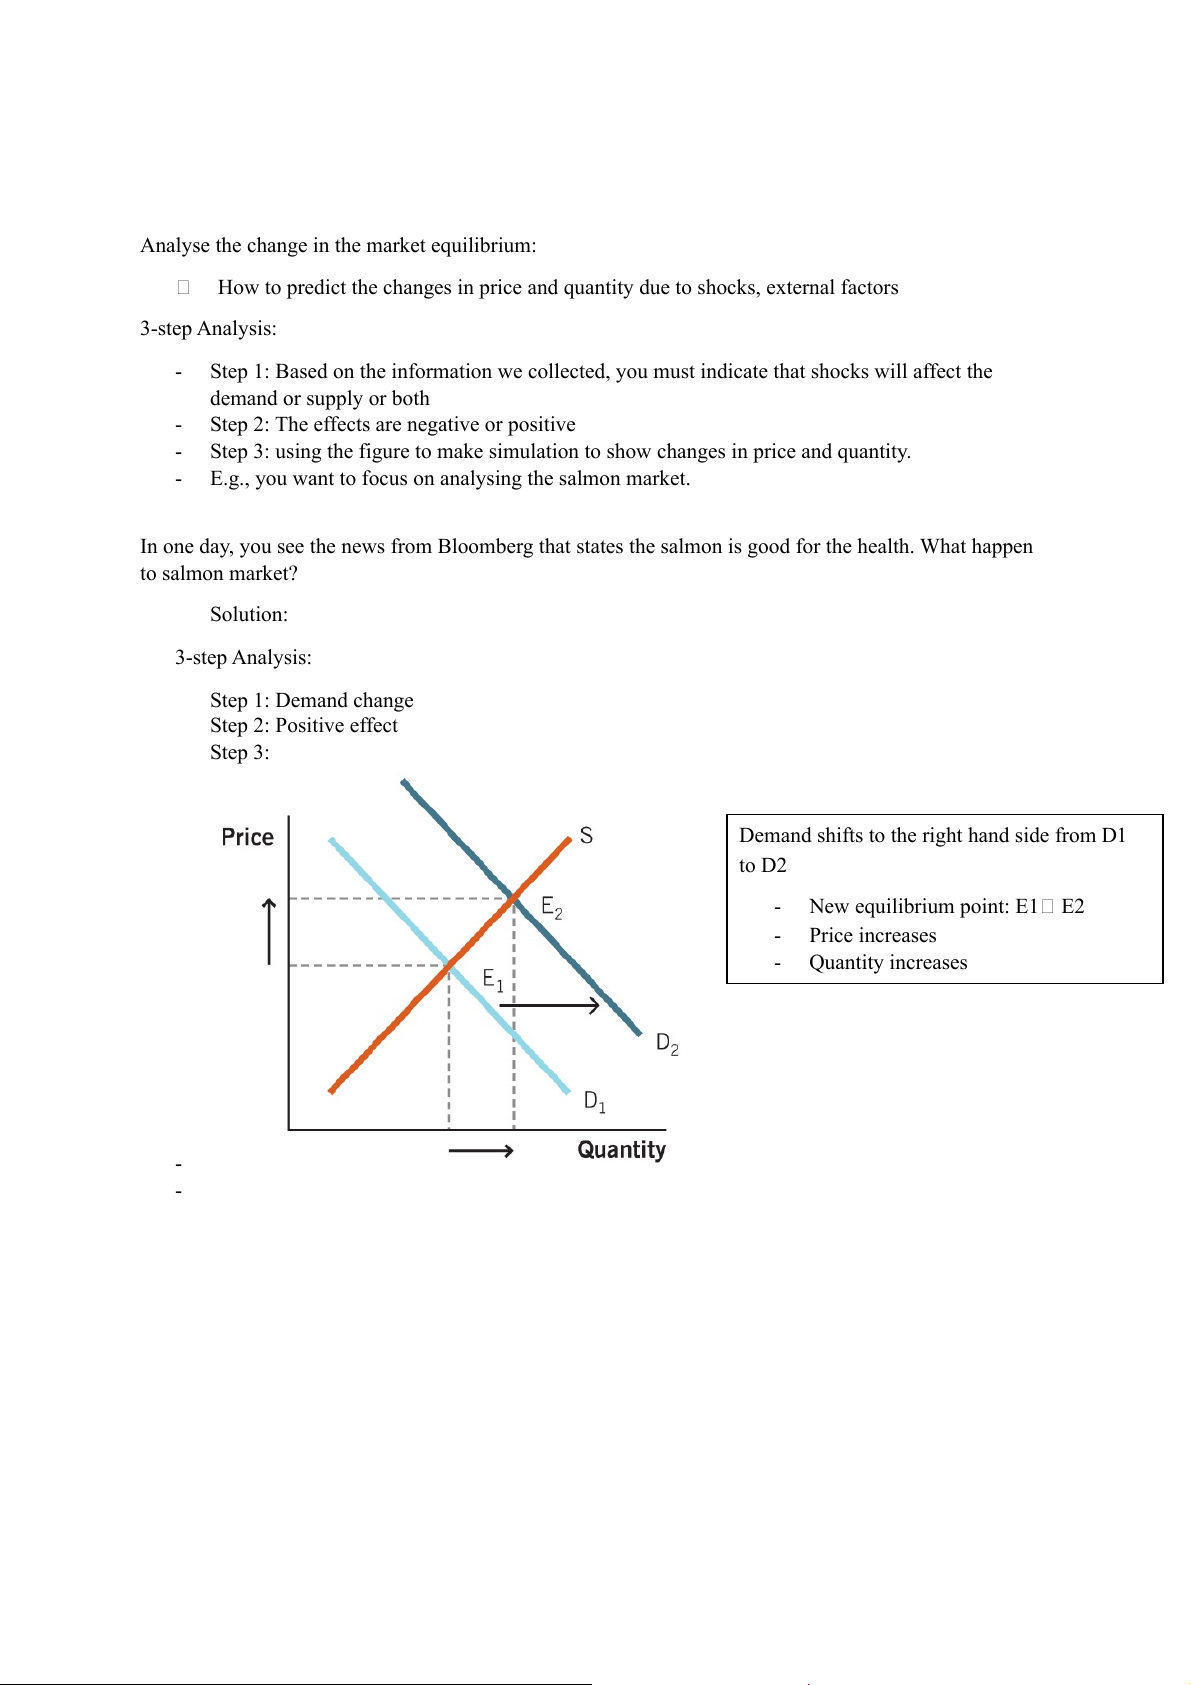
E.g., you want to focus on analysing the salmon market.
In one day, you see the news from Bloomberg that states the salmon is good for the health. What happen to salmon market? Solution: 3-step Analysis: Step 1: Demand change Step 2: Positive effect Step 3:
Demand shifts to the right hand side from D1 to D2 - New equilibrium point: E1 E2 - Price increases - Quantity increases - -
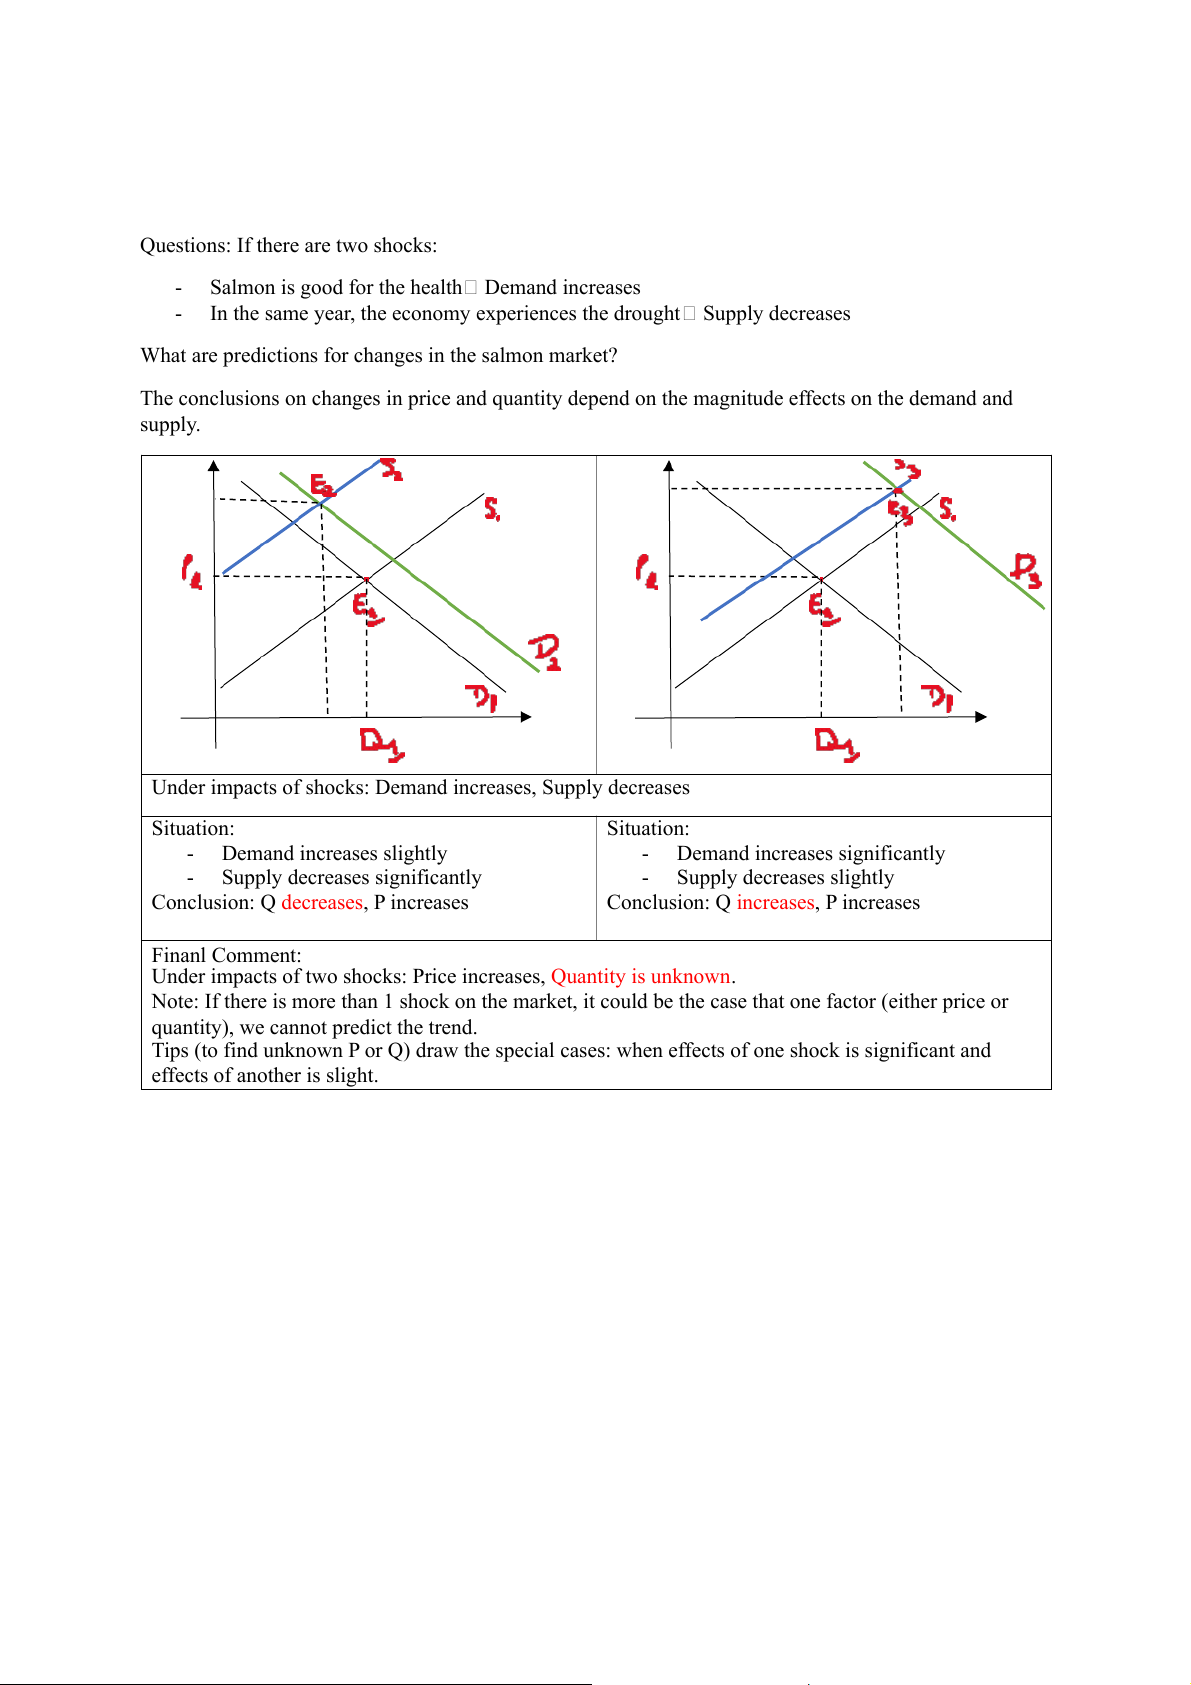
Questions: If there are two shocks: -
Salmon is good for the health Demand increases -
In the same year, the economy experiences the drought Supply decreases
What are predictions for changes in the salmon market?
The conclusions on changes in price and quantity depend on the magnitude effects on the demand and supply.
Under impacts of shocks: Demand increases, Supply decreases Situation: Situation: - Demand increases slightly - Demand increases significantly - Supply decreases significantly - Supply decreases slightly
Conclusion: Q decreases, P increases
Conclusion: Q increases, P increases Finanl Comment:
Under impacts of two shocks: Price increases, Quantity is unknown.
Note: If there is more than 1 shock on the market, it could be the case that one factor (either price or
quantity), we cannot predict the trend.
Tips (to find unknown P or Q) draw the special cases: when effects of one shock is significant and effects of another is slight. III.The government policy 3.1. Tax and Subsidy Policy Some remarks on tax/subsidy: - There are two types of tax:
o Quantity tax: taxing on a product: t/product Total amount of tax payment depends on the quantity of produced goods
o Lump-sum tax: The fixed tax (T) regardless of quantity of produced goods, firms only pay the fixed amount of tax. -
Tax/subsidy can be imposed on either sellers or buyers
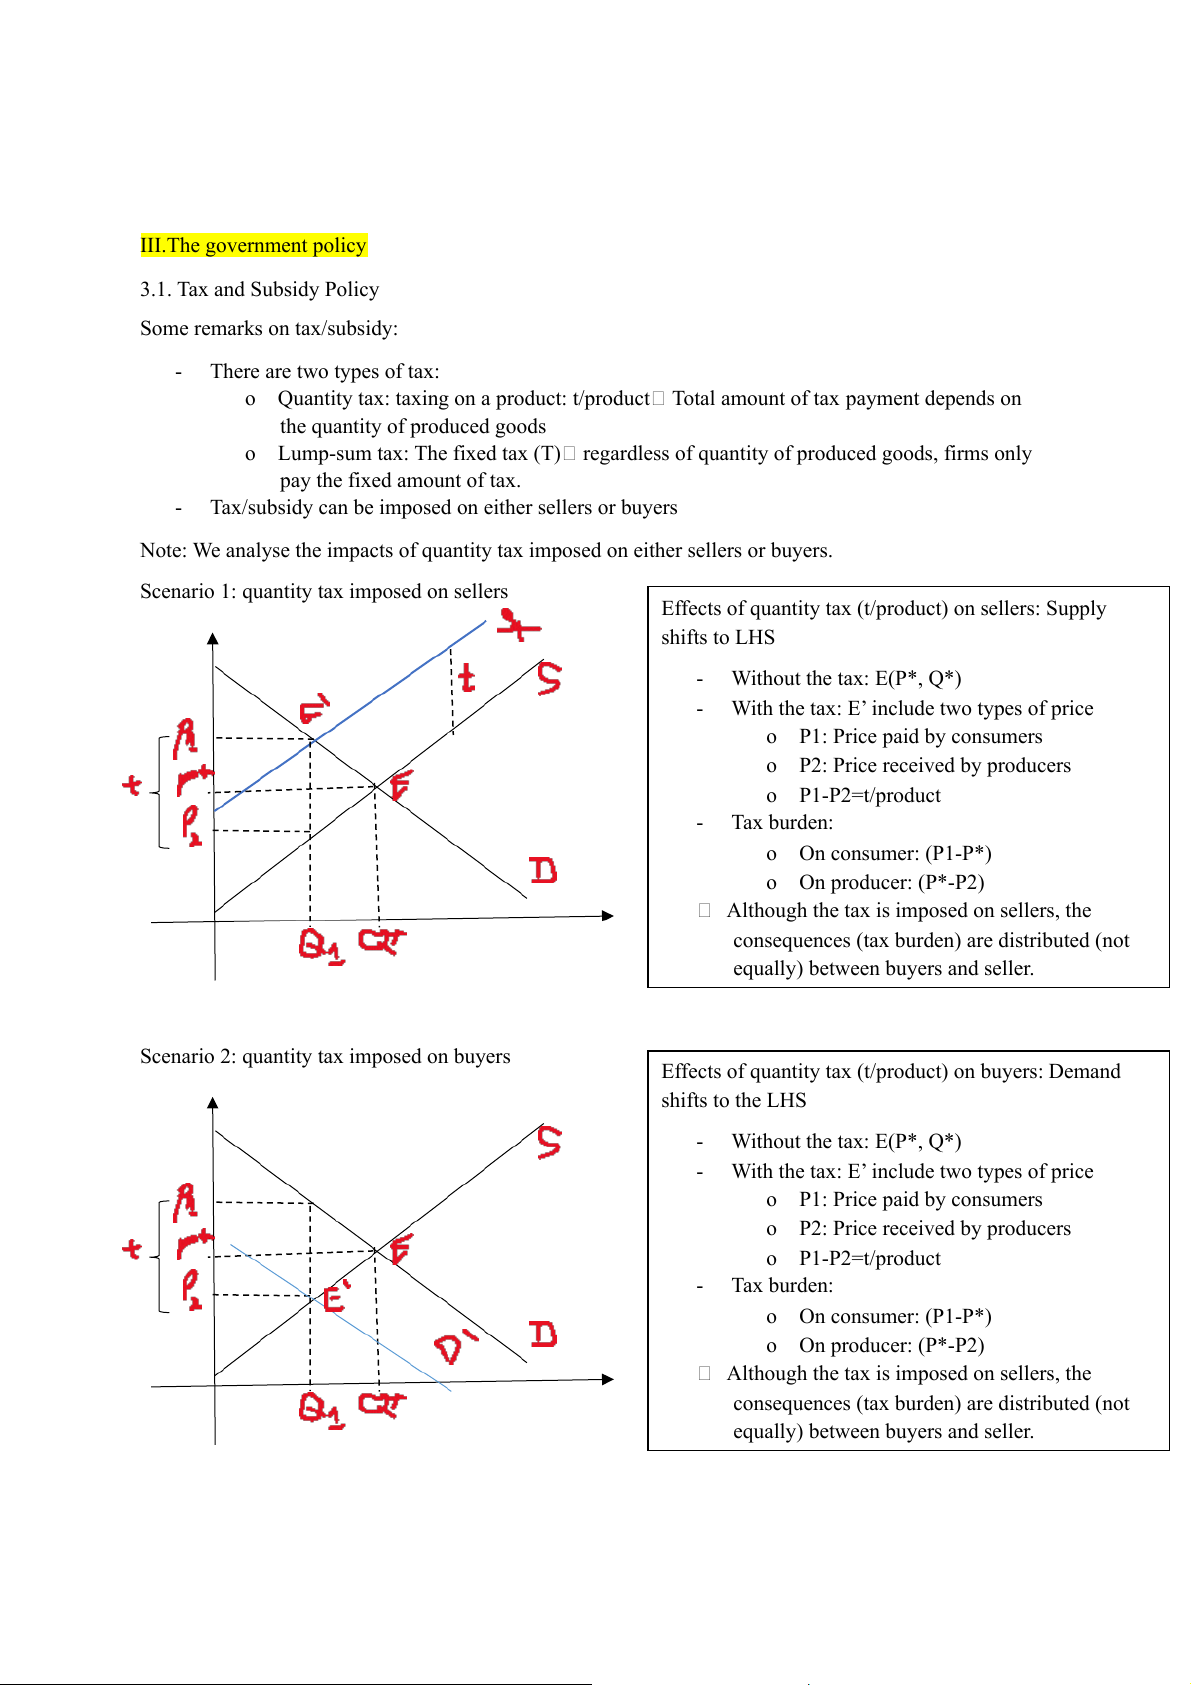
Note: We analyse the impacts of quantity tax imposed on either sellers or buyers.
Scenario 1: quantity tax imposed on sellers
Effects of quantity tax (t/product) on sellers: Supply shifts to LHS - Without the tax: E(P*, Q*) -
With the tax: E’ include two types of price o P1: Price paid by consumers
o P2: Price received by producers o P1-P2=t/product - Tax burden: o On consumer: (P1-P*) o On producer: (P*-P2)
Although the tax is imposed on sellers, the
consequences (tax burden) are distributed (not
equally) between buyers and seller.
Scenario 2: quantity tax imposed on buyers
Effects of quantity tax (t/product) on buyers: Demand shifts to the LHS - Without the tax: E(P*, Q*) -
With the tax: E’ include two types of price o P1: Price paid by consumers
o P2: Price received by producers o P1-P2=t/product - Tax burden: o On consumer: (P1-P*) o On producer: (P*-P2)
Although the tax is imposed on sellers, the
consequences (tax burden) are distributed (not
equally) between buyers and seller. 3.2. Price control E.g.,
Price control for the pork market in Vietnam
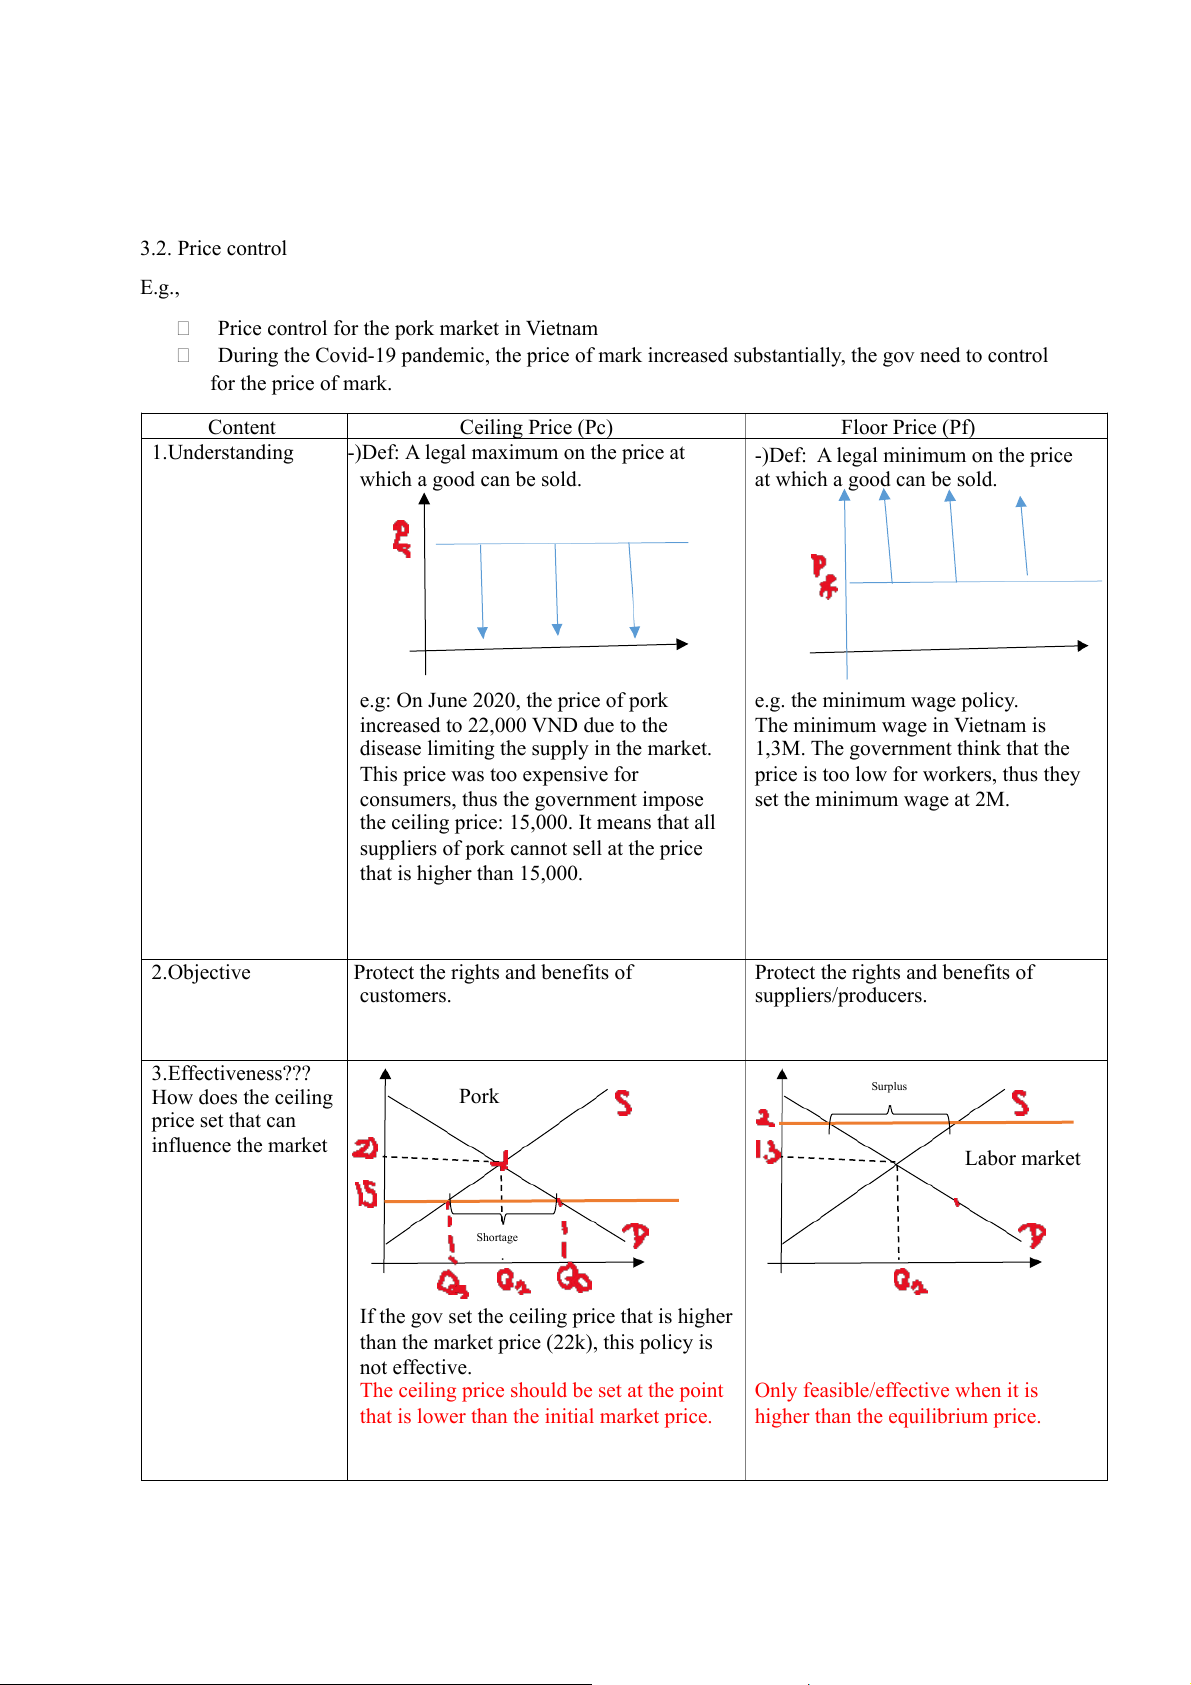
During the Covid-19 pandemic, the price of mark increased substantially, the gov need to control for the price of mark. Content Ceiling Price (Pc) Floor Price (Pf) 1.Understanding
-)Def: A legal maximum on the price at
-)Def: A legal minimum on the price which a good can be sold. at which a good can be sold.
e.g: On June 2020, the price of pork e.g. the minimum wage policy.
increased to 22,000 VND due to the
The minimum wage in Vietnam is
disease limiting the supply in the market.
1,3M. The government think that the
This price was too expensive for
price is too low for workers, thus they
consumers, thus the government impose set the minimum wage at 2M.
the ceiling price: 15,000. It means that all
suppliers of pork cannot sell at the price that is higher than 15,000. 2.Objective
Protect the rights and benefits of
Protect the rights and benefits of customers. suppliers/producers. 3.Effectiveness??? How does the ceiling Pork Surplus price set that can influence the market Labor market Shortage
If the gov set the ceiling price that is higher
than the market price (22k), this policy is not effective.
The ceiling price should be set at the point
Only feasible/effective when it is
that is lower than the initial market price.
higher than the equilibrium price. 4.Consequences
Advantage: price immediately return to
Advantage: price immediately increase the price target. to the price target.
Disadvantages: Qd increases while Qs
Disadvantages: Qd decreases while Qs decreases Shortage=Qd-Qs increases Surplus=Qs-Qd Consequences:
-)There is not enough goods in the market.
-)The consumers buy the lower-quality products. Discussion
What is the better solution to the pork
Minimum wage policy will decreases market?
the demand for employees, while labor -
Increase the supply of pork by
supply increases the unemployment importing the pork.
rate increases due to the minimum Analyse this policy??? wage policy.
The unemployment happens mostly for
In spite of consequences, the gov should
the basic workers (low skill, without
consider the ceiling price to protect the education…)
consumers after the serious disasters like
drought… the price of goods increases dramatically. Recommendation
If the government solely impose the price control, the market will be negatively
affected. Therefore, the supporting policies need to consider together with the price control.
Tài liệu liên quan:
-

Chương 3: độ co giãn và các nhân tố ảnh hưởng | Microeconomics | Trường Đại học Quốc tế, Đại học Quốc gia Thành phố Hồ Chí Minh
3 2 -

Microeconomics Syllabus | Microeconomics | Trường Đại học Quốc tế, Đại học Quốc gia Thành phố Hồ Chí Minh
3 2 -

Microeconomics Course Syllabus & Assessment Details | Microeconomics | Trường Đại học Quốc tế, Đại học Quốc gia Thành phố Hồ Chí Minh
3 2 -

Assignment 3 - Elasticity MCQs and Key Concepts | Microeconomics | Trường Đại học Quốc tế, Đại học Quốc gia Thành phố Hồ Chí Minh
3 2 -

Assignment 2 - Economic Equilibrium Analysis of Fridges and Motorcycles | Microeconomics | Trường Đại học Quốc tế, Đại học Quốc gia Thành phố Hồ Chí Minh
3 2