Microeconomics Assignment 3 - Demand Impacts of Hurricane Katrina | Microeconomics | Trường Đại học Quốc tế, Đại học Quốc gia Thành phố Hồ Chí Minh
Hurricane Katrina caused a storm surge and levee break that flooded much of New Orleans and destroyed a large fraction of the city’s housing. Hundreds of thousands of residents were displaced, and about 250,000 relocated to nearby Baton Rouge. An increase in the population of Baton Rouge increases the demand for housing, shifting the demand curve to the right. Tài liệu được sưu tầm và soạn thảo dưới dạng file PDF để gửi tới các bạn cùng tham khảo, ôn tập đầy đủ kiến thức, chuẩn bị cho các buổi học thật tốt. Mời bạn đọc đón xem!
Môn: Microeconomics 635 tài liệu
Trường: Trường Đại học Quốc tế, Đại học Quốc gia Thành phố Hồ Chí Minh 1.9 K tài liệu
Tác giả:
Preview text:
Name: Nguyen Quang Ha - EBDB 5 Assignment Presentation 3 Exercise 1:
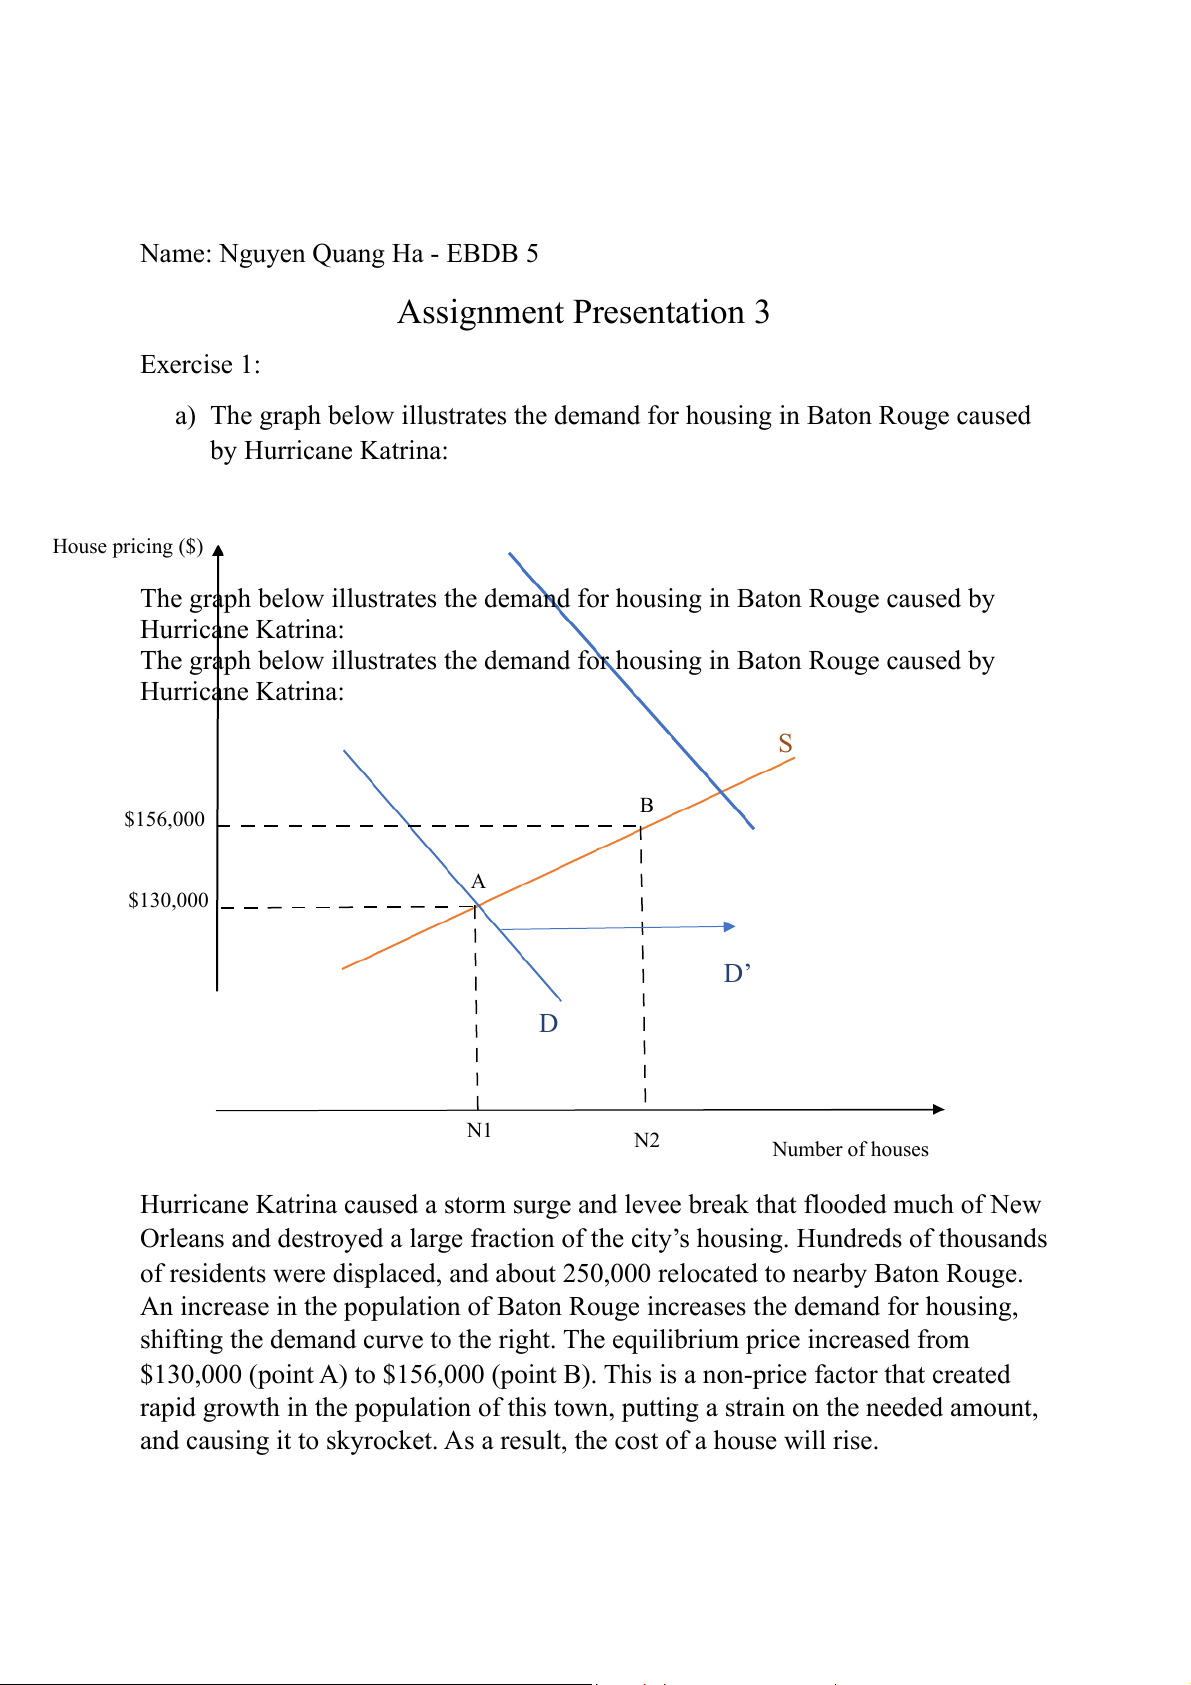
a) The graph below illustrates the demand for housing in Baton Rouge caused by Hurricane Katrina: House pricing ($)
The graph below illustrates the demand for housing in Baton Rouge caused by Hurricane Katrina:
The graph below illustrates the demand for housing in Baton Rouge caused by Hurricane Katrina: S B $156,000 A $130,000 D’ D N1 N2 Number of houses
Hurricane Katrina caused a storm surge and levee break that flooded much of New
Orleans and destroyed a large fraction of the city’s housing. Hundreds of thousands
of residents were displaced, and about 250,000 relocated to nearby Baton Rouge.
An increase in the population of Baton Rouge increases the demand for housing,
shifting the demand curve to the right. The equilibrium price increased from
$130,000 (point A) to $156,000 (point B). This is a non-price factor that created
rapid growth in the population of this town, putting a strain on the needed amount,
and causing it to skyrocket. As a result, the cost of a house will rise.
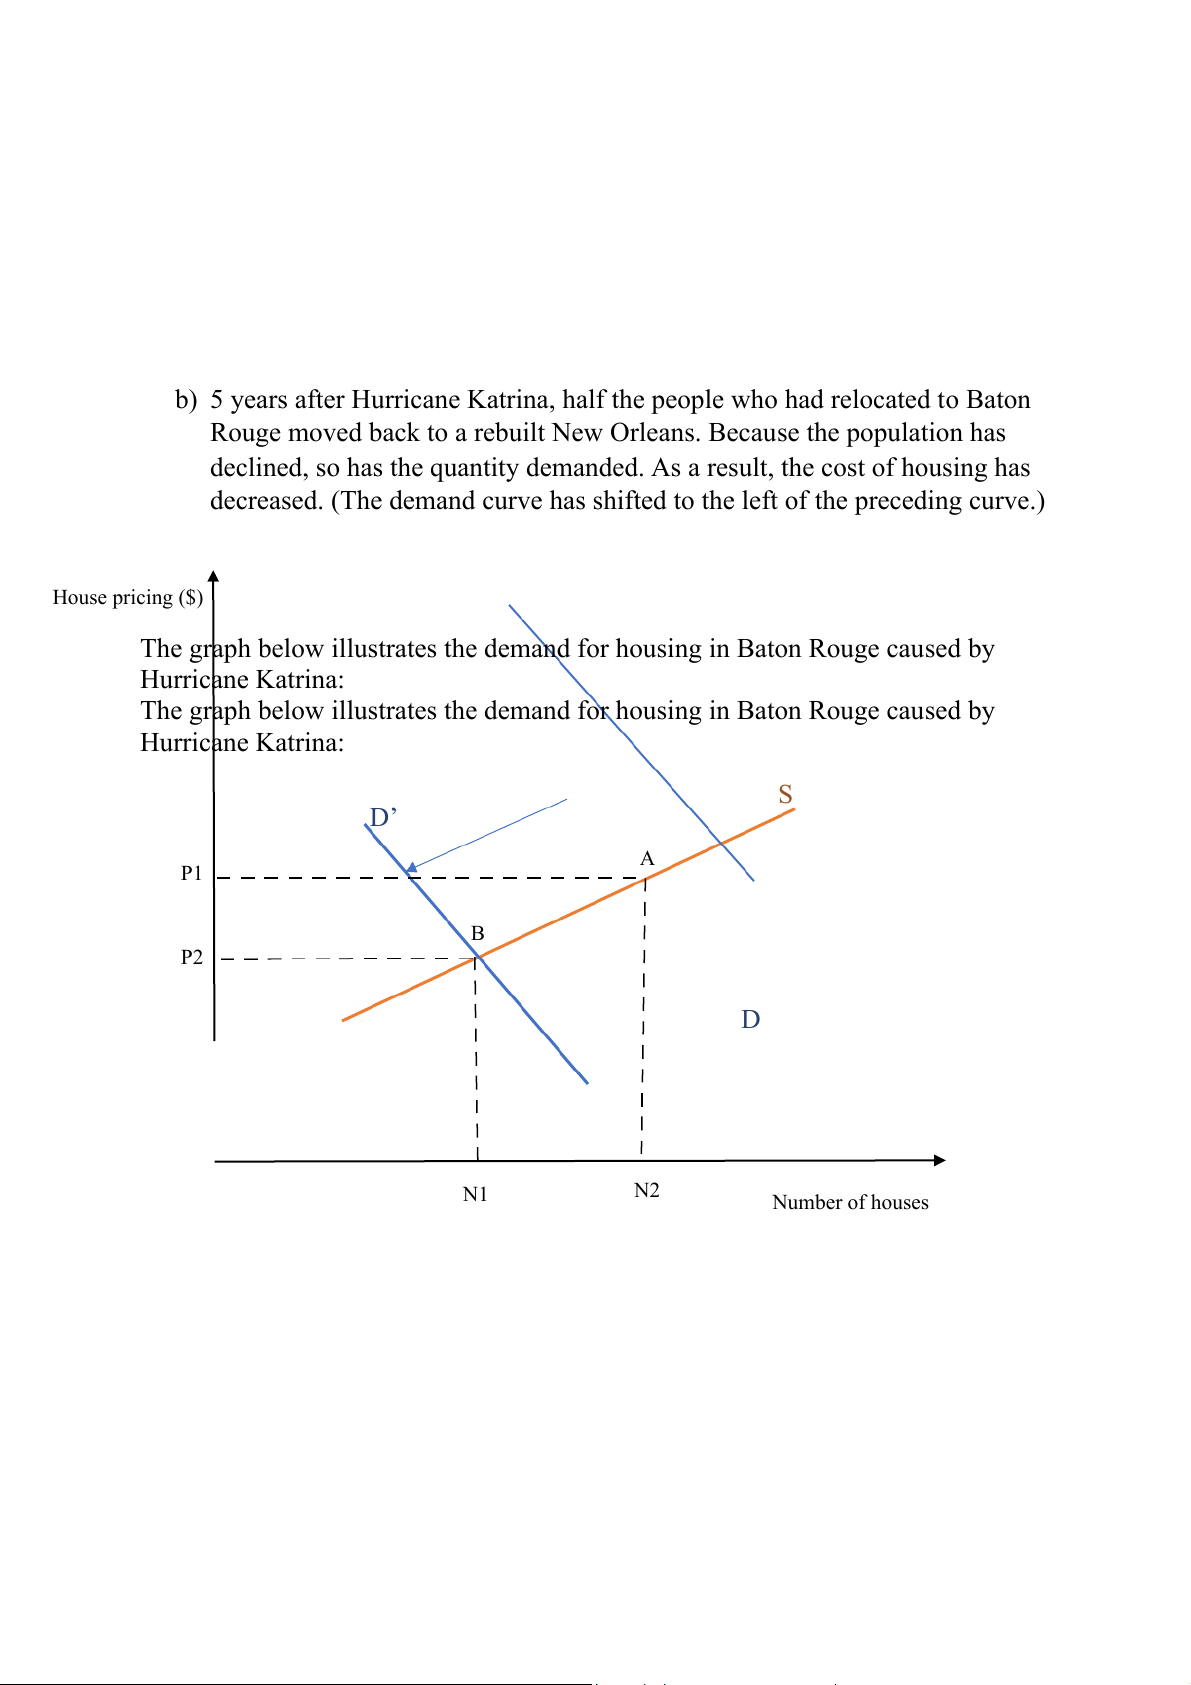
b) 5 years after Hurricane Katrina, half the people who had relocated to Baton
Rouge moved back to a rebuilt New Orleans. Because the population has
declined, so has the quantity demanded. As a result, the cost of housing has
decreased. (The demand curve has shifted to the left of the preceding curve.) House pricing ($)
The graph below illustrates the demand for housing in Baton Rouge caused by Hurricane Katrina:
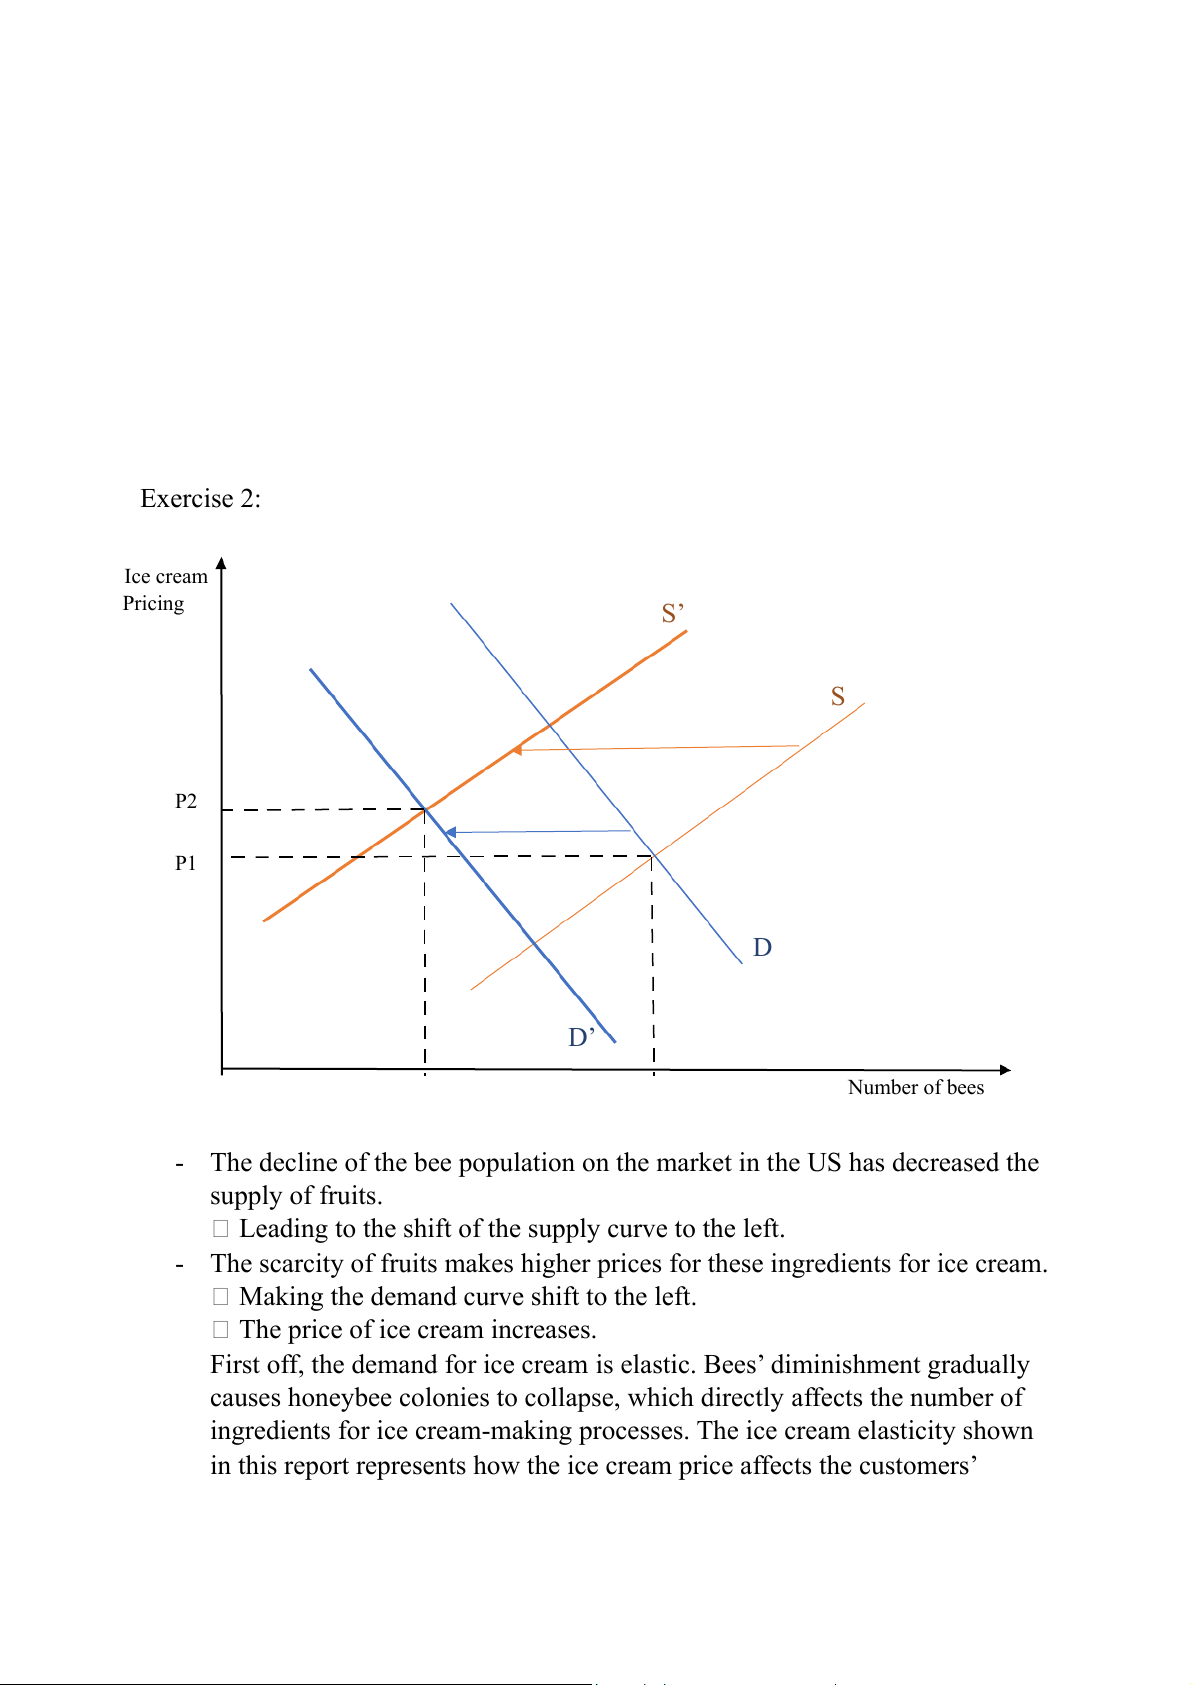
The graph below illustrates the demand for housing in Baton Rouge caused by Hurricane Katrina: S D’ A P1 B P2 D N1 N2 Number of houses Exercise 2: Ice cream Pricing S’ S P2 P1 D D’ Number of bees
- The decline of the bee population on the market in the US has decreased the supply of fruits.
Leading to the shift of the supply curve to the left.
- The scarcity of fruits makes higher prices for these ingredients for ice cream.
Making the demand curve shift to the left.
The price of ice cream increases.
First off, the demand for ice cream is elastic. Bees’ diminishment gradually
causes honeybee colonies to collapse, which directly affects the number of
ingredients for ice cream-making processes. The ice cream elasticity shown
in this report represents how the ice cream price affects the customers’
demands. The demand curve is predicted to strongly shift to the left as the
supplement begins to show its scarcity in producing products. In general, the
decline of the bee population will affect the market for ice cream roughly as
ice cream is an elastic product. Exercise 3: a,
- Percentage change in price: %
- Percentage change in quantity: %
Price elasticity of demand is: E D p => Elastic b,
With the promotional vouchers of two meals for the price of one, the
Binh’s monthly expenditure on meals at this restaurant increases from
1 meal per month to 3 meals per month.
Binh's monthly spending on meals at this restaurant increased
(specifically increased by $10).
When price decreases, total revenue increases.
=> The change in total expenditure is completely consistent
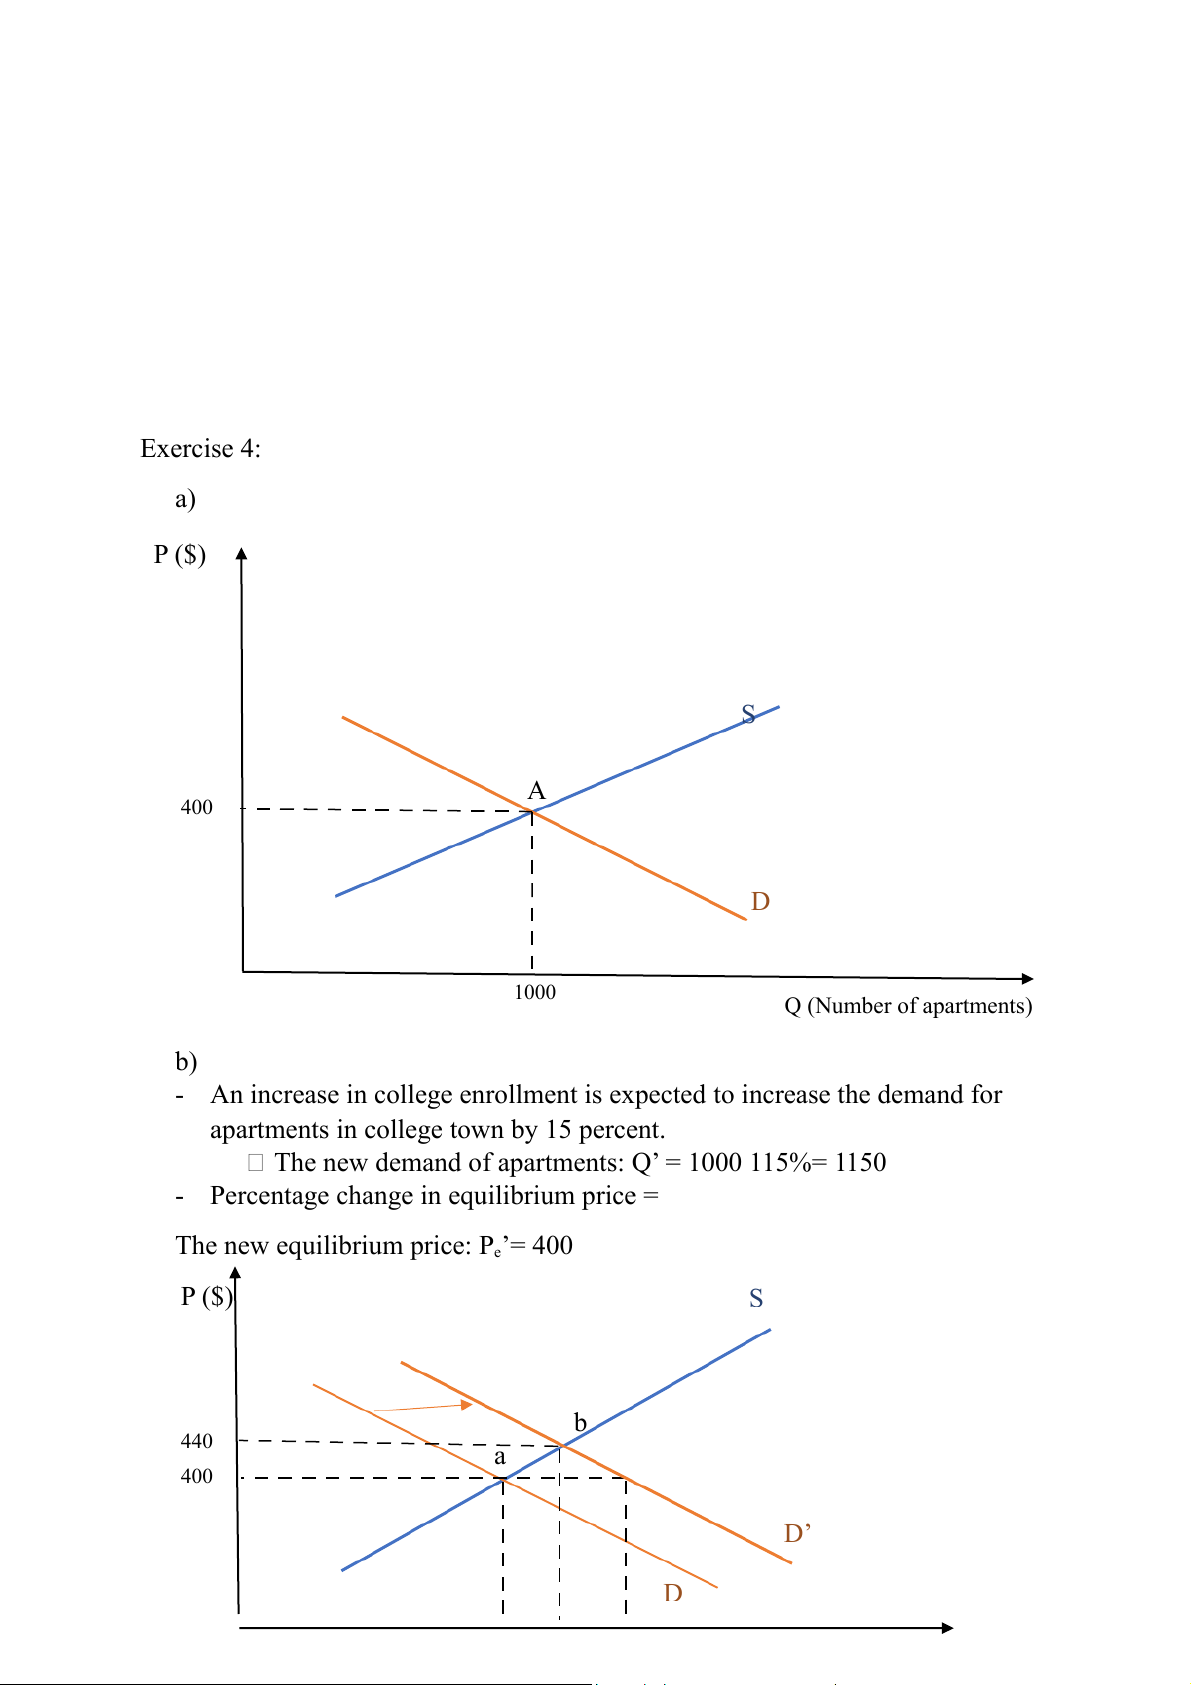
with the calculated demand value (E D p >1: elastic). Exercise 4: a) P ($) S A 400 D 1000 Q (Number of apartments) b)
- An increase in college enrollment is expected to increase the demand for
apartments in college town by 15 percent.
The new demand of apartments: Q’ = 1000 115%= 1150
- Percentage change in equilibrium price =
The new equilibrium price: Pe’= 400 P ($) S b 440 a 400 D’ D
c, A 15% increase in demand for apartments will increase the equilibrium price of apartments by 10%. Exercise 5:
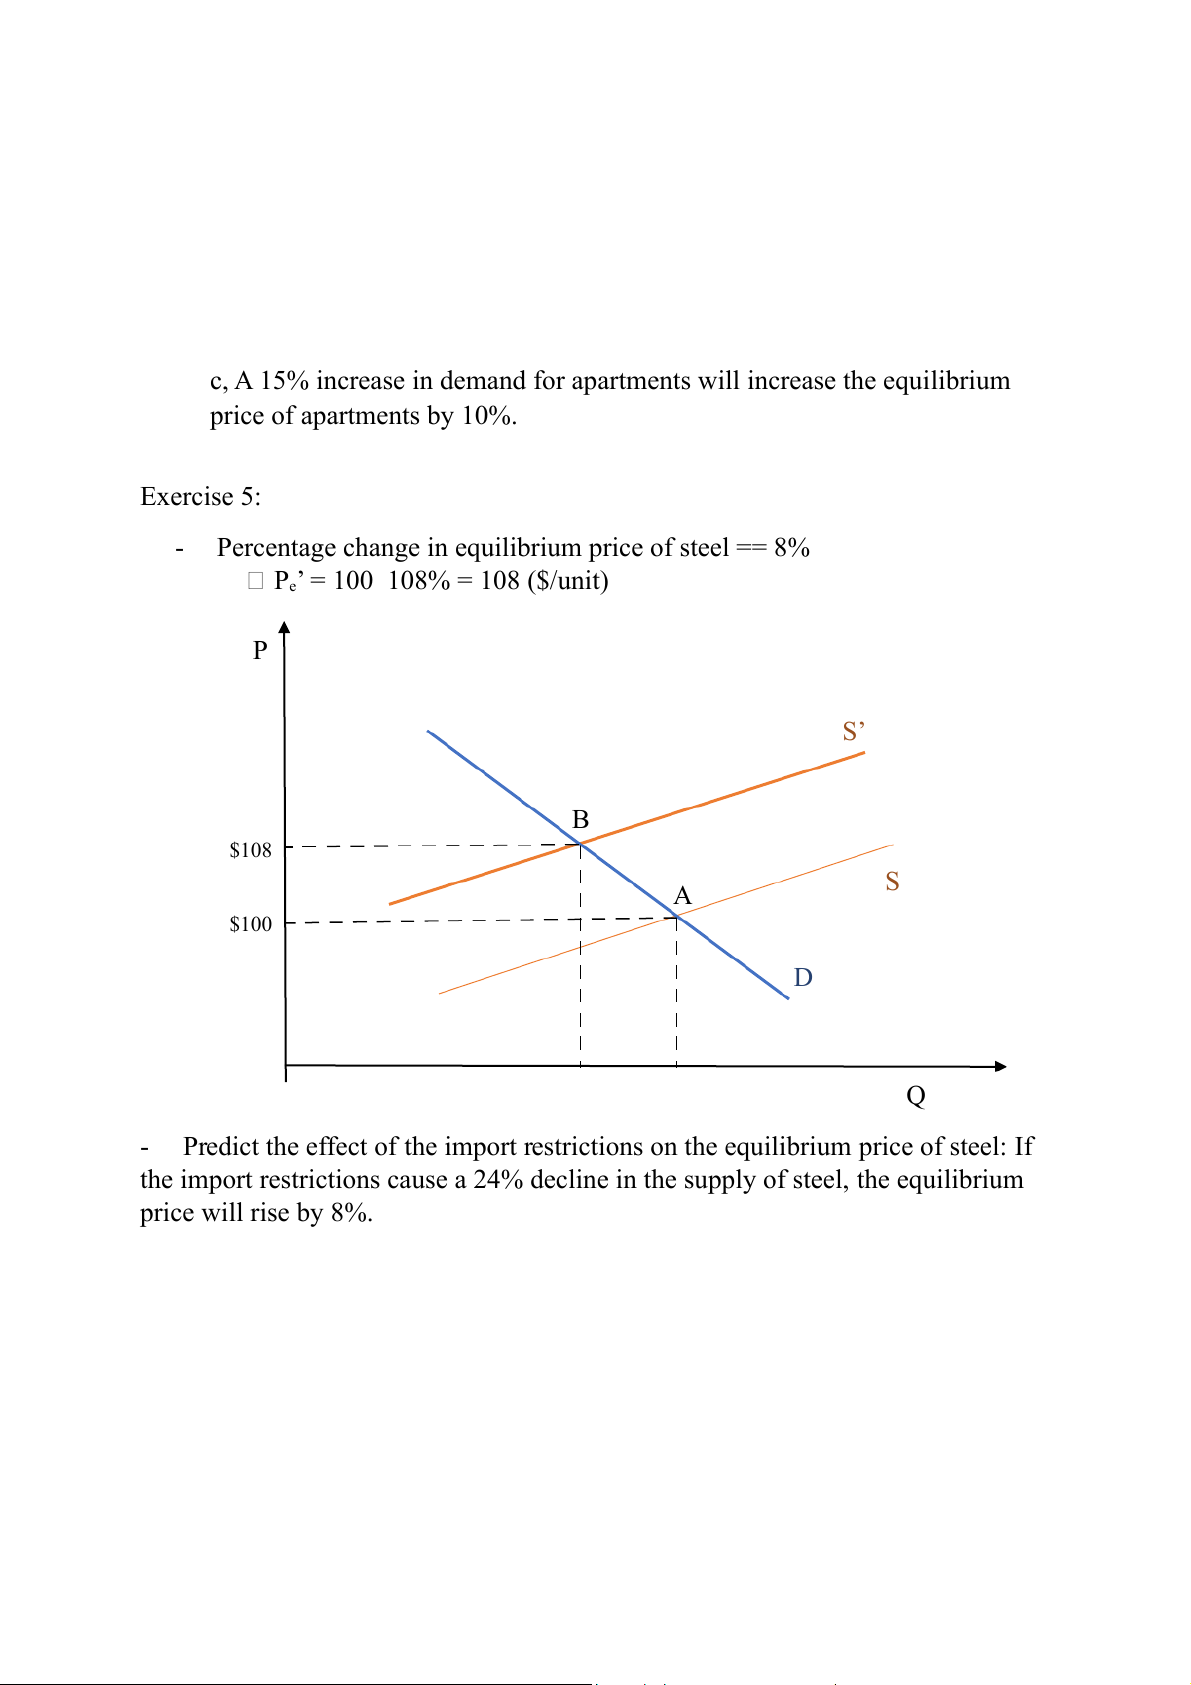
- Percentage change in equilibrium price of steel == 8%
Pe’ = 100 108% = 108 ($/unit) P S’ B $108 S A $100 D Q
- Predict the effect of the import restrictions on the equilibrium price of steel: If
the import restrictions cause a 24% decline in the supply of steel, the equilibrium price will rise by 8%.
Tài liệu liên quan:
-

Chương 3: độ co giãn và các nhân tố ảnh hưởng | Microeconomics | Trường Đại học Quốc tế, Đại học Quốc gia Thành phố Hồ Chí Minh
3 2 -

Microeconomics Syllabus | Microeconomics | Trường Đại học Quốc tế, Đại học Quốc gia Thành phố Hồ Chí Minh
3 2 -

Microeconomics Course Syllabus & Assessment Details | Microeconomics | Trường Đại học Quốc tế, Đại học Quốc gia Thành phố Hồ Chí Minh
3 2 -

Assignment 3 - Elasticity MCQs and Key Concepts | Microeconomics | Trường Đại học Quốc tế, Đại học Quốc gia Thành phố Hồ Chí Minh
3 2 -

Assignment 2 - Economic Equilibrium Analysis of Fridges and Motorcycles | Microeconomics | Trường Đại học Quốc tế, Đại học Quốc gia Thành phố Hồ Chí Minh
3 2