Microeconomics - Group 3 Assignment Presentation 1 | Microeconomics | Trường Đại học Quốc tế, Đại học Quốc gia Thành phố Hồ Chí Minh
The output of this economy at point H is 6 million cars and 20 thousand guided missiles. ● H has the same output of cars as D but different in the output of guided missiles. In this graph, H shows 8 more thousand guided missiles than D. - In order to attain point H, the economy needs to ● Develop production technology ● Improve the quality of labor force ● Attract more investment. Tài liệu được sưu tầm và soạn thảo dưới dạng file PDF để gửi tới các bạn cùng tham khảo, ôn tập đầy đủ kiến thức, chuẩn bị cho các buổi học thật tốt. Mời bạn đọc đón xem!
Môn: Microeconomics 635 tài liệu
Trường: Trường Đại học Quốc tế, Đại học Quốc gia Thành phố Hồ Chí Minh 1.9 K tài liệu
Tác giả:
Preview text:
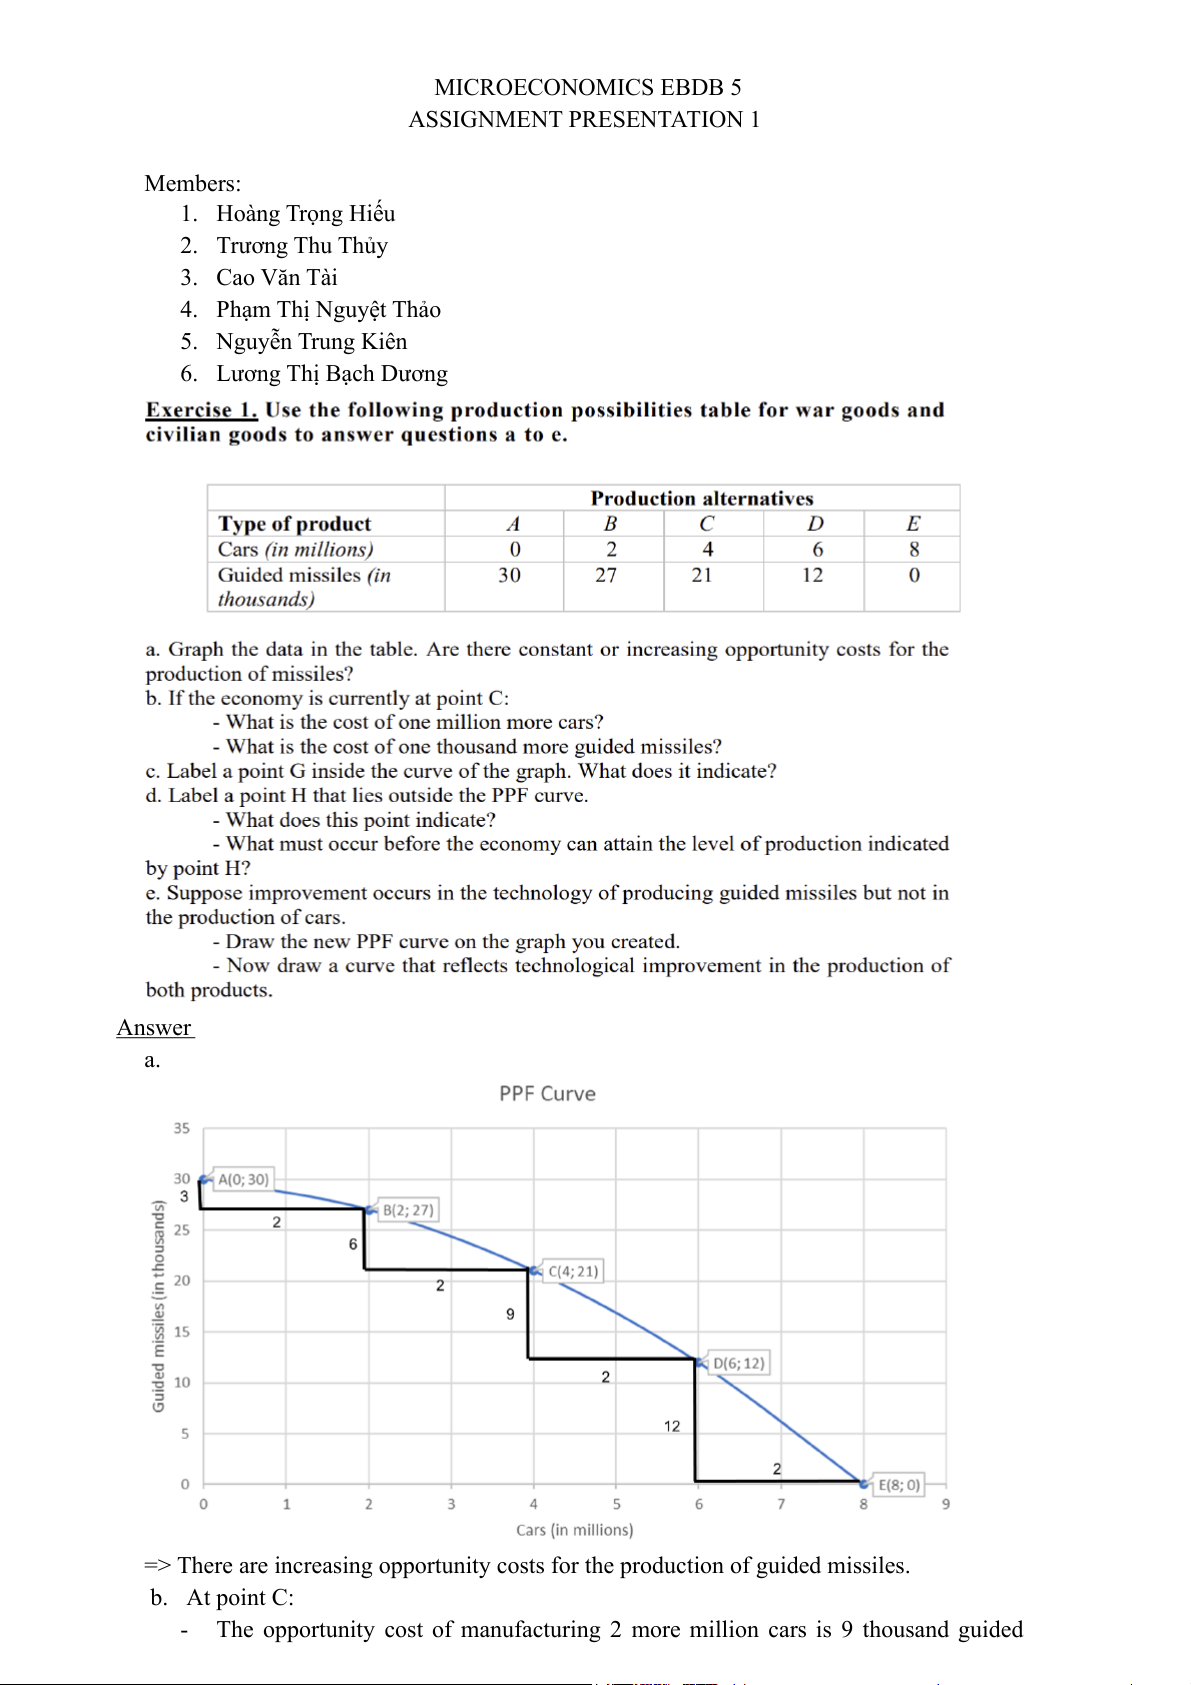
MICROECONOMICS EBDB 5 ASSIGNMENT PRESENTATION 1 Members: 1. Hoàng Trọng Hiếu 2. Trương Thu Thủy 3. Cao Văn Tài
4. Phạm Thị Nguyệt Thảo 5. Nguyễn Trung Kiên
6. Lương Thị Bạch Dương Answer a.
=> There are increasing opportunity costs for the production of guided missiles. b. At point C: -
The opportunity cost of manufacturing 2 more million cars is 9 thousand guided missiles.
=> The cost of 1 million more cars is 4.5 thousand guided missiles. -
The opportunity cost of 6 more thousand guided missiles is 2 million cars.
=> The cost of 1 thousand more guided missiles is ⅓ million cars. c. -
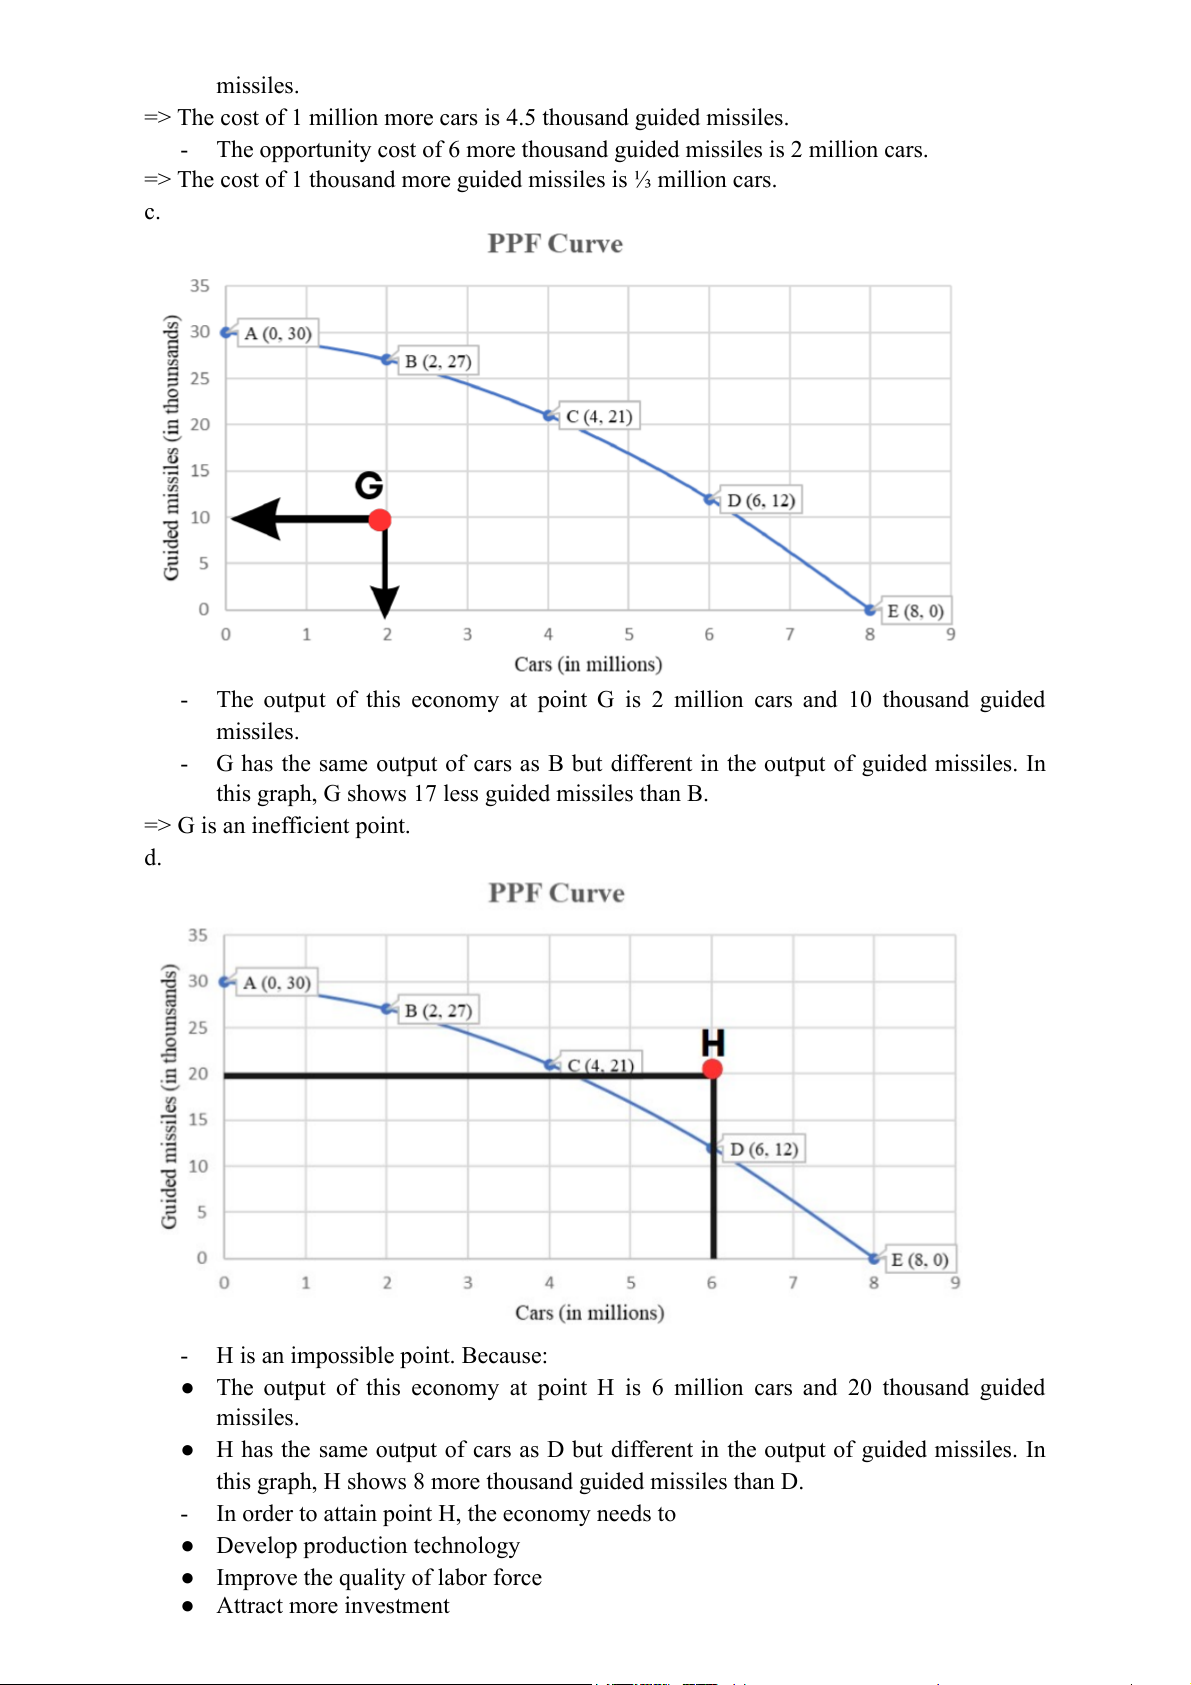
The output of this economy at point G is 2 million cars and 10 thousand guided missiles. -
G has the same output of cars as B but different in the output of guided missiles. In
this graph, G shows 17 less guided missiles than B.
=> G is an inefficient point. d. -
H is an impossible point. Because:
● The output of this economy at point H is 6 million cars and 20 thousand guided missiles.
● H has the same output of cars as D but different in the output of guided missiles. In
this graph, H shows 8 more thousand guided missiles than D. -
In order to attain point H, the economy needs to
● Develop production technology
● Improve the quality of labor force ● Attract more investment e. -
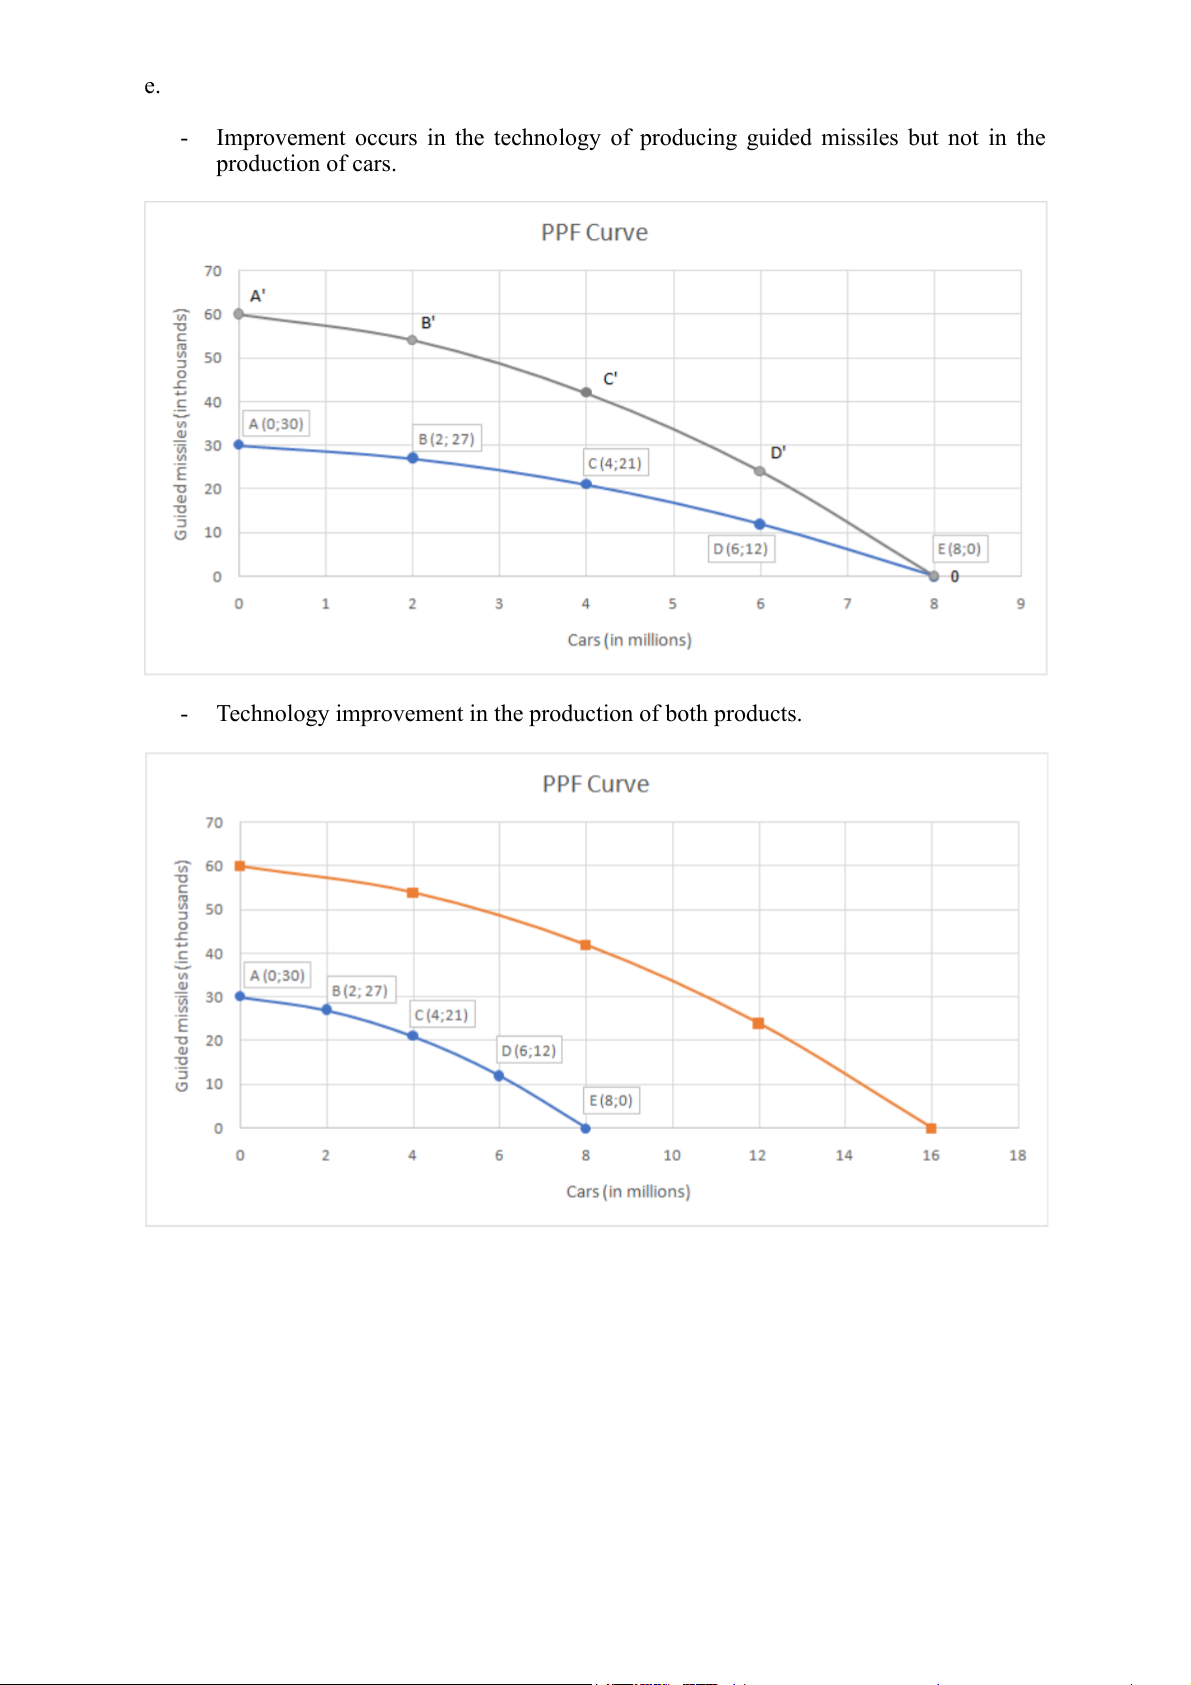
Improvement occurs in the technology of producing guided missiles but not in the production of cars. -
Technology improvement in the production of both products.
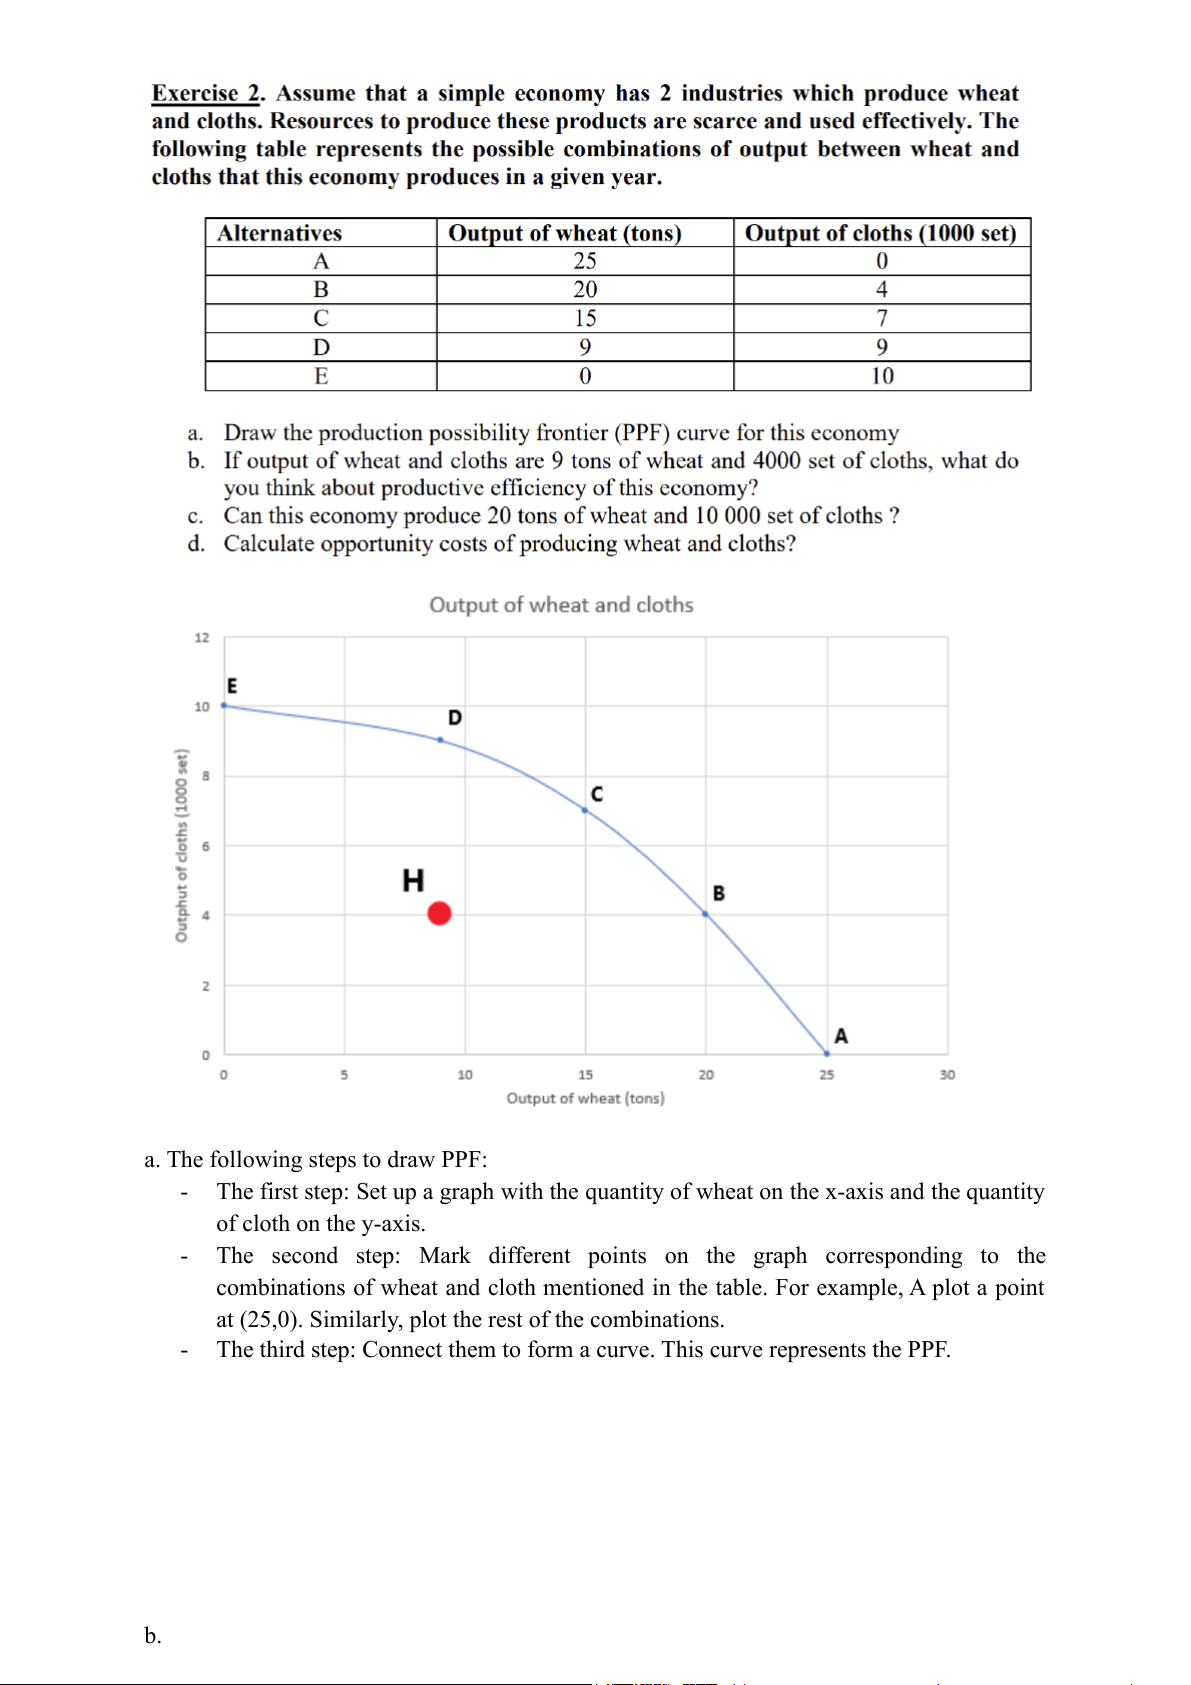
a. The following steps to draw PPF: -
The first step: Set up a graph with the quantity of wheat on the x-axis and the quantity of cloth on the y-axis. -
The second step: Mark different points on the graph corresponding to the
combinations of wheat and cloth mentioned in the table. For example, A plot a point
at (25,0). Similarly, plot the rest of the combinations. -
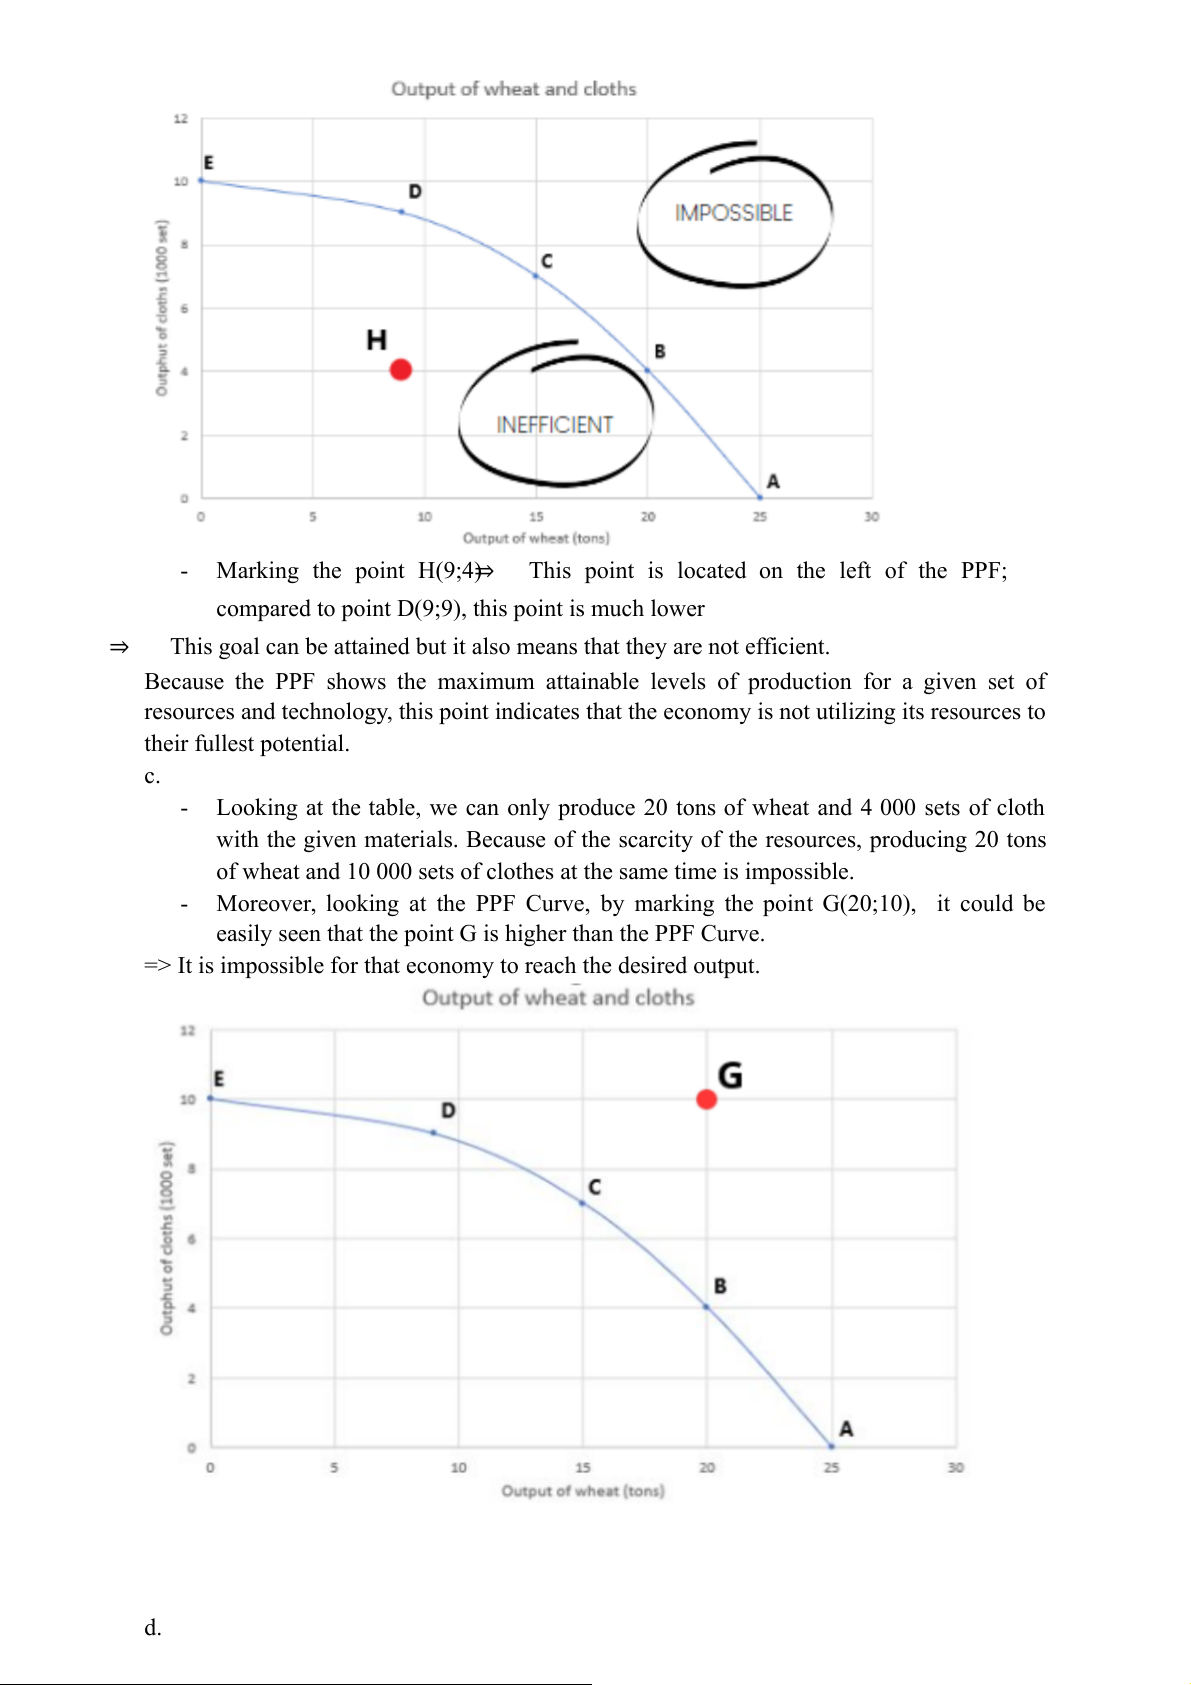
The third step: Connect them to form a curve. This curve represents the PPF. b. - Marking the point H(9;4)
⇒ This point is located on the left of the PPF;
compared to point D(9;9), this point is much lower ⇒
This goal can be attained but it also means that they are not efficient.
Because the PPF shows the maximum attainable levels of production for a given set of
resources and technology, this point indicates that the economy is not utilizing its resources to their fullest potential. c. -
Looking at the table, we can only produce 20 tons of wheat and 4 000 sets of cloth
with the given materials. Because of the scarcity of the resources, producing 20 tons
of wheat and 10 000 sets of clothes at the same time is impossible. -
Moreover, looking at the PPF Curve, by marking the point G(20;10), it could be
easily seen that the point G is higher than the PPF Curve.
=> It is impossible for that economy to reach the desired output. d. -
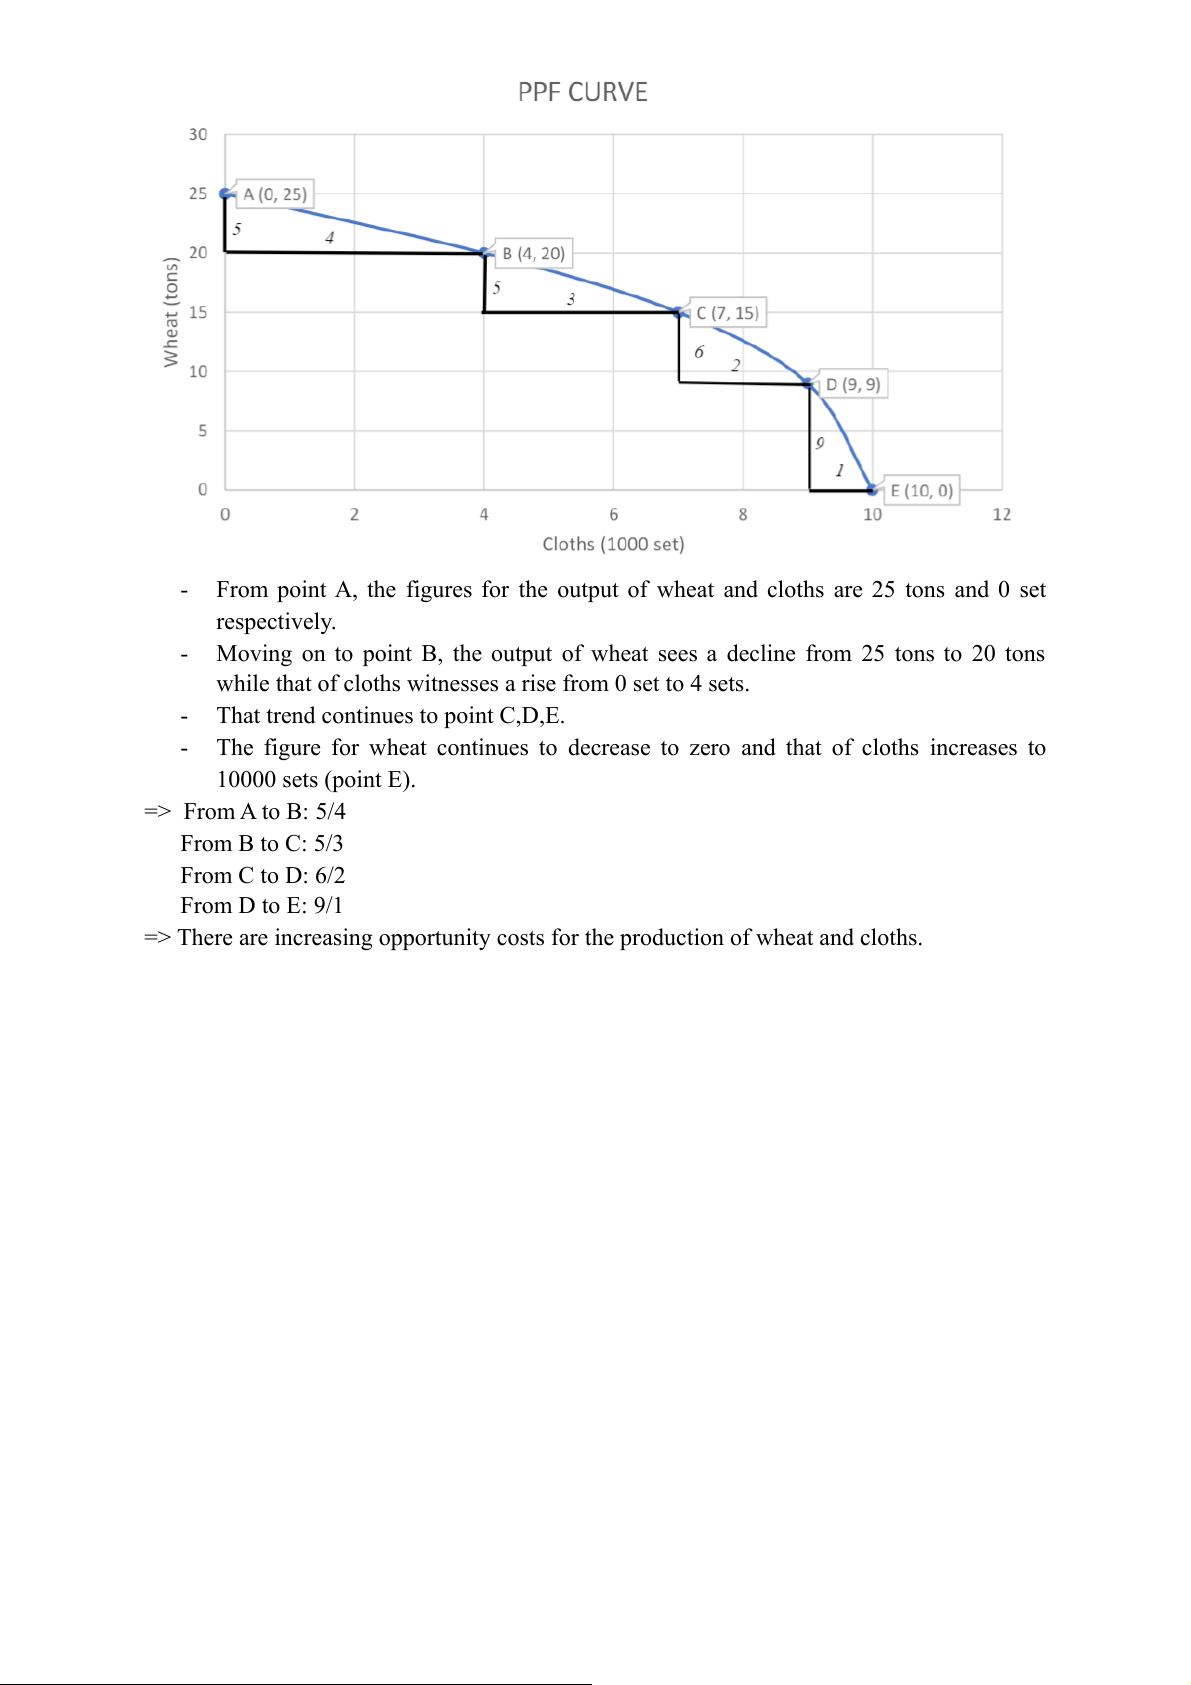
From point A, the figures for the output of wheat and cloths are 25 tons and 0 set respectively. -
Moving on to point B, the output of wheat sees a decline from 25 tons to 20 tons
while that of cloths witnesses a rise from 0 set to 4 sets. -
That trend continues to point C,D,E. -
The figure for wheat continues to decrease to zero and that of cloths increases to 10000 sets (point E). => From A to B: 5/4 From B to C: 5/3 From C to D: 6/2 From D to E: 9/1
=> There are increasing opportunity costs for the production of wheat and cloths.
Tài liệu liên quan:
-

Chương 3: độ co giãn và các nhân tố ảnh hưởng | Microeconomics | Trường Đại học Quốc tế, Đại học Quốc gia Thành phố Hồ Chí Minh
3 2 -

Microeconomics Syllabus | Microeconomics | Trường Đại học Quốc tế, Đại học Quốc gia Thành phố Hồ Chí Minh
3 2 -

Microeconomics Course Syllabus & Assessment Details | Microeconomics | Trường Đại học Quốc tế, Đại học Quốc gia Thành phố Hồ Chí Minh
3 2 -

Assignment 3 - Elasticity MCQs and Key Concepts | Microeconomics | Trường Đại học Quốc tế, Đại học Quốc gia Thành phố Hồ Chí Minh
3 2 -

Assignment 2 - Economic Equilibrium Analysis of Fridges and Motorcycles | Microeconomics | Trường Đại học Quốc tế, Đại học Quốc gia Thành phố Hồ Chí Minh
3 2