Microeconomics Group Assignment 1: Production Possibilities Analysis | Microeconomics | Trường Đại học Quốc tế, Đại học Quốc gia Thành phố Hồ Chí Minh
- From E to D: To produce 12 thousand more guided missiles, the economy gives up 2 million cars. Therefore, the opportunity costs of 1 thousand more guided missiles are 2/12 = 1/6 million cars. - From D to C: The opportunity costs of 1 thousand more guided missiles are 2/9 million cars. Tài liệu được sưu tầm và soạn thảo dưới dạng file PDF để gửi tới các bạn cùng tham khảo, ôn tập đầy đủ kiến thức, chuẩn bị cho các buổi học thật tốt. Mời bạn đọc đón xem!
Môn: Microeconomics 635 tài liệu
Trường: Trường Đại học Quốc tế, Đại học Quốc gia Thành phố Hồ Chí Minh 1.9 K tài liệu
Tác giả:


Preview text:
Group Assignment Presentation 1 Team 8 Member: Nguyen Quang Ha Ngo Thi Thanh Lan Le Thanh Nam Dao Duy Anh Nguyen Ngoc Minh Chi
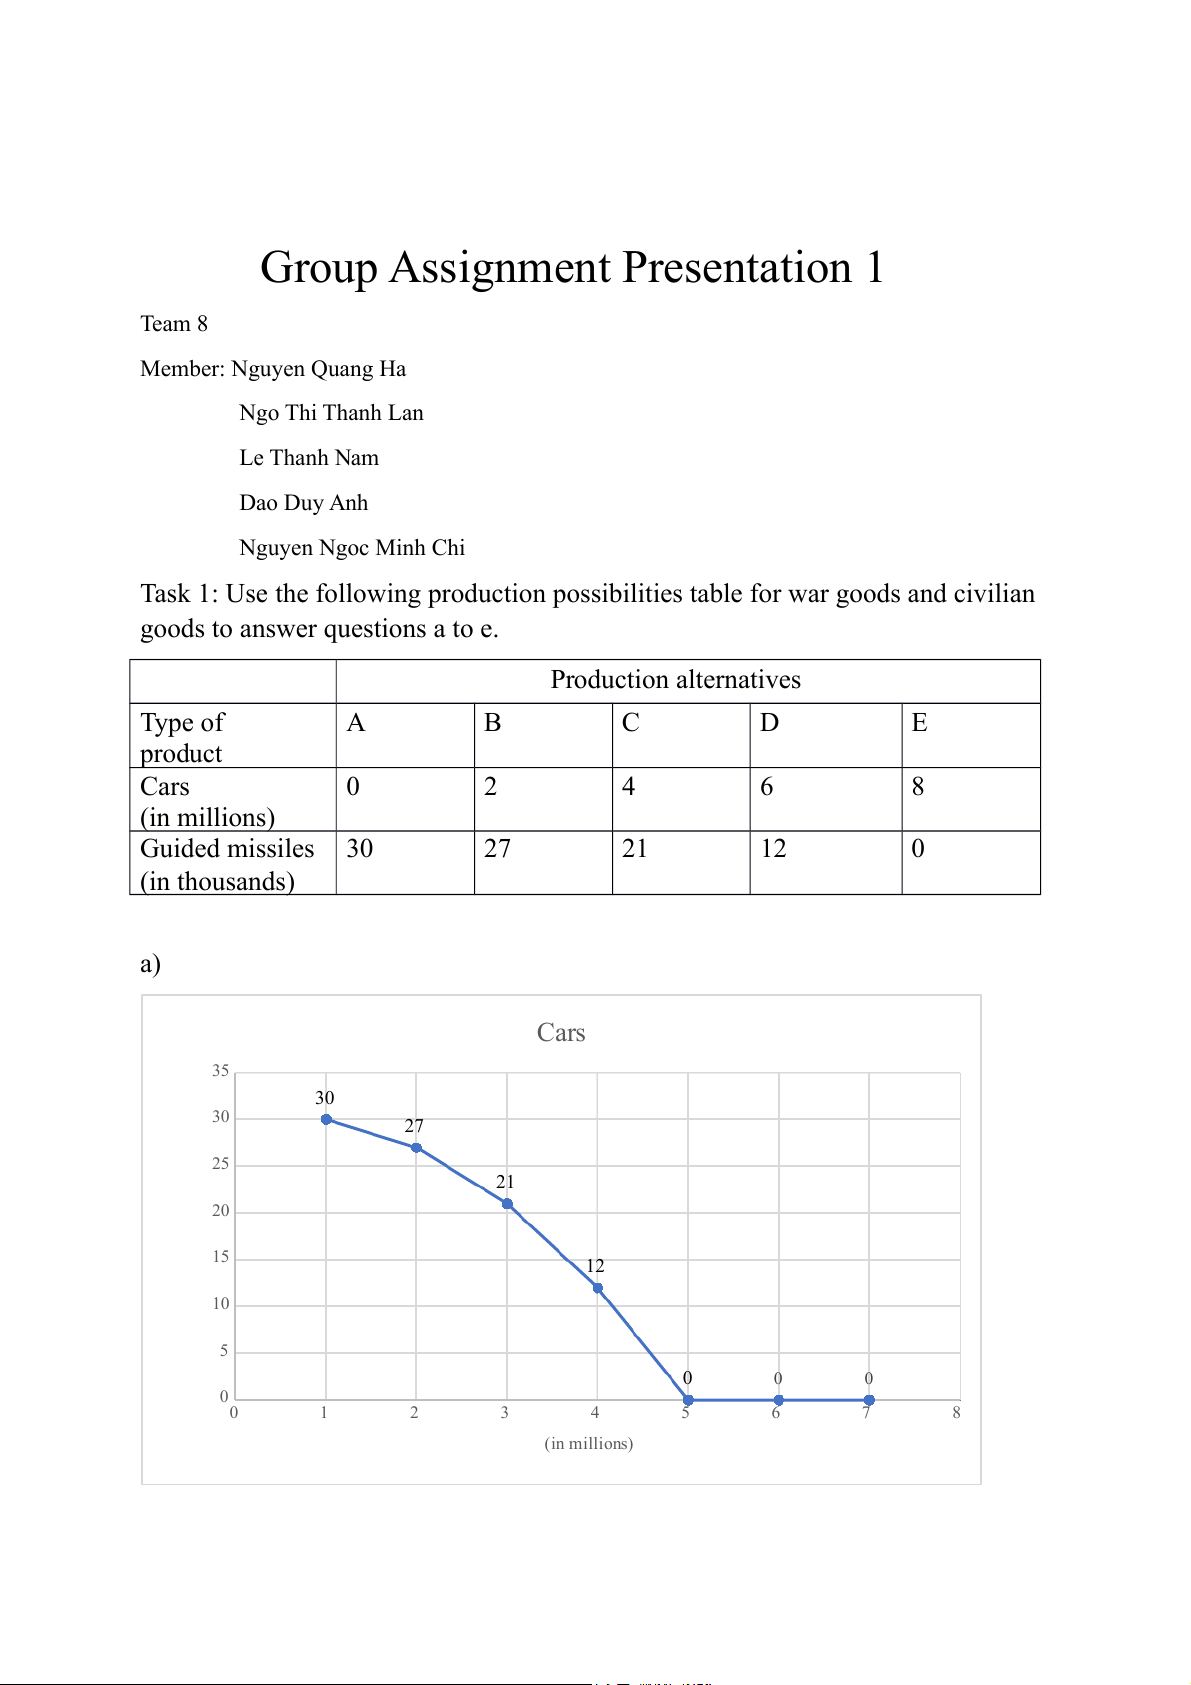
Task 1: Use the following production possibilities table for war goods and civilian
goods to answer questions a to e. Production alternatives Type of A B C D E product Cars 0 2 4 6 8 (in millions) Guided missiles 30 27 21 12 0 (in thousands) a) Cars 35 30 30 27 25 s 21 ile 20 iss d m 15 12 uide G 10 5 0 0 0 00 1 2 3 4 5 6 7 8 (in millions)
- From E to D: To produce 12 thousand more guided missiles, the economy gives
up 2 million cars. Therefore, the opportunity costs of 1 thousand more guided
missiles are 2/12 = 1/6 million cars.
- From D to C: The opportunity costs of 1 thousand more guided missiles are 2/9 million cars.
- From C to B: The opportunity costs of 1 thousand more guided missiles are 2/6 = 1/3 million cars.
- From B to A: The opportunity cost of 1 thousand more guided missiles is 2/3
million cars. => In conclusion, there are increasing opportunity costs to produce missiles. b)
If the economy is currently at point C:
- The cost of one million more cars: (21-12)/2 = 4.5 (thousand guided missiles)
- The cost of one thousand more guided missiles: (4-2)/6 = 1/3 (million cars) c)
Point G is inside the curve of the graph.
=> It shows that the economy's production is inefficient because it doesn’t take advantage of all resources. d)
Point H lies outside the PPF curve.
- It indicates that scenario H is impossible or unattainable at present (with fixed resources)
- The economy can attain the level of production indicated by point H by achieving
the growth of inputs (improving technology, human resources…) e)
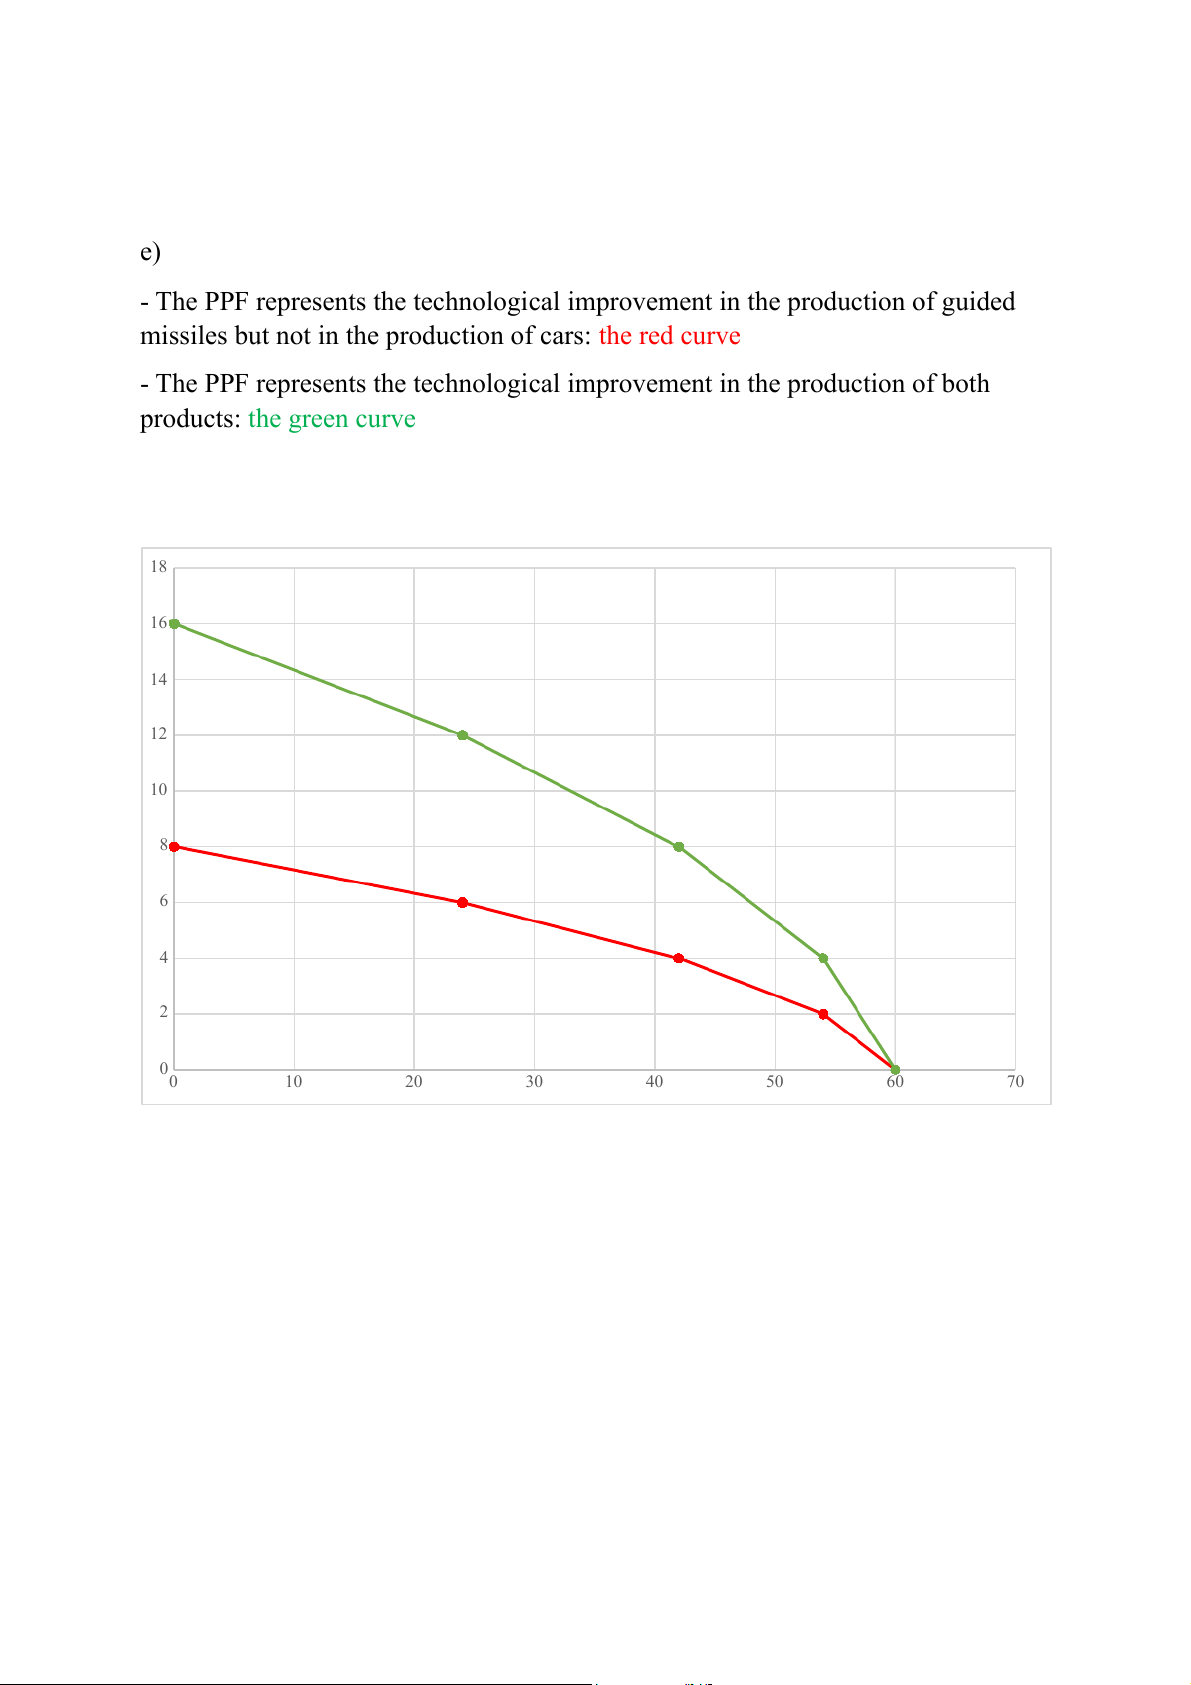
- The PPF represents the technological improvement in the production of guided
missiles but not in the production of cars: the red curve
- The PPF represents the technological improvement in the production of both products: the green curve 18 16 14 12 10 8 6 4 2 00 10 20 30 40 50 60 70
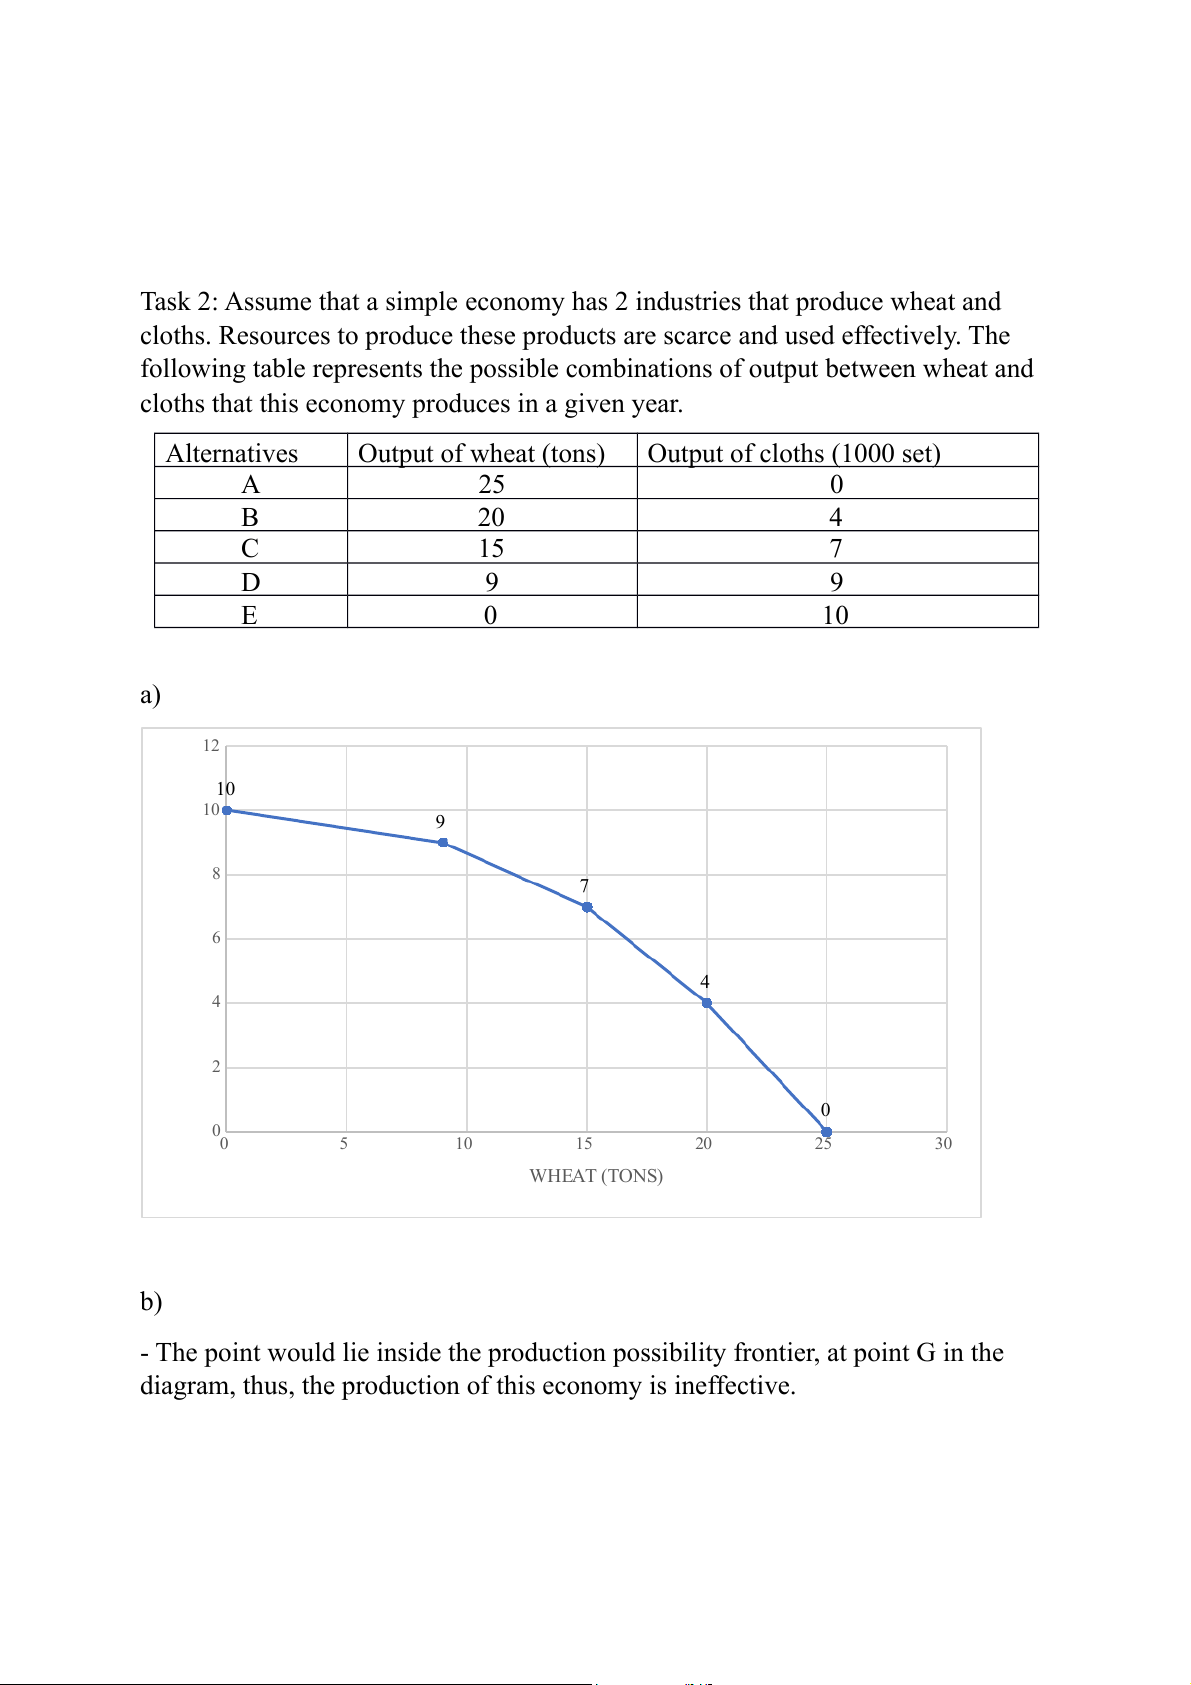
Task 2: Assume that a simple economy has 2 industries that produce wheat and
cloths. Resources to produce these products are scarce and used effectively. The
following table represents the possible combinations of output between wheat and
cloths that this economy produces in a given year. Alternatives Output of wheat (tons) Output of cloths (1000 set) A 25 0 B 20 4 C 15 7 D 9 9 E 0 10 a) 12 10 10 9 ) TS 8 7 SE 00 6 HS(10 T 4 O 4 CL 2 0 00 5 10 15 20 25 30 WHEAT (TONS) b)
- The point would lie inside the production possibility frontier, at point G in the
diagram, thus, the production of this economy is ineffective.
- Because if it produces 9 tons of Wheat, the most sets of cloth it can produce is
9000 sets of cloth, or If it produces 4000 sets of cloth, the most amount of wheat it can produce is 20 tons. c)
- The point would lie outside the production possibility frontier, at point H in the
diagram, thus, this economy cannot produce 20 tons of wheat and 10 000 sets of clothes.
- Because the resources are limited, producing 20 tons of Wheat can only produce
4000 sets of cloth. To produce 10,000 sets of cloth, it cannot produce any ton of wheat. d)
- The opportunity costs of cloth
❖ From A to B: To produce 4000 sets of cloth, the economy gives up 5 tons of
wheat. Therefore, the opportunity costs of 1000 sets of cloths are 5/4 tons of wheat.
❖ From B to C: To produce 3000 sets of cloth, it gives up 5 tons of wheat.
Therefore, the opportunity costs of 1000 sets of cloths are 5/3 tons of wheat.
❖ From C to D: To produce 2000 sets of cloth, it gives up 6 tons of wheat.
Therefore, the opportunity costs of 1000 sets of cloths are 6/2 = 3 tons of wheat.
❖ From D – E: To produce 1000 sets of cloth, it gives up 9 tons of wheat.
Therefore, the opportunity costs of 1000 sets of cloths are 9/1 = 9 tons of wheat.
- The opportunity costs of wheat:
❖ From E – D: To produce 9 tons of wheat, it gives up 1000 sets of cloth.
Therefore, the opportunity costs of 1 ton of wheat are 1000/9 sets of cloth
❖ From D to C: To produce 6 tons of wheat, it gives up 2000 sets of cloth.
Therefore, the opportunity costs of 1 ton of wheat are 2000/6=1000/3 sets of cloth
❖ From C to B: To produce 5 tons of wheat, it gives up 3000 sets of cloth.
Therefore, the opportunity costs of 1 ton of wheat are 3000/5=600 sets of cloth
❖ From B to A: To produce 5 tons of wheat, the economy gives up 4000 sets of
cloth. Therefore, the opportunity costs of 1 ton of wheat are 4000/5=800 sets of cloth.
Tài liệu liên quan:
-

Chương 3: độ co giãn và các nhân tố ảnh hưởng | Microeconomics | Trường Đại học Quốc tế, Đại học Quốc gia Thành phố Hồ Chí Minh
3 2 -

Microeconomics Syllabus | Microeconomics | Trường Đại học Quốc tế, Đại học Quốc gia Thành phố Hồ Chí Minh
3 2 -

Microeconomics Course Syllabus & Assessment Details | Microeconomics | Trường Đại học Quốc tế, Đại học Quốc gia Thành phố Hồ Chí Minh
3 2 -

Assignment 3 - Elasticity MCQs and Key Concepts | Microeconomics | Trường Đại học Quốc tế, Đại học Quốc gia Thành phố Hồ Chí Minh
3 2 -

Assignment 2 - Economic Equilibrium Analysis of Fridges and Motorcycles | Microeconomics | Trường Đại học Quốc tế, Đại học Quốc gia Thành phố Hồ Chí Minh
3 2