Microeconomics Individual Assignment | Microeconomics | Trường Đại học Quốc tế, Đại học Quốc gia Thành phố Hồ Chí Minh
Graph the data in the table. Are there constant or increasing opportunity costs for the production of missiles? b. If the economy is currently at point C: - What is the cost of one million more cars? - What is the cost of one thousand more guided missiles? c. Label a point G inside the curve of the graph. What does it indicate? d. Label a point H that lies outside the PPF curve. - What does this point indicate? - What must occur before the economy can attain the level of production indicated by point H? Tài liệu được sưu tầm và soạn thảo dưới dạng file PDF để gửi tới các bạn cùng tham khảo, ôn tập đầy đủ kiến thức, chuẩn bị cho các buổi học thật tốt. Mời bạn đọc đón xem!
Môn: Microeconomics 635 tài liệu
Trường: Trường Đại học Quốc tế, Đại học Quốc gia Thành phố Hồ Chí Minh 1.9 K tài liệu
Tác giả:


Preview text:
MICROECONOMICS Individual Assignment Name: Nguyen Thi Kieu Trang Class: EBBA 16.2
Exercise 1. Use the following production possibilities table for war
goods and civilian goods to answer questions a to e. Production alternatives Types of product A B C D E Cars (in millions) 0 2 4 6 8 Guided missiles (in 30 27 21 12 0 thousands)
a. Graph the data in the table. Are there constant or increasing
opportunity costs for the production of missiles?
b. If the economy is currently at point C:
- What is the cost of one million more cars?
- What is the cost of one thousand more guided missiles?
c. Label a point G inside the curve of the graph. What does it indicate? d.
Label a point H that lies outside the PPF curve.
- What does this point indicate?
- What must occur before the economy can attain the level of production indicated by point H?
e. Suppose improvement occurs in the technology of producing guided
missiles but not in the production of cars.
- Draw the new PPF curve on the graph you created.
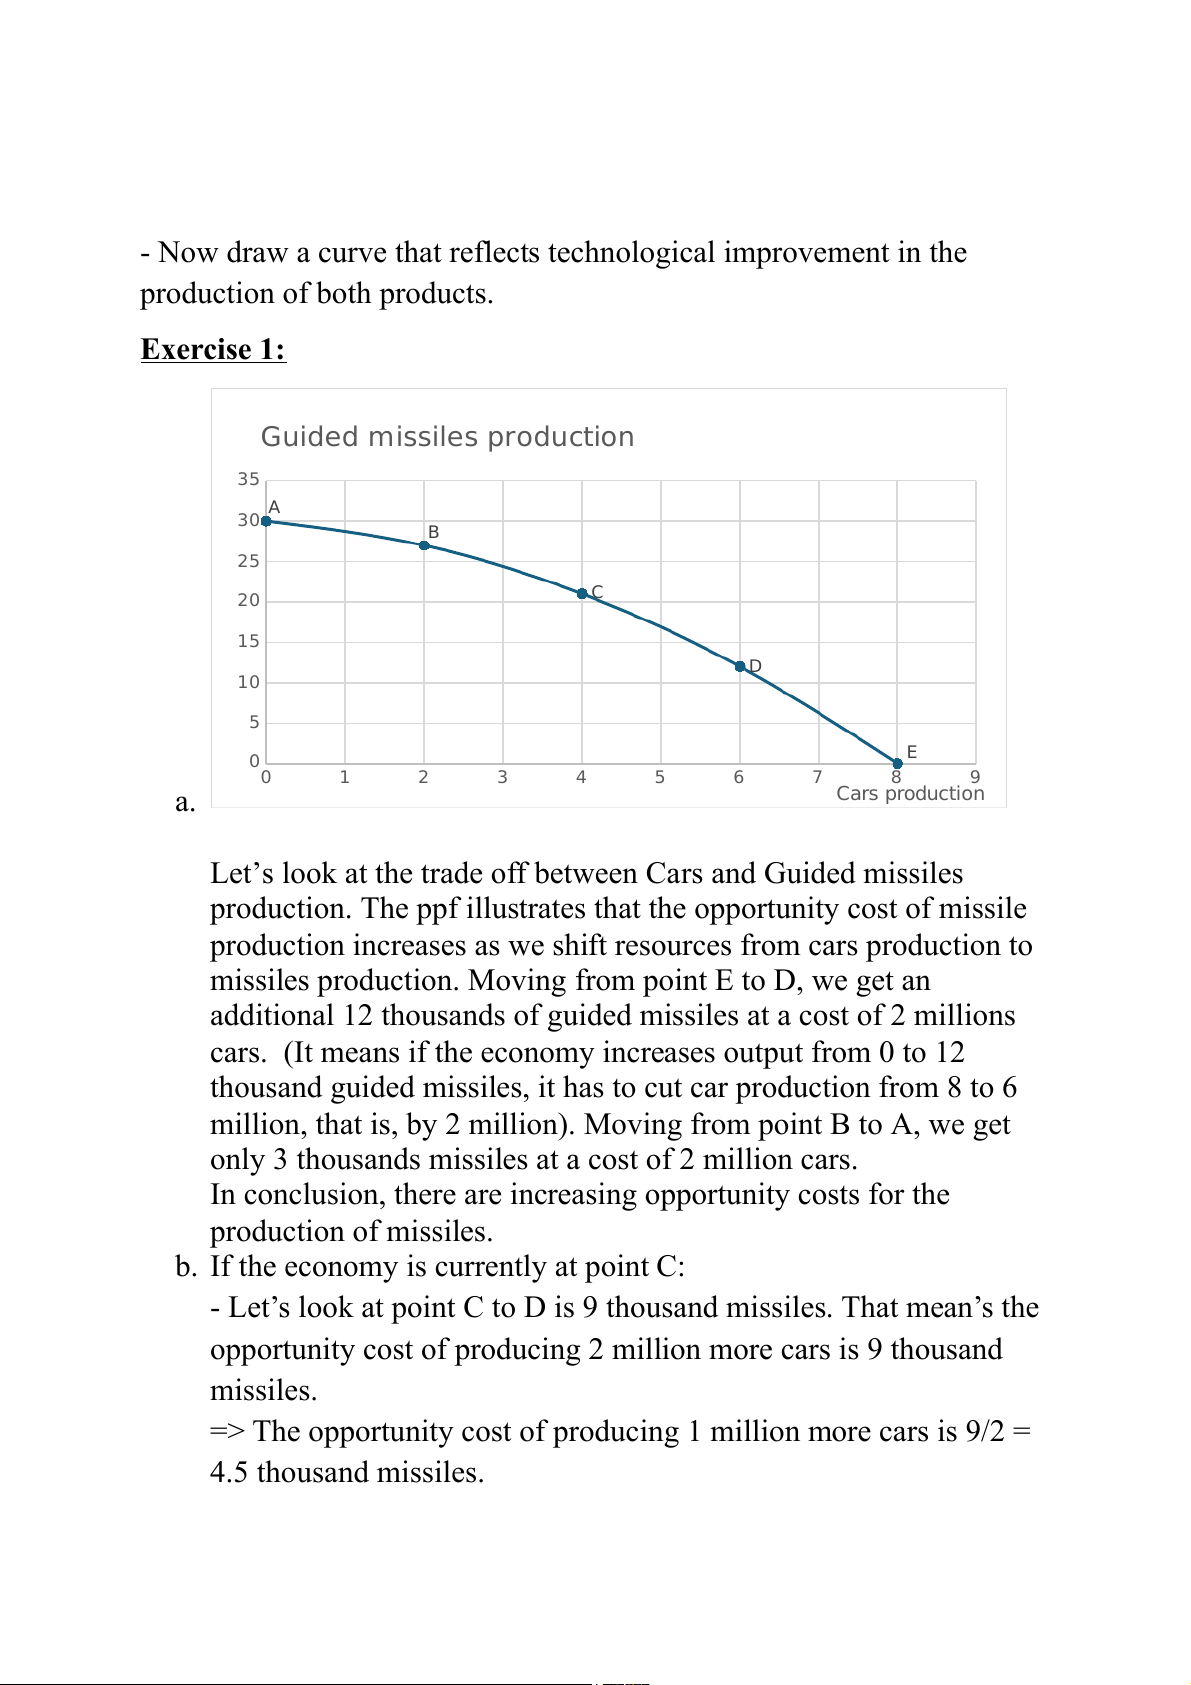
- Now draw a curve that reflects technological improvement in the production of both products. Exer cise 1 : Guided missiles production 35 A 30 B 25 20 C 15 D 10 5 E 00 1 2 3 4 5 6 7 8 9 a. Cars production
Let’s look at the trade off between Cars and Guided missiles
production. The ppf illustrates that the opportunity cost of missile
production increases as we shift resources from cars production to
missiles production. Moving from point E to D, we get an
additional 12 thousands of guided missiles at a cost of 2 millions
cars. (It means if the economy increases output from 0 to 12
thousand guided missiles, it has to cut car production from 8 to 6
million, that is, by 2 million). Moving from point B to A, we get
only 3 thousands missiles at a cost of 2 million cars.
In conclusion, there are increasing opportunity costs for the production of missiles.
b. If the economy is currently at point C:
- Let’s look at point C to D is 9 thousand missiles. That mean’s the
opportunity cost of producing 2 million more cars is 9 thousand missiles.
=> The opportunity cost of producing 1 million more cars is 9/2 = 4.5 thousand missiles.
- The opportunity cost of increasing output from C to B is 2
million cars. The opportunity cost of producing 6 thousand more missiles is 2 million cars.
=> The opportunity cost of producing 1 thousand more missiles is 2/6 = ⅓ million cars c.
Point G indicates the economic output of Car and Missile are 3,7
million cars and 10 thousand missiles. This means the economy is
inefficient in its production. Because if it produces 3,7 million cars,
the most of the missiles it can produce is 23 thousand missiles, and
if it produces 10 thousand missiles, the most cars it can produce is 6,3 million cars.
d. Point H indicates the economic output of Car and Missile are 6,6
million cars and 30 thousand missiles. It indicates the economic
outputs which can only result from growth of the availability of
inputs to transform inputs into outputs. The H point indicates the
impossible outcome with the fixed resource.
The economy must expand in order to attain the level of
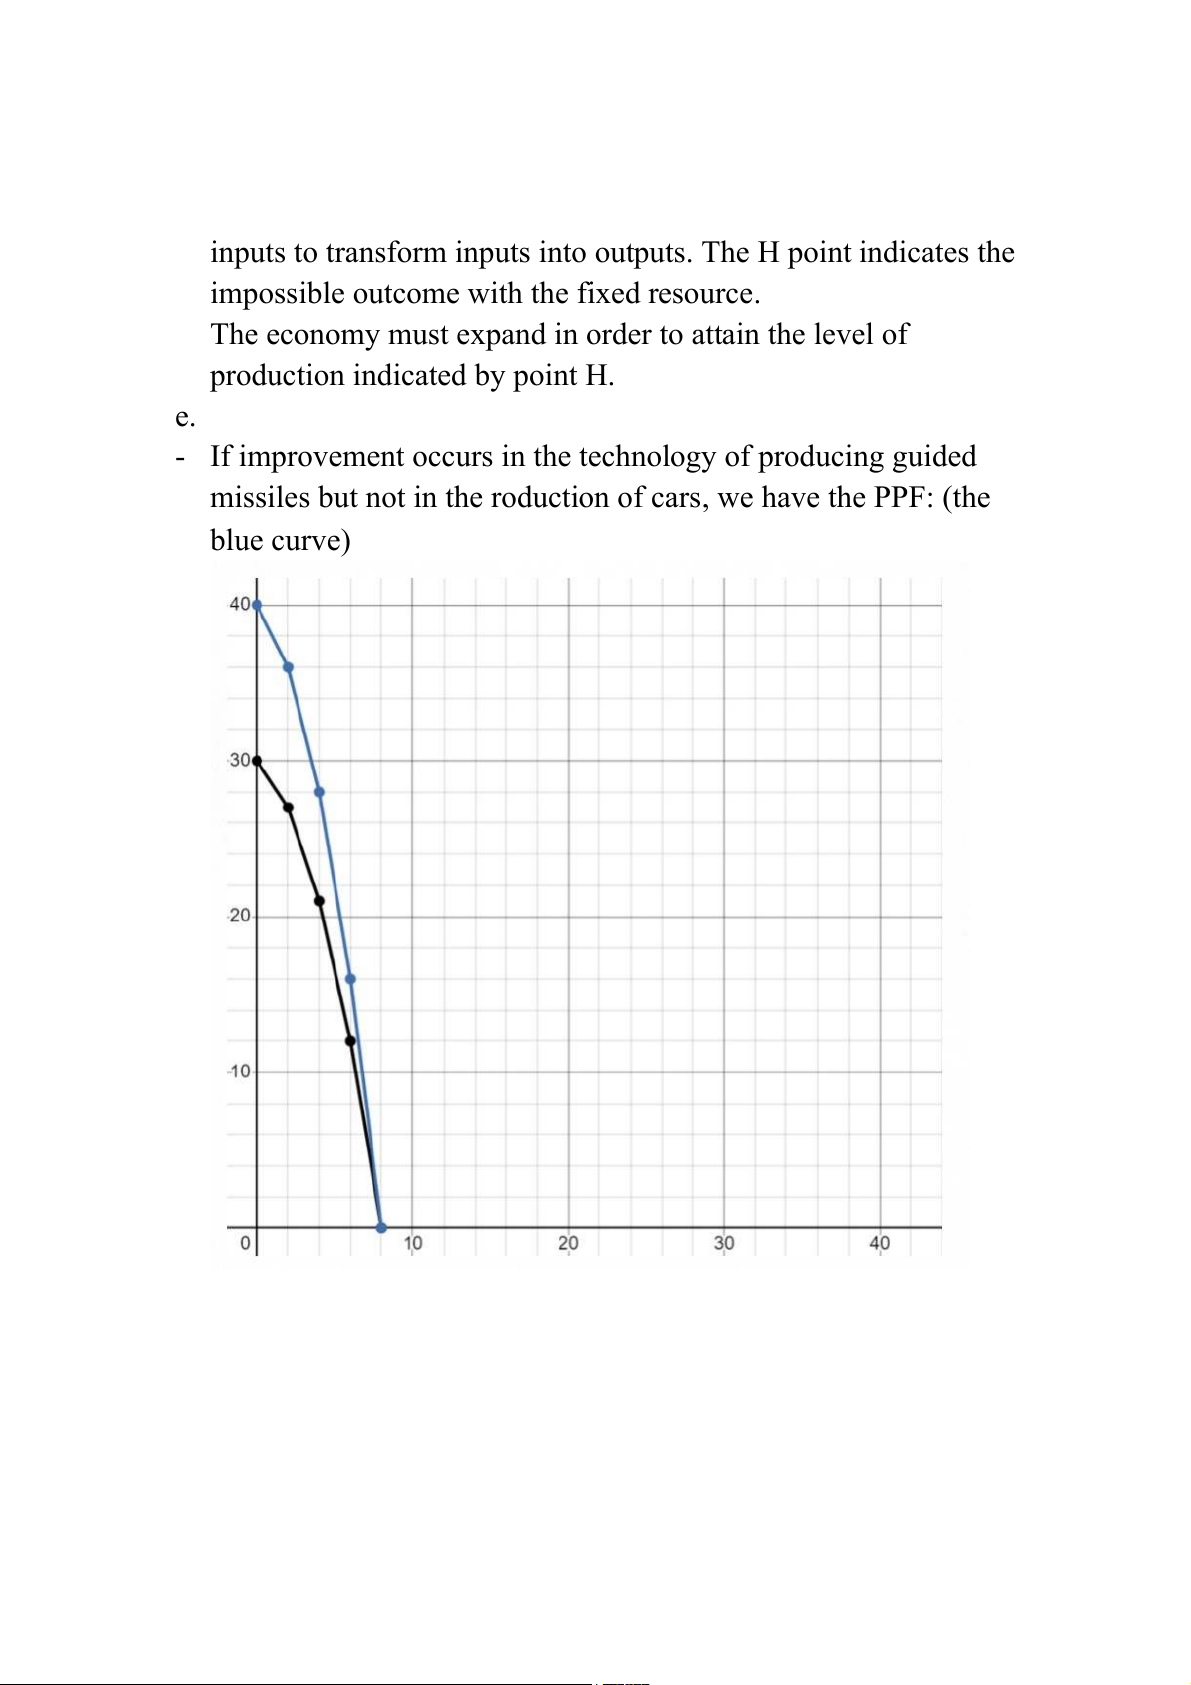
production indicated by point H. e.
- If improvement occurs in the technology of producing guided
missiles but not in the roduction of cars, we have the PPF: (the blue curve)
If technological improvement in the production of both products: (the blue curve):
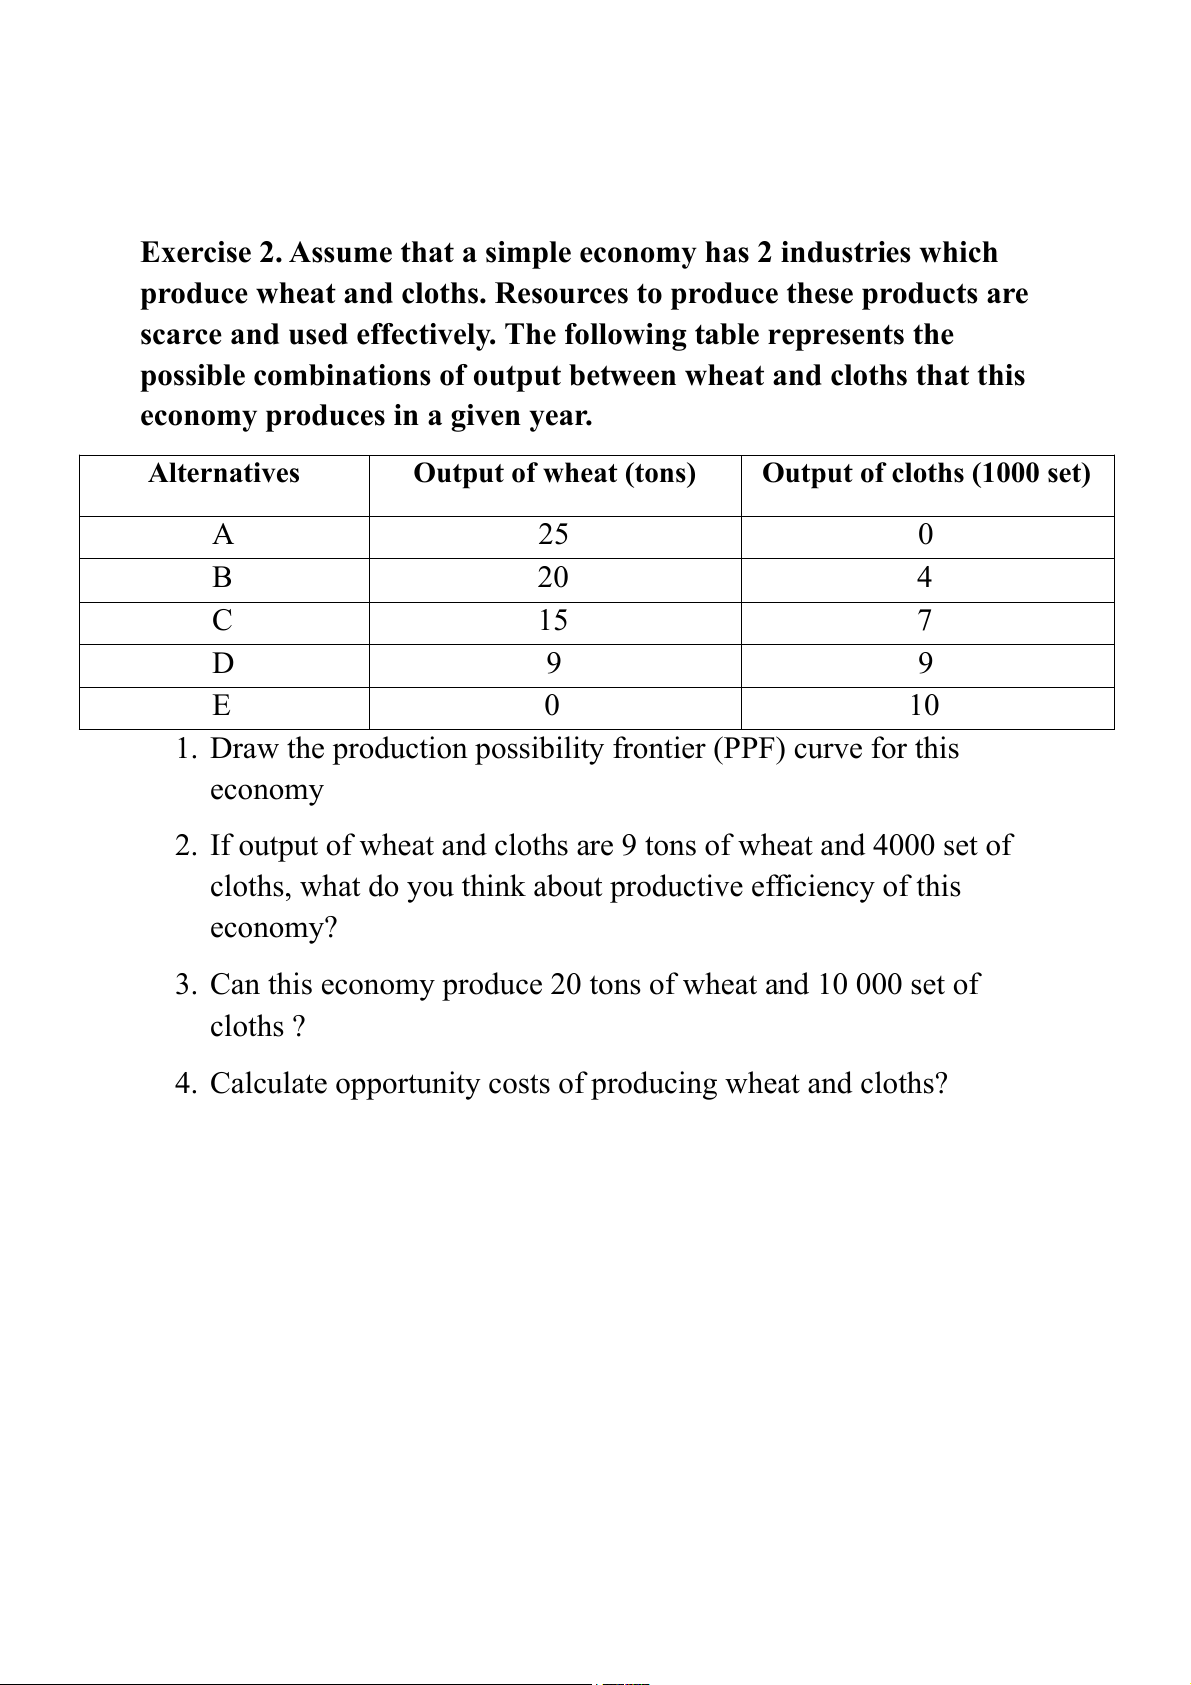
Exercise 2. Assume that a simple economy has 2 industries which
produce wheat and cloths. Resources to produce these products are
scarce and used effectively. The following table represents the
possible combinations of output between wheat and cloths that this
economy produces in a given year. Alternatives Output of wheat (tons)
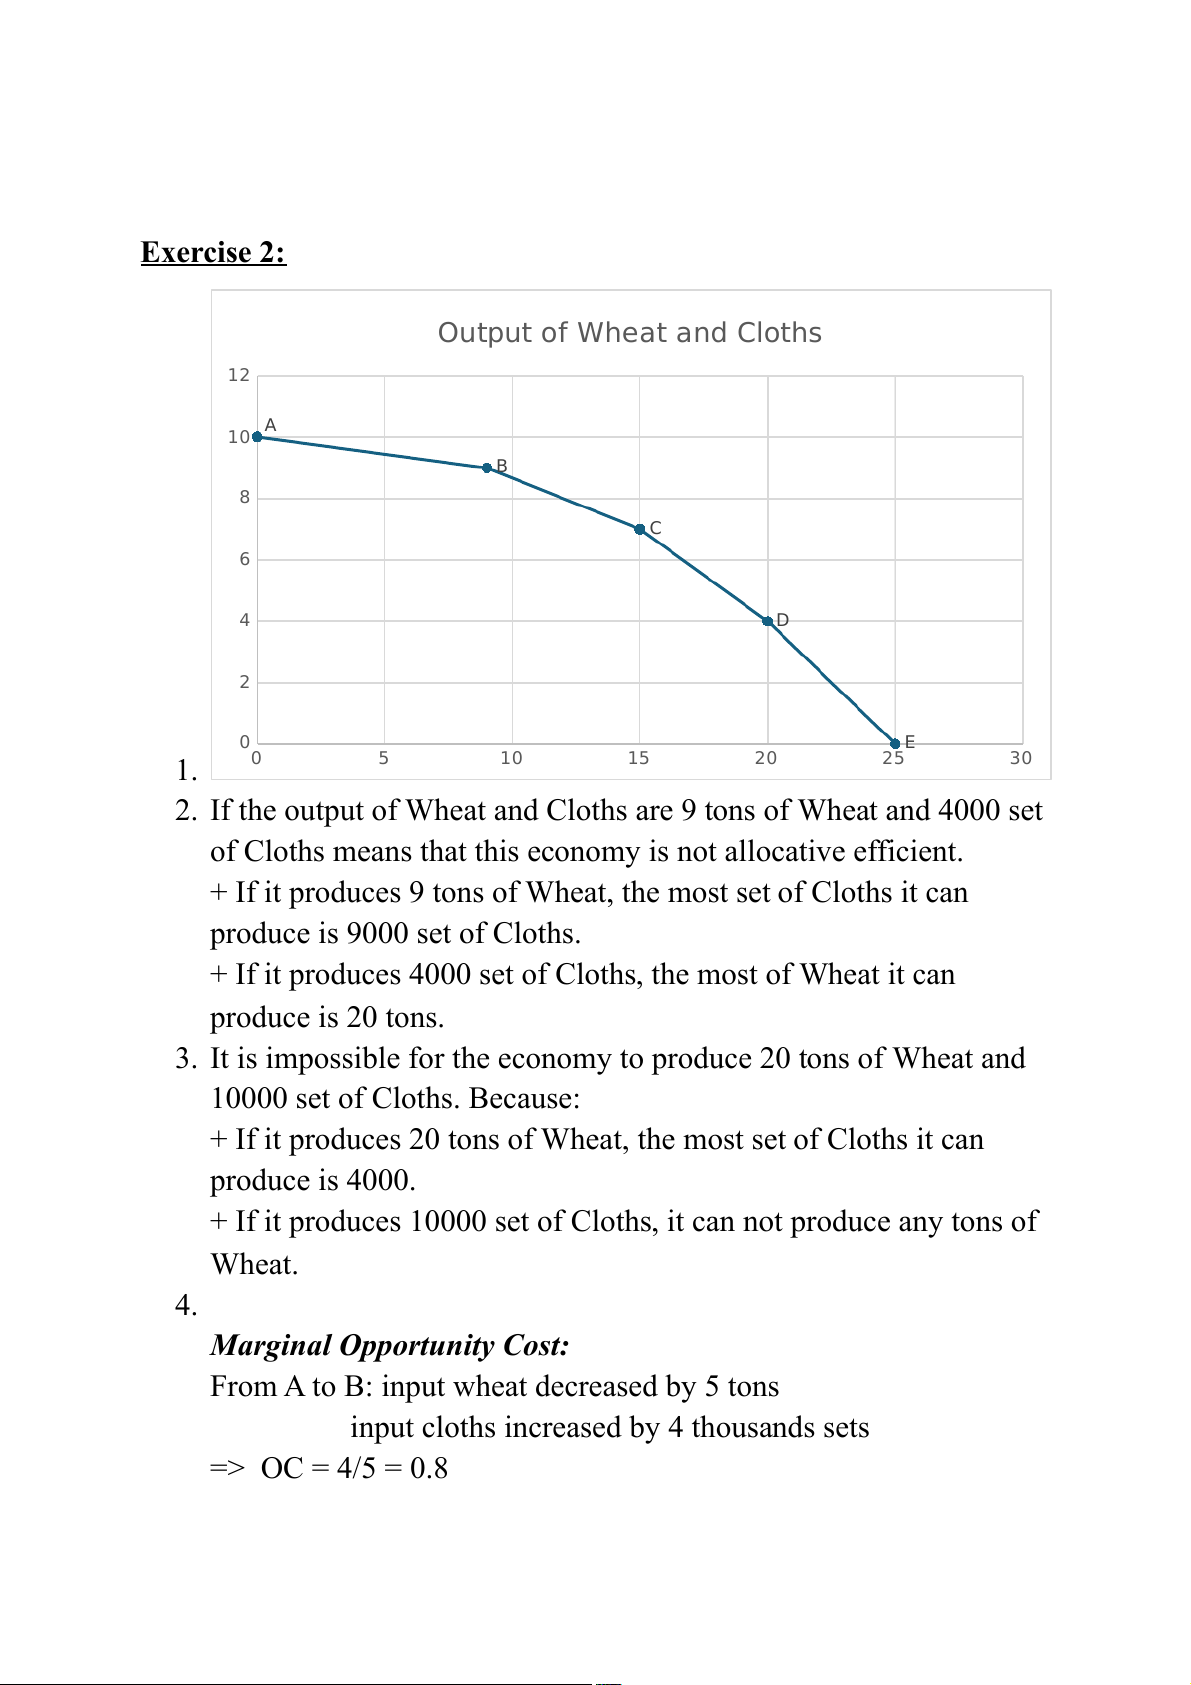
Output of cloths (1000 set) A 25 0 B 20 4 C 15 7 D 9 9 E 0 10
1. Draw the production possibility frontier (PPF) curve for this economy
2. If output of wheat and cloths are 9 tons of wheat and 4000 set of
cloths, what do you think about productive efficiency of this economy?
3. Can this economy produce 20 tons of wheat and 10 000 set of cloths ?
4. Calculate opportunity costs of producing wheat and cloths? Exercise 2: Output of Wheat and Cloths 12 A 10 B 8 C 6 4 D 2 0 E 1. 0 5 10 15 20 25 30
2. If the output of Wheat and Cloths are 9 tons of Wheat and 4000 set
of Cloths means that this economy is not allocative efficient.
+ If it produces 9 tons of Wheat, the most set of Cloths it can produce is 9000 set of Cloths.
+ If it produces 4000 set of Cloths, the most of Wheat it can produce is 20 tons.
3. It is impossible for the economy to produce 20 tons of Wheat and 10000 set of Cloths. Because:
+ If it produces 20 tons of Wheat, the most set of Cloths it can produce is 4000.
+ If it produces 10000 set of Cloths, it can not produce any tons of Wheat. 4.
Marginal Opportunity Cost:
From A to B: input wheat decreased by 5 tons
input cloths increased by 4 thousands sets => OC = 4/5 = 0.8
From B to C: input wheat decreased by 5 tons
input cloths increased by 3 thousands sets => OC = 3/5
From A to B: input wheat decreased by 6 tons
input cloths increased by 2 thousands sets => OC = 2/6 = 1/3
From A to B: input wheat decreased by 9 tons
input cloths increased by 1 thousands sets => OC = 1/9
Total opportunity cost: The opportunity cost of producing 25 tons
of Wheat is 10000 set of Cloths.
=> The opportunity cost of producing 1 ton of Wheat is 400 set of Cloths.
=> The opportunity cost of producing 1 set of Cloths is 1/400 = 0.0025 tons of Wheat. 5. - If the output of Wheat and Cloths are 9 tons of Wheat and 4000 set of Cloths 6. means that this economy is not allocative efÏcient. If it produces 9 tons of Wheat, the 7. most set of cloths it can produce is 9000 set of cloths or if it produces 4000 set of 8. cloths, the most of wheat it can produce is 20 tons. 9. - If the output of Wheat and Cloths are 9 tons of Wheat and 4000 set of Cloths 10. means that this economy is not allocative efÏcient. If it produces 9 tons of Wheat, the 11. most set of cloths it can produce is 9000 set of cloths or if it produces 4000 set of 12. cloths, the most of wheat it can produce is 20 tons.
Tài liệu liên quan:
-

Chương 3: độ co giãn và các nhân tố ảnh hưởng | Microeconomics | Trường Đại học Quốc tế, Đại học Quốc gia Thành phố Hồ Chí Minh
4 2 -

Microeconomics Syllabus | Microeconomics | Trường Đại học Quốc tế, Đại học Quốc gia Thành phố Hồ Chí Minh
4 2 -

Microeconomics Course Syllabus & Assessment Details | Microeconomics | Trường Đại học Quốc tế, Đại học Quốc gia Thành phố Hồ Chí Minh
4 2 -

Assignment 3 - Elasticity MCQs and Key Concepts | Microeconomics | Trường Đại học Quốc tế, Đại học Quốc gia Thành phố Hồ Chí Minh
4 2 -

Assignment 2 - Economic Equilibrium Analysis of Fridges and Motorcycles | Microeconomics | Trường Đại học Quốc tế, Đại học Quốc gia Thành phố Hồ Chí Minh
4 2