Microeconomics Individual Assignment: PPF Analysis | Microeconomics | Trường Đại học Quốc tế, Đại học Quốc gia Thành phố Hồ Chí Minh
Based on the data and the graph illustrating the following table, it can be observed that the opportunity costs for the production of guided missiles increase. To specify, we can see that from option A to B, the producer have to sacrifice only 3 thousand missiles (30 to 27) to produce another 2 million cars (0 to 2). However, from option B to C, the manufacturor must give up 6 thousand missiles (27 to 21) to produce 2 million more cars (2 to 4). Tài liệu được sưu tầm và soạn thảo dưới dạng file PDF để gửi tới các bạn cùng tham khảo, ôn tập đầy đủ kiến thức, chuẩn bị cho các buổi học thật tốt. Mời bạn đọc đón xem!
Môn: Microeconomics 635 tài liệu
Trường: Trường Đại học Quốc tế, Đại học Quốc gia Thành phố Hồ Chí Minh 1.9 K tài liệu
Tác giả:
Preview text:
MICROECONOMICS Individual Assignment Week 1 Date: 26/10/2022 Full name: Vũ An Ngân Student ID: 11224611 Class: EBBA 14.1
------------------------------------------ Exercise 1:
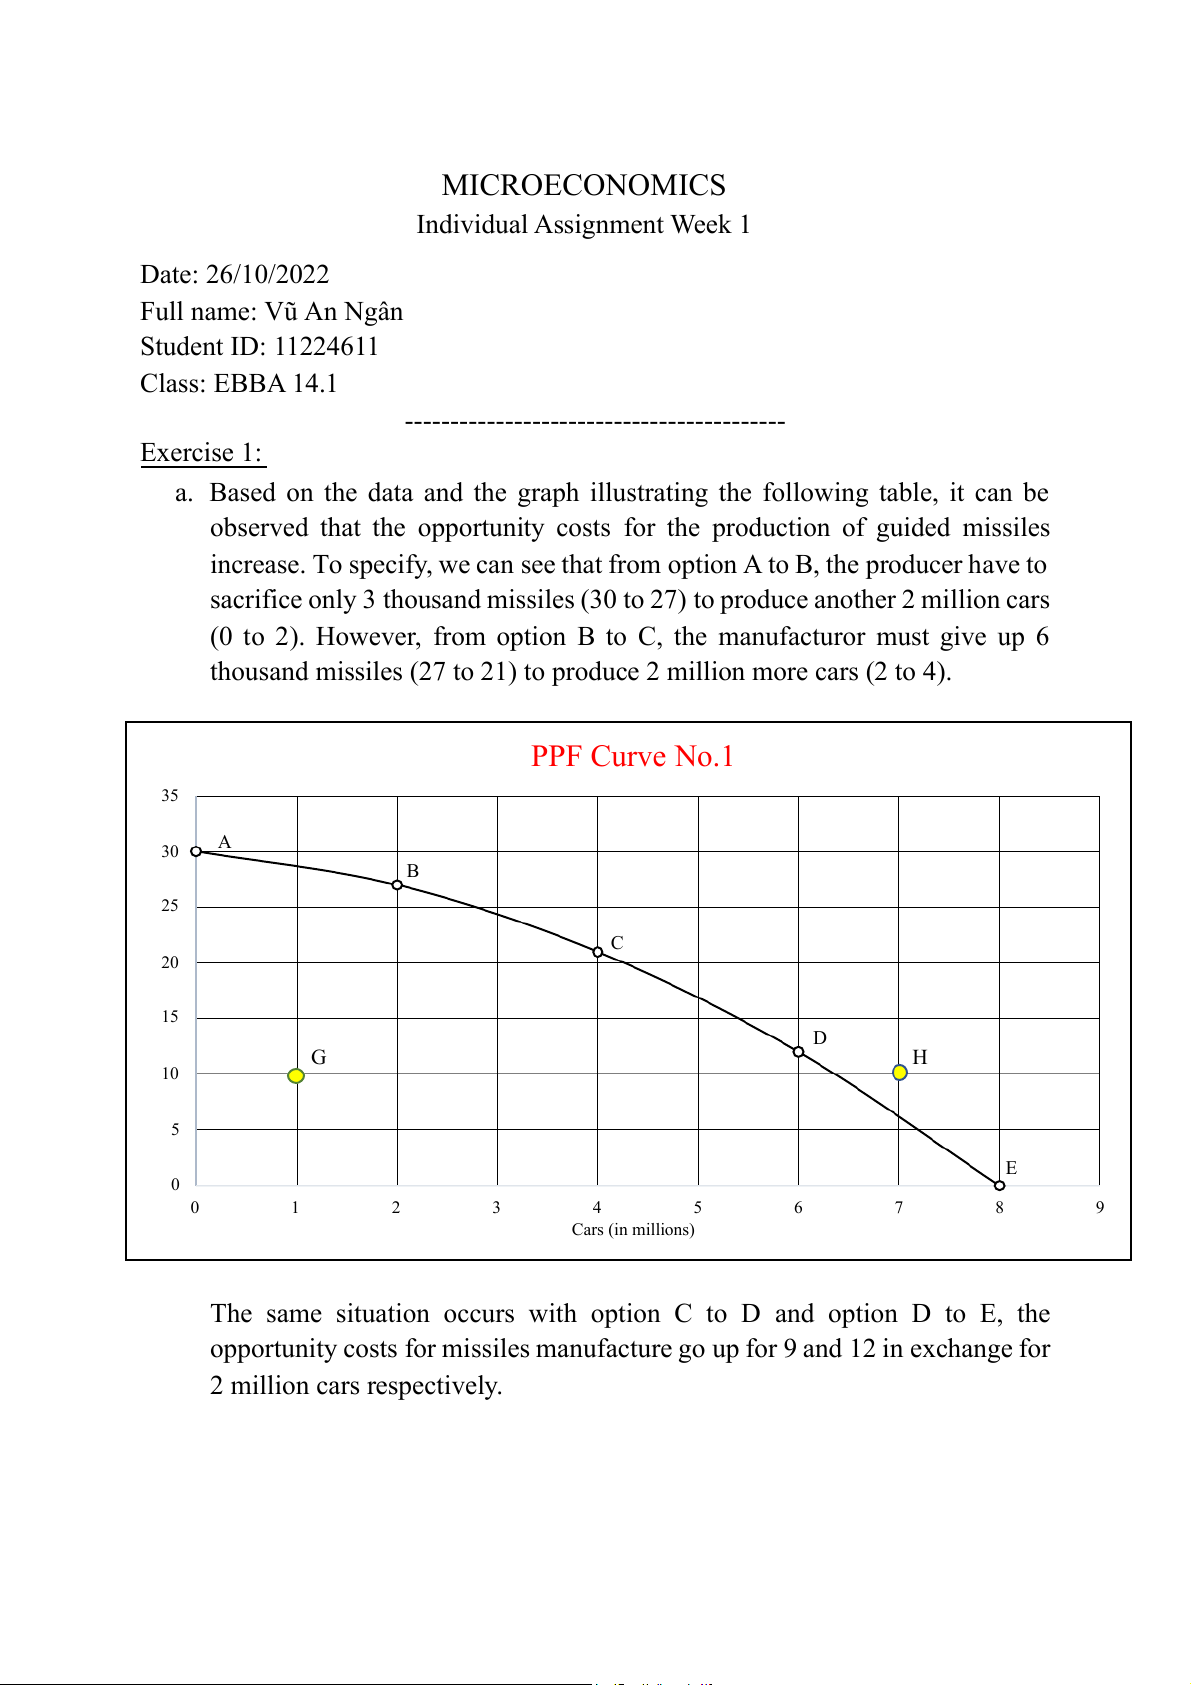
a. Based on the data and the graph illustrating the following table, it can be
observed that the opportunity costs for the production of guided missiles
increase. To specify, we can see that from option A to B, the producer have to
sacrifice only 3 thousand missiles (30 to 27) to produce another 2 million cars
(0 to 2). However, from option B to C, the manufacturor must give up 6
thousand missiles (27 to 21) to produce 2 million more cars (2 to 4). PPF Curve No.1 35 A 30 B ) 25 C 20 15 D G H 10 Guided missiles (in thousands 5 E 0 0 1 2 3 4 5 6 7 8 9 Cars (in millions)
The same situation occurs with option C to D and option D to E, the
opportunity costs for missiles manufacture go up for 9 and 12 in exchange for 2 million cars respectively.
b. If the economy is currently at point C:
- From point C to D, 9 thousand missiles are diminished, making room for another 2 million cars.
=> The cost of one million more cars is 9/2 = 4.5 thousand missiles.
- From point C to B, the producer lessens 2 million cars to produce 6 thousand more missiles.
=> The cost of one thousand more missiles is 2/6 = 1/3 million cars.
c. Point G shows that the producer’s output is 10 thousand missiles and 1 million
cars. This information illustrates that there is an abundance of human
resourses. The reason is that the employer can coordinate the manpower to
produce more cars or more missiles to reach to the PPF curve. In this way, the
productivity is fully achieved and there is no waste of human resourses.
d. Point H indicates that the producer’s output is 7 million cars and 10 thousand
missiles. This point is currently unreachable with the current manpower. To
attain that level of production, more employers must be included in the
process, otherwise, the producer have to apply a more effective strategy of
manufacture or advanced machine and device. For instance, the production
line (assembly line) can facillitate the productivity, so that it can be easier to
save time and manpower. If the producer applies modern technology, the
production can go up to point H.
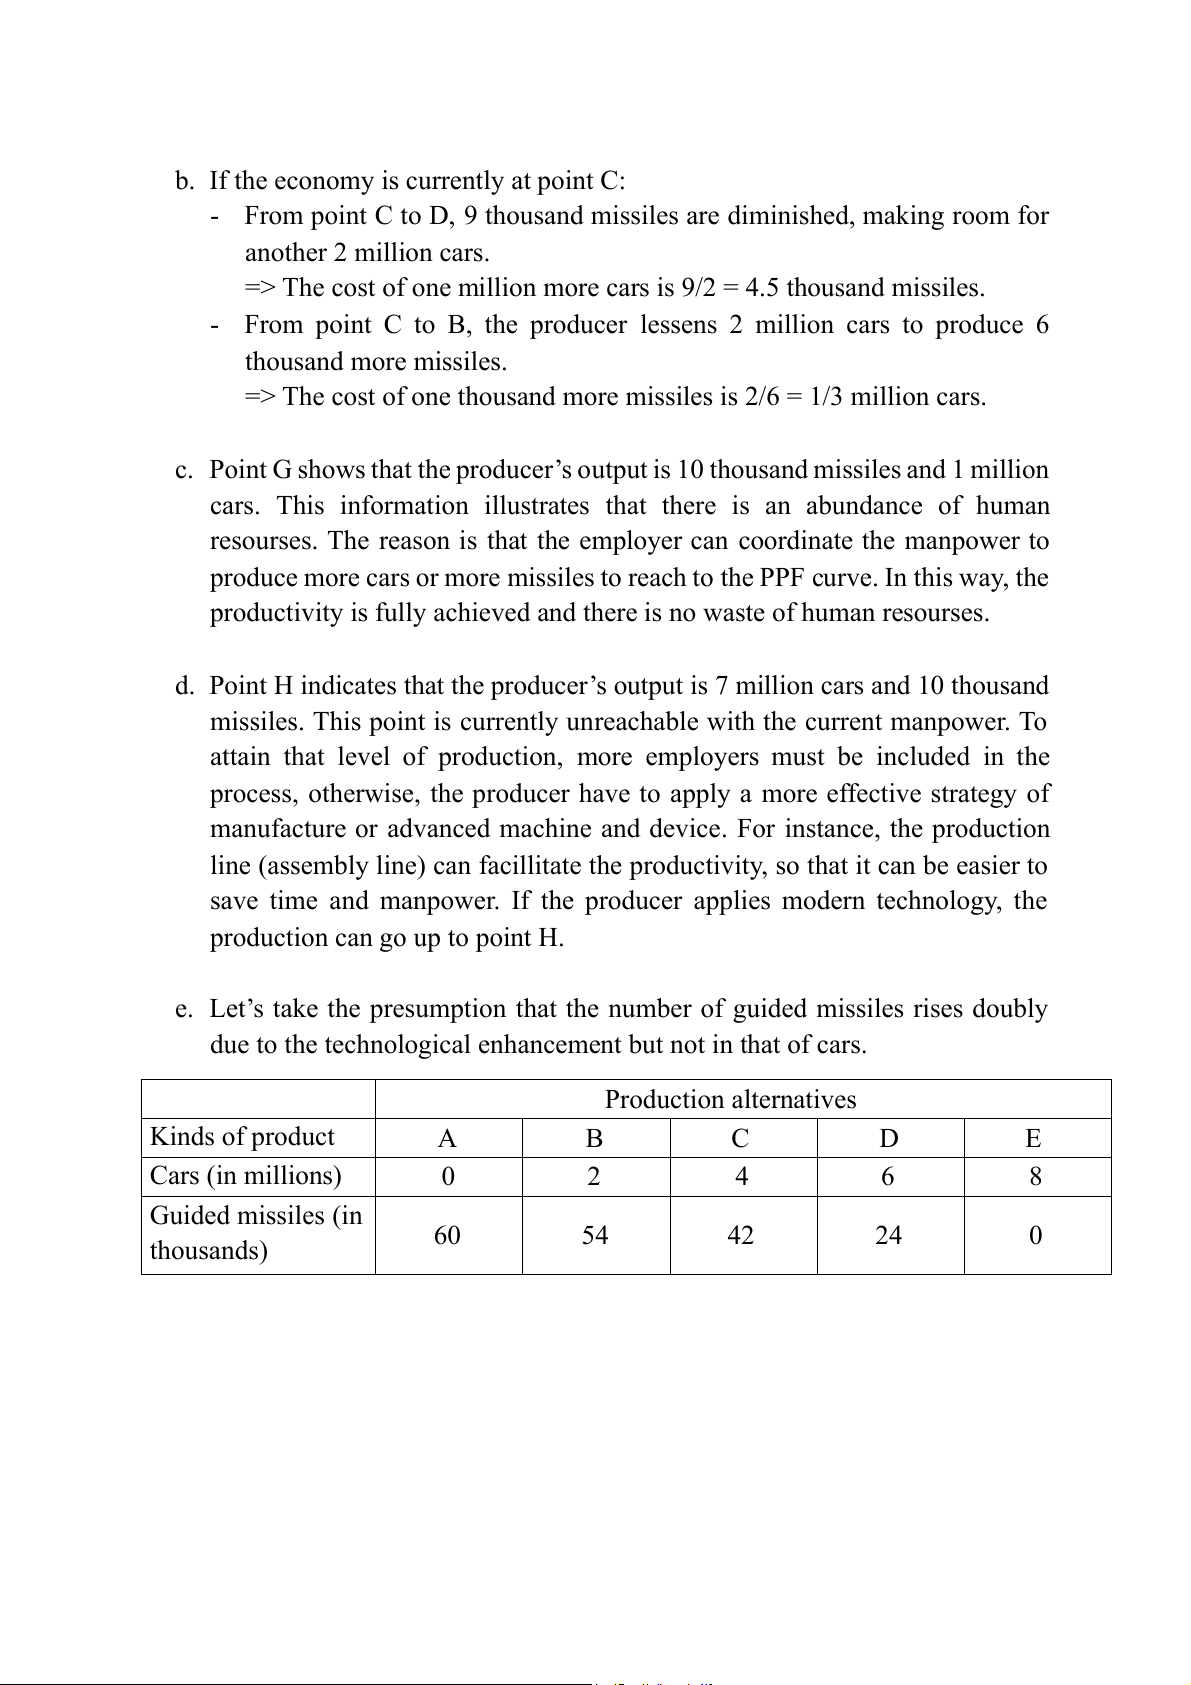
e. Let’s take the presumption that the number of guided missiles rises doubly
due to the technological enhancement but not in that of cars. Production alternatives Kinds of product A B C D E Cars (in millions) 0 2 4 6 8 Guided missiles (in 60 54 42 24 0 thousands) PPF Curve No.2 70 60 60 54 50 42 40 30 The Original PPF 27 30 issiles (in thousands) 24 The new PPF 21 20 ided m Gu 12 10 0 0 0 1 2 3 4 5 6 7 8 9 Cars (in millions)
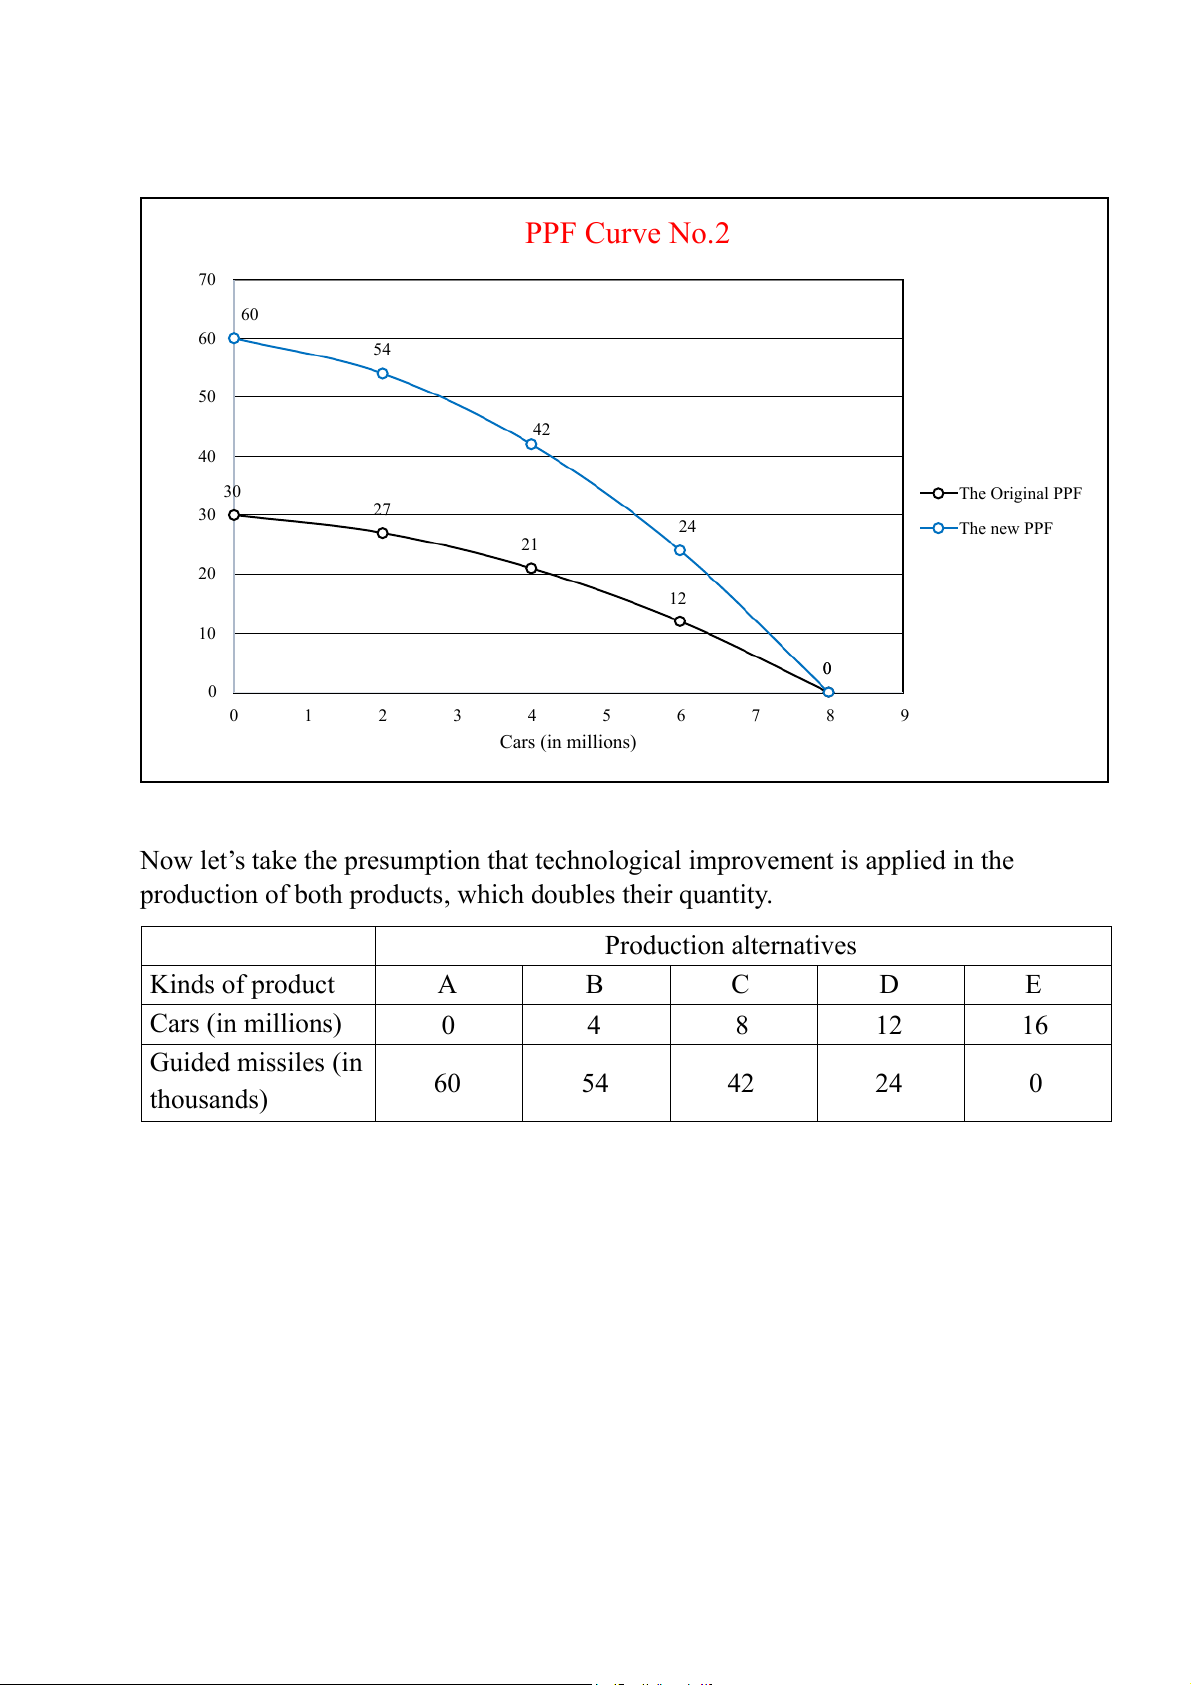
Now let’s take the presumption that technological improvement is applied in the
production of both products, which doubles their quantity. Production alternatives Kinds of product A B C D E Cars (in millions) 0 4 8 12 16 Guided missiles (in 60 54 42 24 0 thousands) PPF Curve No.3 70 60 50 40 The Original PPF 30 issiles (in thousands) The New PPF 20 uided m G 10 0 0 2 4 6 8 10 12 14 16 18 Cars (in millions) Exercise 2: a. PPF Curve No.4 12 10 8 6 4 utput of cloths (1000 set) O 2 0 0 5 10 15 20 25 30 Output of wheat (in tons)
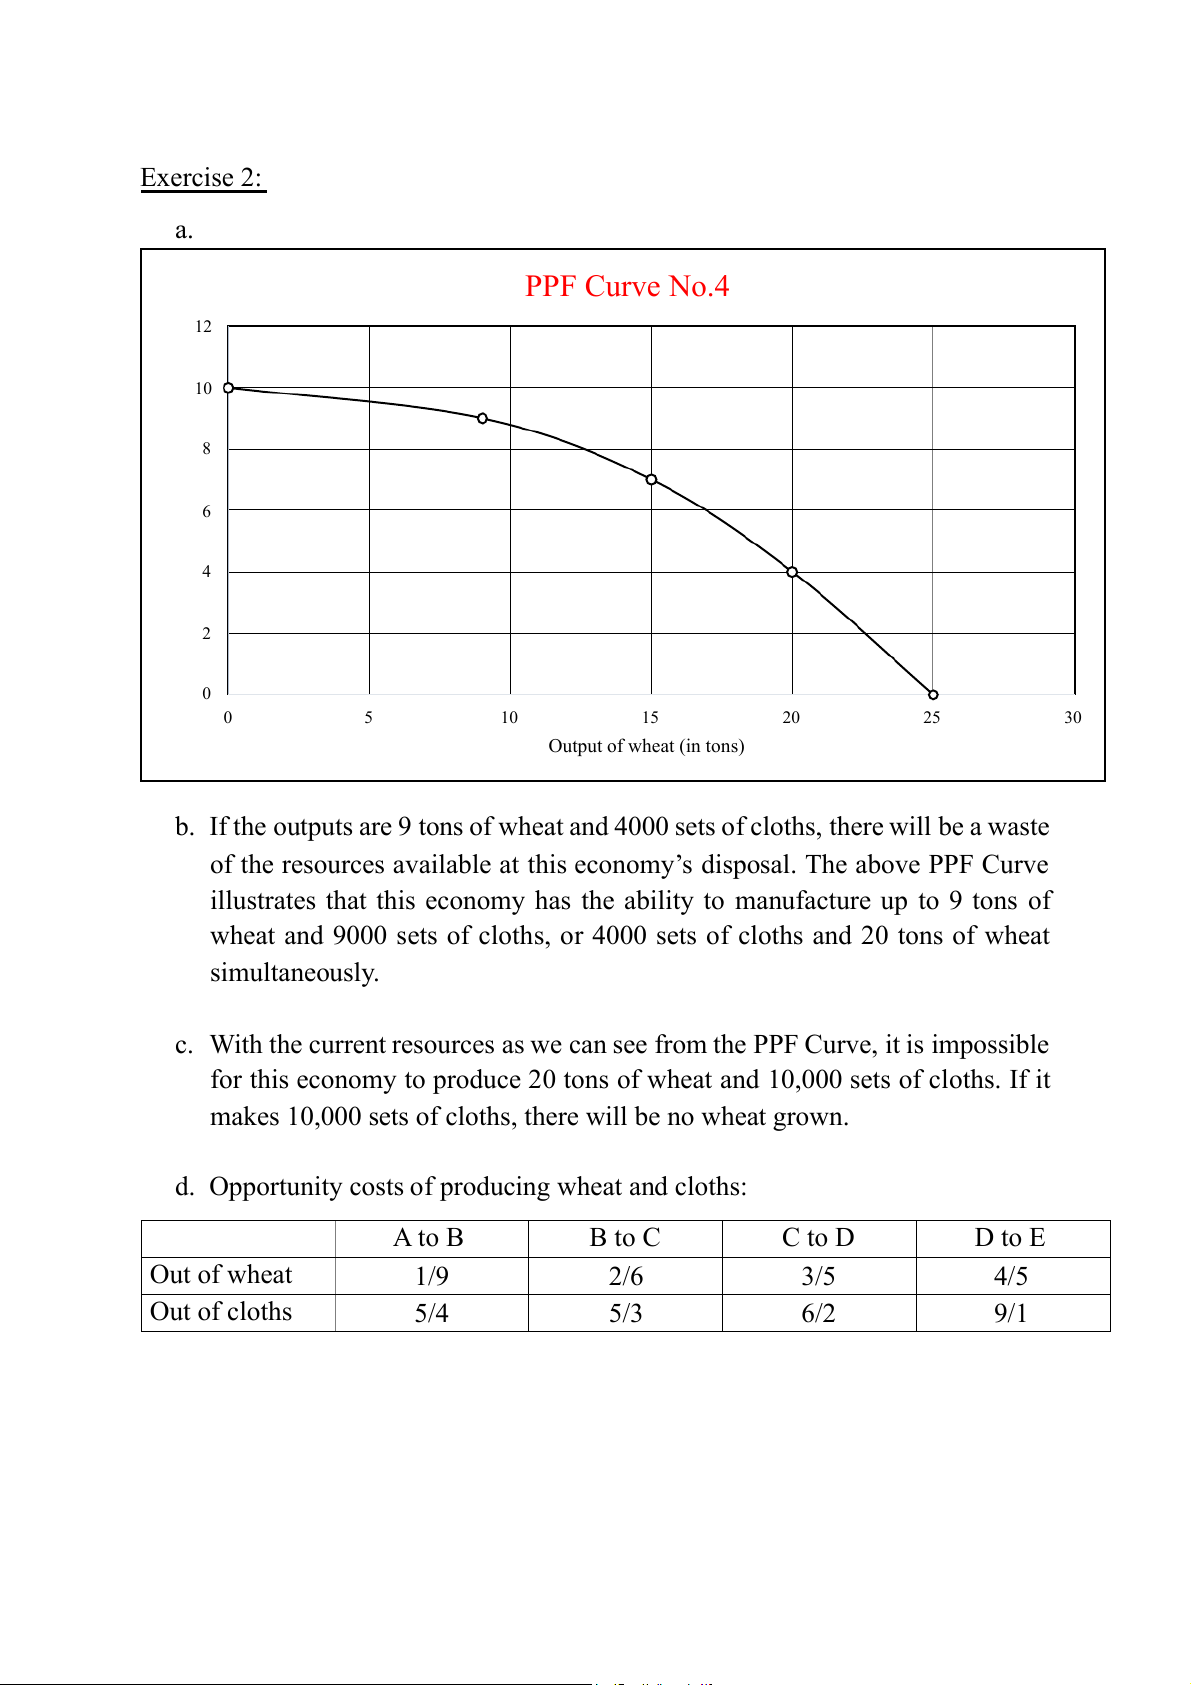
b. If the outputs are 9 tons of wheat and 4000 sets of cloths, there will be a waste
of the resources available at this economy’s disposal. The above PPF Curve
illustrates that this economy has the ability to manufacture up to 9 tons of
wheat and 9000 sets of cloths, or 4000 sets of cloths and 20 tons of wheat simultaneously.
c. With the current resources as we can see from the PPF Curve, it is impossible
for this economy to produce 20 tons of wheat and 10,000 sets of cloths. If it
makes 10,000 sets of cloths, there will be no wheat grown.
d. Opportunity costs of producing wheat and cloths: A to B B to C C to D D to E Out of wheat 1/9 2/6 3/5 4/5 Out of cloths 5/4 5/3 6/2 9/1
Tài liệu liên quan:
-

Chương 3: độ co giãn và các nhân tố ảnh hưởng | Microeconomics | Trường Đại học Quốc tế, Đại học Quốc gia Thành phố Hồ Chí Minh
5 3 -

Microeconomics Syllabus | Microeconomics | Trường Đại học Quốc tế, Đại học Quốc gia Thành phố Hồ Chí Minh
5 3 -

Microeconomics Course Syllabus & Assessment Details | Microeconomics | Trường Đại học Quốc tế, Đại học Quốc gia Thành phố Hồ Chí Minh
5 3 -

Assignment 3 - Elasticity MCQs and Key Concepts | Microeconomics | Trường Đại học Quốc tế, Đại học Quốc gia Thành phố Hồ Chí Minh
5 3 -

Assignment 2 - Economic Equilibrium Analysis of Fridges and Motorcycles | Microeconomics | Trường Đại học Quốc tế, Đại học Quốc gia Thành phố Hồ Chí Minh
5 3