Microeconomics Midterm Exam 2 Review Questions and Answers | Microeconomics | Trường Đại học Quốc tế, Đại học Quốc gia Thành phố Hồ Chí Minh
The market demand curve shows how the total quantity demanded of a good varies as the income of buyers varies, while all the other factors that affect how much consumers want to buy are held constant. 2. If something happens to alter the quantity demanded at any given price, then the demand curve shifts. 3. A movement upward and to the left along a given demand curve is called a decrease in demand.. 4. An increase in demand shifts the demand curve to the left. 5. If the demand for a good falls when income falls, then the good is called an inferior good. Tài liệu được sưu tầm và soạn thảo dưới dạng file PDF để gửi tới các bạn cùng tham khảo, ôn tập đầy đủ kiến thức, chuẩn bị cho các buổi học thật tốt. Mời bạn đọc đón xem!
Môn: Microeconomics 635 tài liệu
Trường: Trường Đại học Quốc tế, Đại học Quốc gia Thành phố Hồ Chí Minh 1.9 K tài liệu
Tác giả:
Preview text:
MICROECONOMICS EXAM 1 (No 2) TRUE/FALSE 1.
The market demand curve shows how the total quantity demanded of a good varies as the income of buyers
varies, while all the other factors that affect how much consumers want to buy are held constant. 2.
If something happens to alter the quantity demanded at any given price, then the demand curve shifts. 3.
A movement upward and to the left along a given demand curve is called a decrease in demand. 4.
An increase in demand shifts the demand curve to the left. 5.
If the demand for a good falls when income falls, then the good is called an inferior good. 6.
When Mario's income decreases, he buys more pasta. For Mario, pasta is a normal good. 7.
A decrease in income will shift the demand curve for an inferior good to the right. 8.
An increase in the price of a substitute good will shift the demand curve for a good to the right. 9.
Baseballs and baseball bats are substitute goods.
10. A decrease in the price of a complement will shift the demand curve for a good to the left. SHORT ANSWER 1.
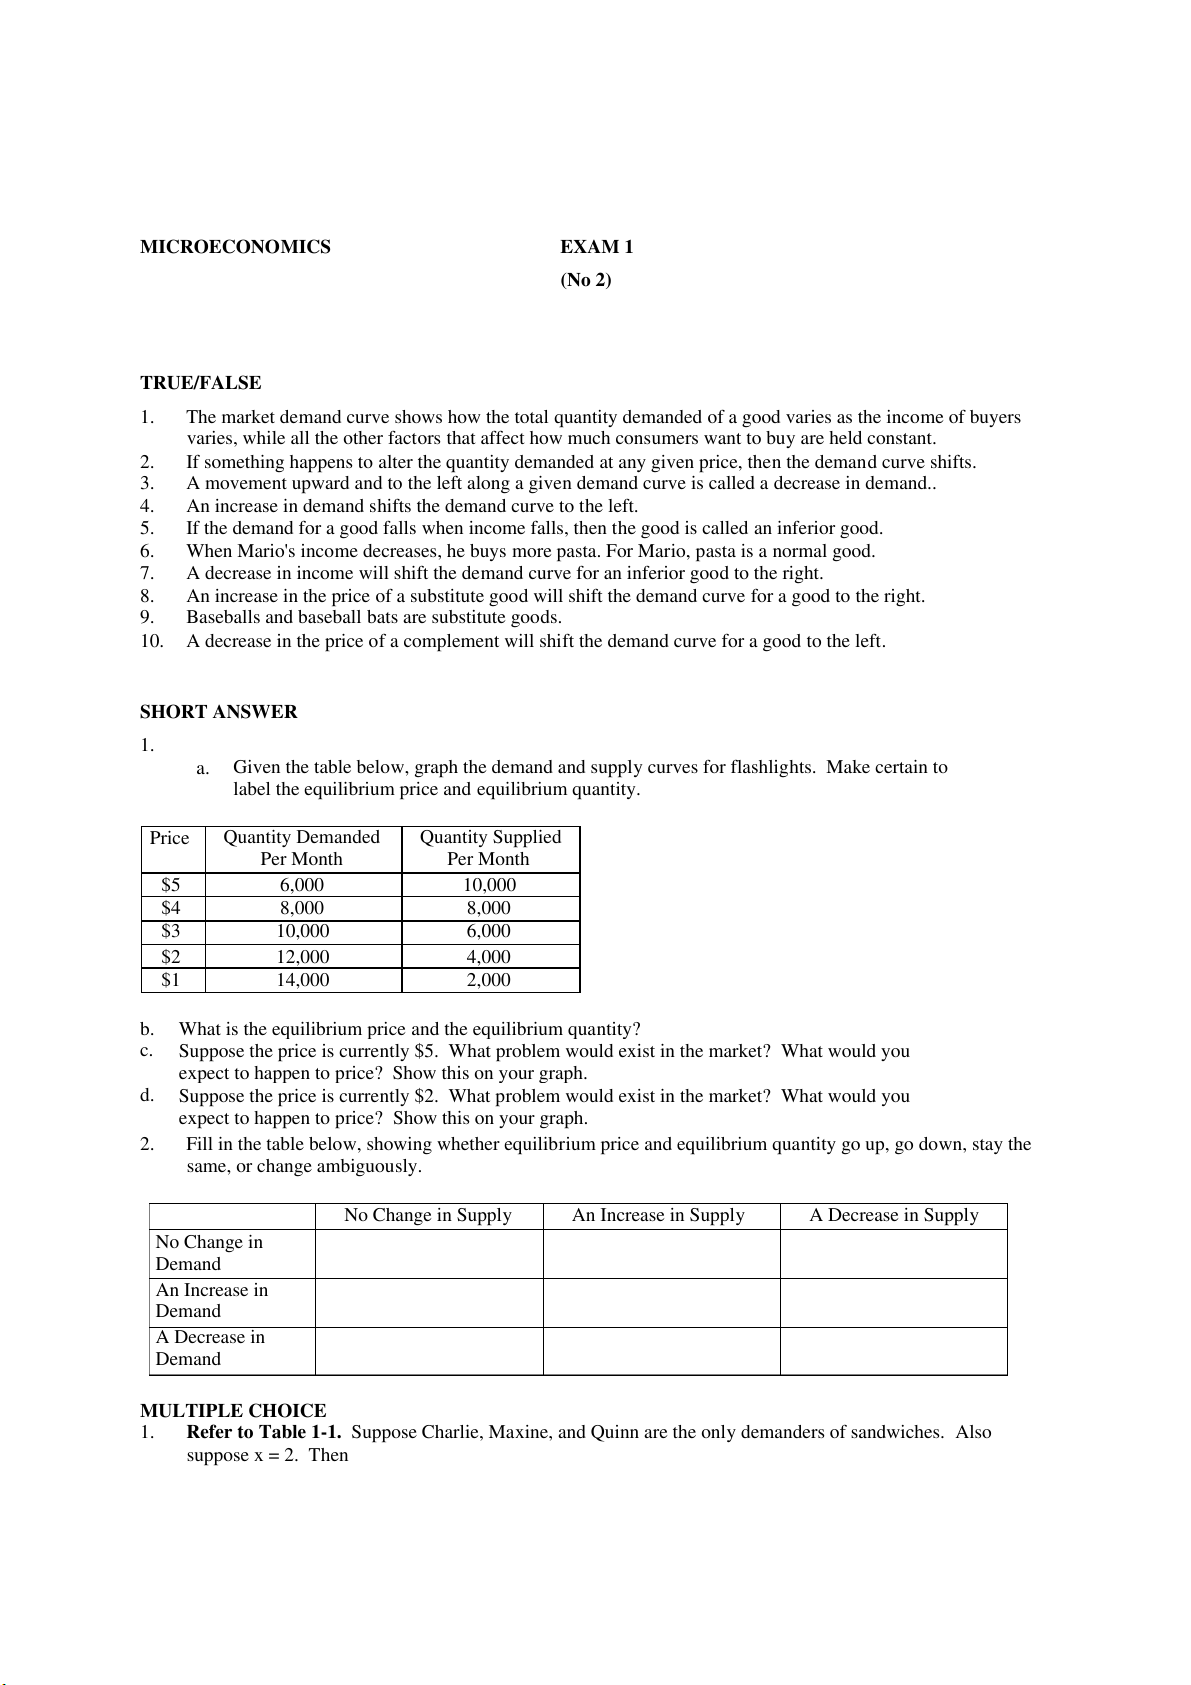
a. Given the table below, graph the demand and supply curves for flashlights. Make certain to
label the equilibrium price and equilibrium quantity.
Price Quantity Demanded Quantity Supplied Per Month Per Month $5 6,000 10,000 $4 8,000 8,000 $3 10,000 6,000 $2 12,000 4,000 $1 14,000 2,000
b. What is the equilibrium price and the equilibrium quantity?
c. Suppose the price is currently $5. What problem would exist in the market? What would you
expect to happen to price? Show this on your graph.
d. Suppose the price is currently $2. What problem would exist in the market? What would you
expect to happen to price? Show this on your graph. 2.
Fill in the table below, showing whether equilibrium price and equilibrium quantity go up, go down, stay the same, or change ambiguously. No Change in Supply An Increase in Supply A Decrease in Supply No Change in Demand An Increase in Demand A Decrease in Demand MULTIPLE CHOICE 1.
Refer to Table 1-1. Suppose Charlie, Maxine, and Quinn are the only demanders of sandwiches. Also suppose x = 2. Then
a. the slope of Quinn’s demand curve is -1/2 and the slope of the market demand curve is -5/2.
b. the slope of Quinn’s demand curve is -1/2 and the slope of the market demand curve is -2/5.
c. the slope of Quinn’s demand curve is -2 and the slope of the market demand curve is -5/2.
d. the slope of Quinn’s demand curve is -2 and the slope of the market demand curve is -2/5. 2.
Refer to Table 1-1. Suppose Charlie, Maxine, and Quinn are the only demanders of sandwiches and that the
market demand violates the law of demand. Then, in the table, a. x 5. b. x 5. c. x 7. d. x 10. 3.
Refer to Table 1-1. Suppose Charlie, Maxine, and Quinn are the only demanders of sandwiches. Also suppose the following: • x = 2
• the current price of a sandwich is $5.00
• the market quantity supplied of sandwiches is 10
• the law of supply applies to the supply of sandwiches
Then a. there is a shortage of 5 sandwiches and the price would be expected to rise from its current level of $5.00.
b. there is a shortage of 5 sandwiches and the price would be expected to fall from its current level of $5.00.
c. there is a surplus of 5 sandwiches and the price would be expected to rise from its current level of $5.00.
d. there is a surplus of 5 sandwiches and the price would be expected to fall from its current level of $5.00. 4.
Refer to Table 1-1. Suppose Charlie, Maxine, and Quinn are the only demanders of sandwiches. Also suppose the following: • x = 2
• the current price of a sandwich is $3.00
• the market quantity supplied of sandwiches is 4
• the slope of the supply curve is 2
Then a. there is currently a shortage of 6 sandwiches and the equilibrium price of a sandwich is less than $3.00.
b. there is currently a shortage of 6 sandwiches and the equilibrium price of a sandwich is $5.00.
c. there is currently a surplus of 6 sandwiches and the equilibrium price of a sandwich is less than $3.00.
d. there is currently a surplus of 6 sandwiches and the equilibrium price of a sandwich is $5.00. 5.
Refer to Table 1-1. Suppose Charlie, Maxine, and Quinn are the only demanders of sandwiches. Also suppose the following: • x = 2
• the current price of a sandwich is $3.00
• the market quantity supplied of sandwiches is 5
• the slope of the supply curve is 1
Then a. there is currently a shortage of 5 sandwiches and the equilibrium price of a sandwich is between $3.00 and $5.00.
b. there is currently a shortage of 5 sandwiches and the equilibrium price of a sandwich is $5.00.
c. there is currently a surplus of 5 sandwiches and the equilibrium price of a sandwich is between $3.00 and $5.00.
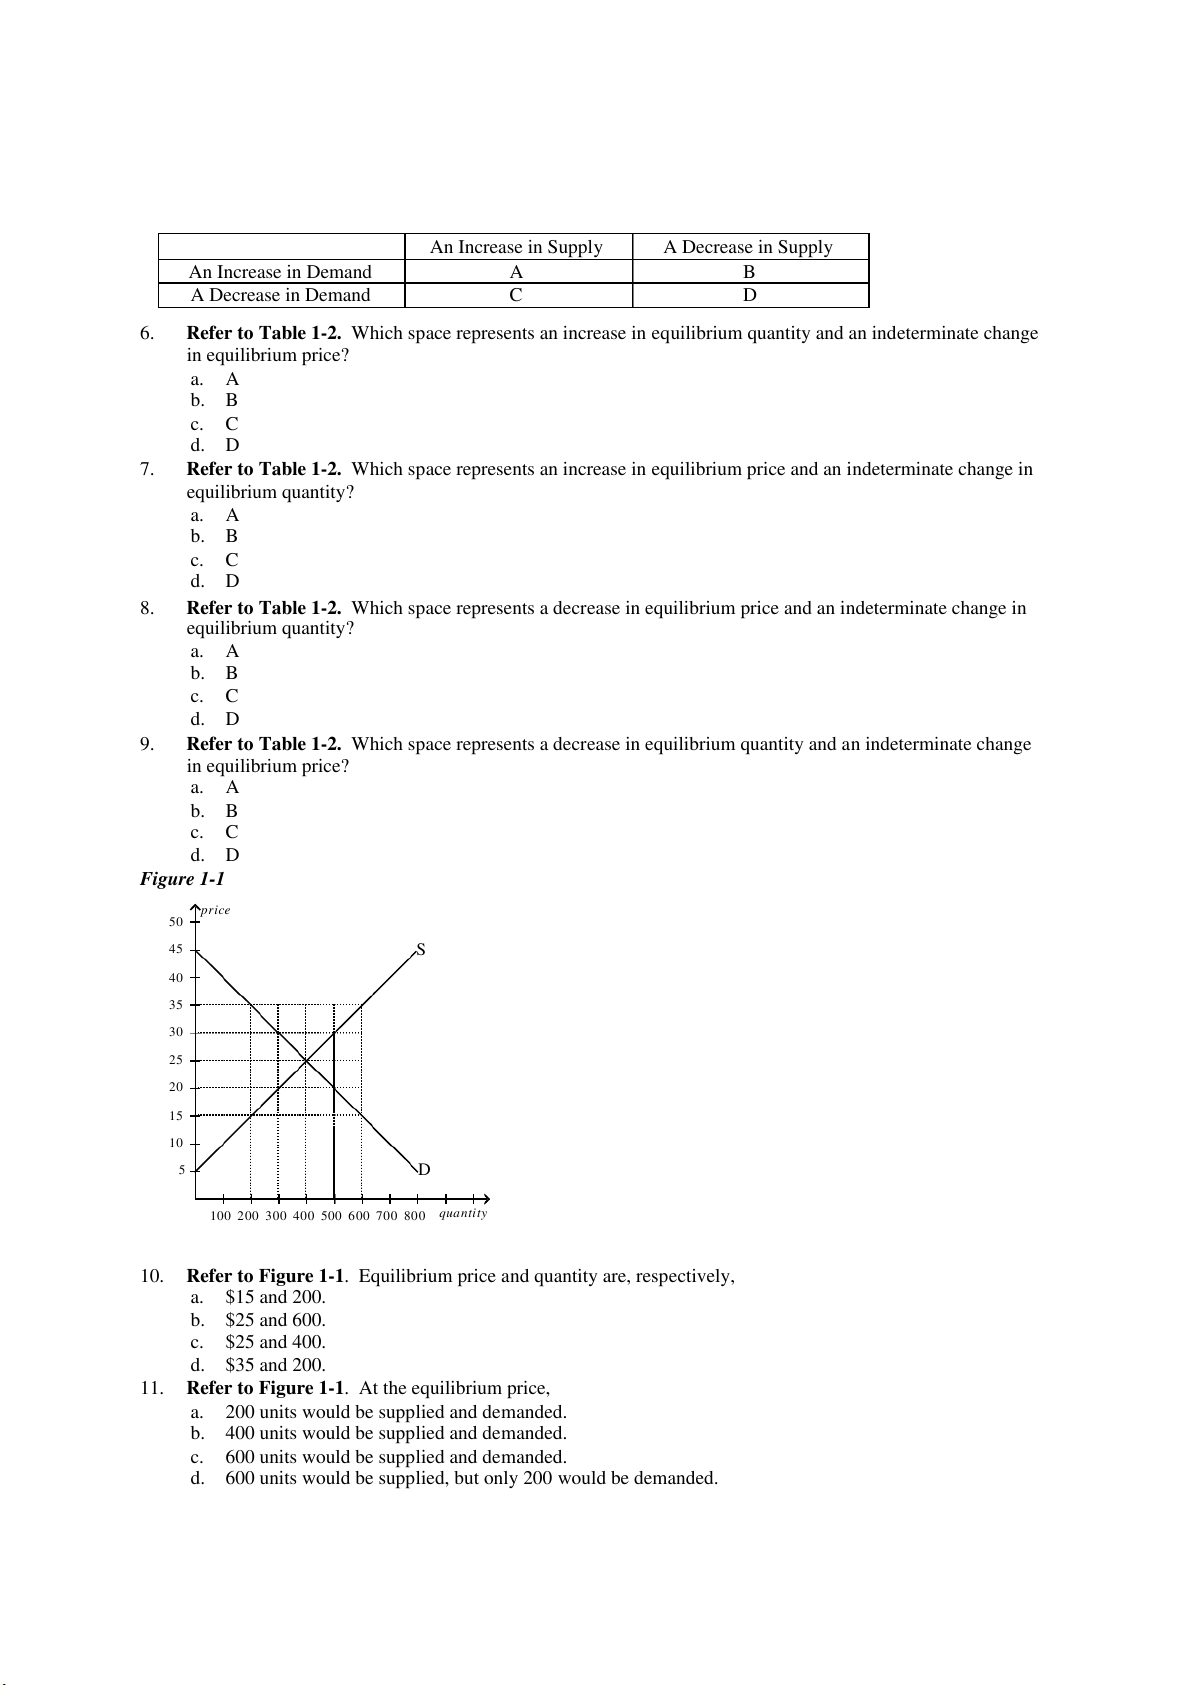
d. there is currently a surplus of 5 sandwiches and the equilibrium price of a sandwich is $5.00. Table 1-2 An Increase in Supply A Decrease in Supply An Increase in Demand A B A Decrease in Demand C D 6.
Refer to Table 1-2. Which space represents an increase in equilibrium quantity and an indeterminate change in equilibrium price? a. A b. B c. C d. D 7.
Refer to Table 1-2. Which space represents an increase in equilibrium price and an indeterminate change in equilibrium quantity? a. A b. B c. C d. D 8.
Refer to Table 1-2. Which space represents a decrease in equilibrium price and an indeterminate change in equilibrium quantity? a. A b. B c. C d. D 9.
Refer to Table 1-2. Which space represents a decrease in equilibrium quantity and an indeterminate change in equilibrium price? a. A b. B c. C d. D Figure 1-1 price 50 45 S 40 35 30 25 20 15 10 5 D
100 200 300 400 500 600 700 800 quantity
10. Refer to Figure 1-1. Equilibrium price and quantity are, respectively, a. $15 and 200. b. $25 and 600. c. $25 and 400. d. $35 and 200.
11. Refer to Figure 1-1. At the equilibrium price,
a. 200 units would be supplied and demanded.
b. 400 units would be supplied and demanded.
c. 600 units would be supplied and demanded.
d. 600 units would be supplied, but only 200 would be demanded.
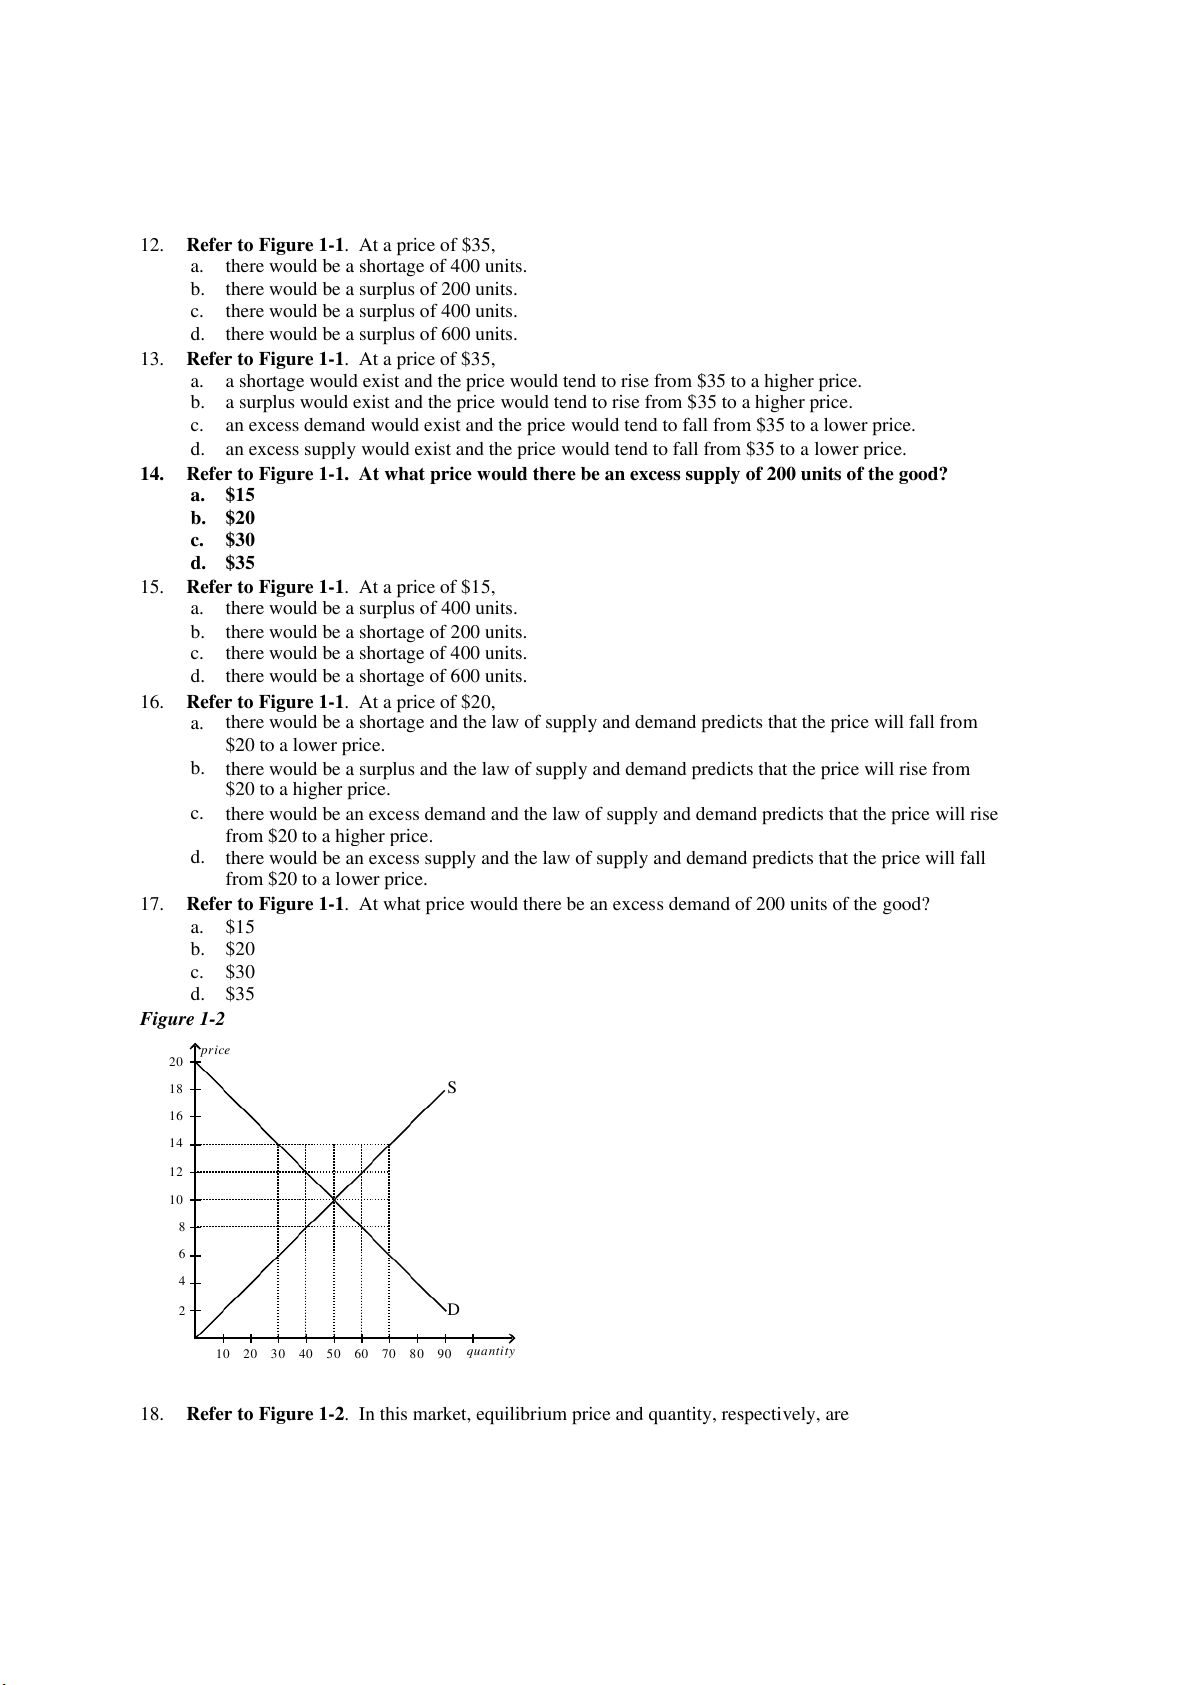
12. Refer to Figure 1-1. At a price of $35,
a. there would be a shortage of 400 units.
b. there would be a surplus of 200 units.
c. there would be a surplus of 400 units.
d. there would be a surplus of 600 units.
13. Refer to Figure 1-1. At a price of $35,
a. a shortage would exist and the price would tend to rise from $35 to a higher price.
b. a surplus would exist and the price would tend to rise from $35 to a higher price.
c. an excess demand would exist and the price would tend to fall from $35 to a lower price.
d. an excess supply would exist and the price would tend to fall from $35 to a lower price.
14. Refer to Figure 1-1. At what price would there be an excess supply of 200 units of the good? a. $15 b. $20 c. $30 d. $35
15. Refer to Figure 1-1. At a price of $15,
a. there would be a surplus of 400 units.
b. there would be a shortage of 200 units.
c. there would be a shortage of 400 units.
d. there would be a shortage of 600 units.
16. Refer to Figure 1-1. At a price of $20,
a. there would be a shortage and the law of supply and demand predicts that the price will fall from $20 to a lower price.
b. there would be a surplus and the law of supply and demand predicts that the price will rise from $20 to a higher price.
c. there would be an excess demand and the law of supply and demand predicts that the price will rise from $20 to a higher price.
d. there would be an excess supply and the law of supply and demand predicts that the price will fall from $20 to a lower price.
17. Refer to Figure 1-1. At what price would there be an excess demand of 200 units of the good? a. $15 b. $20 c. $30 d. $35 Figure 1-2 price 20 18 S 16 14 12 10 8 6 4 2 D
10 20 30 40 50 60 70 80 90 quantity
18. Refer to Figure 1-2. In this market, equilibrium price and quantity, respectively, are a. $10 and 30. b. $10 and 50. c. $10 and 70. d. $4 and 50.
19. Refer to Figure 1-2. If price in this market is currently $14, then there would be a(n)
a. surplus of 20 units and the law of supply and demand predicts that the price will rise from $14 to a higher price.
b. excess supply of 20 units and the law of supply and demand predicts that the price will fall from $14 to a lower price.
c. surplus of 40 units and the law of supply and demand predicts that the price will rise from $14 to a higher price.
d. excess supply of 40 units and the law of supply and demand predicts that the price will fall from $14 to a lower price.
20. Refer to Figure 1-2. If there is currently a shortage of 20 units of the good, then
a. the law of demand predicts that the price will rise by $2 to eliminate the shortage.
b. the law of supply predicts that the price will rise by $2 to eliminate the shortage.
c. the law of supply and demand predicts that the price will rise by $2 to eliminate the shortage.
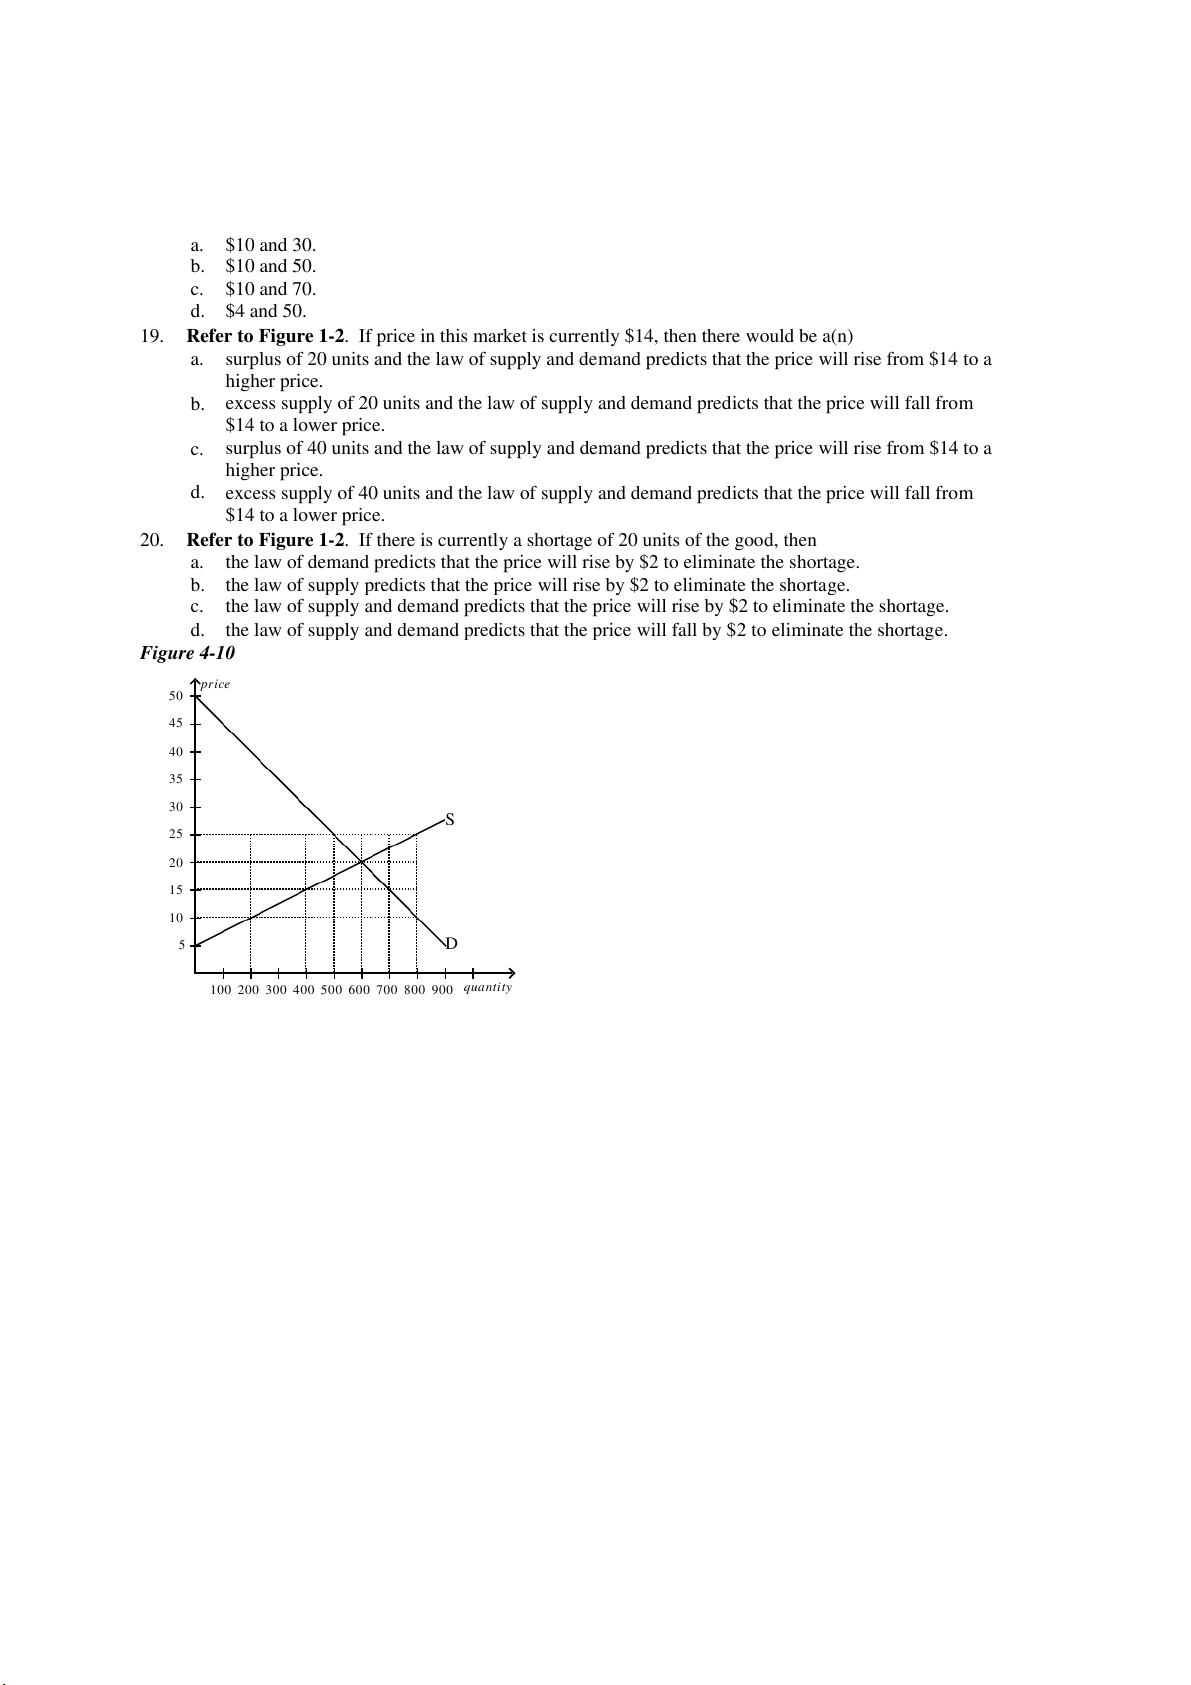
d. the law of supply and demand predicts that the price will fall by $2 to eliminate the shortage. Figure 4-10 price 50 45 40 35 30 S 25 20 15 10 5 D
100 200 300 400 500 600 700 800 900 quantity
Tài liệu liên quan:
-

Chương 3: độ co giãn và các nhân tố ảnh hưởng | Microeconomics | Trường Đại học Quốc tế, Đại học Quốc gia Thành phố Hồ Chí Minh
4 2 -

Microeconomics Syllabus | Microeconomics | Trường Đại học Quốc tế, Đại học Quốc gia Thành phố Hồ Chí Minh
4 2 -

Microeconomics Course Syllabus & Assessment Details | Microeconomics | Trường Đại học Quốc tế, Đại học Quốc gia Thành phố Hồ Chí Minh
4 2 -

Assignment 3 - Elasticity MCQs and Key Concepts | Microeconomics | Trường Đại học Quốc tế, Đại học Quốc gia Thành phố Hồ Chí Minh
4 2 -

Assignment 2 - Economic Equilibrium Analysis of Fridges and Motorcycles | Microeconomics | Trường Đại học Quốc tế, Đại học Quốc gia Thành phố Hồ Chí Minh
4 2