Microeconomics Revision Notes | Microeconomics | Trường Đại học Quốc tế, Đại học Quốc gia Thành phố Hồ Chí Minh
When a society cannot produce all the goods and services people wish to have, it is said that the economy is experiencing a. scarcity. b. surpluses. c. inefficiencies. d. inequalities. 2.The phenomenon of scarcity stems from the fact that a. most economies’ production methods are not very good. b. in most economies, wealthy people consume disproportionate quantities of goods and services. c. governments restrict production of too many goods and services. d. resources are limited. Tài liệu được sưu tầm và soạn thảo dưới dạng file PDF để gửi tới các bạn cùng tham khảo, ôn tập đầy đủ kiến thức, chuẩn bị cho các buổi học thật tốt. Mời bạn đọc đón xem!
Môn: Microeconomics 635 tài liệu
Trường: Trường Đại học Quốc tế, Đại học Quốc gia Thành phố Hồ Chí Minh 1.9 K tài liệu
Tác giả:

Preview text:
MICROECONOMICS REVISION (2)
1.When a society cannot produce all the goods and services people wish to have, it is said that the economy is experiencing a. scarcity. b. surpluses. c. inefficiencies. d. inequalities.
2.The phenomenon of scarcity stems from the fact that
a. most economies’ production methods are not very good.
b. in most economies, wealthy people consume disproportionate quantities of goods and services.
c. governments restrict production of too many goods and services. d. resources are limited. 3. Economics is the study of a. production methods.
b. how society manages its scarce resources.
c. how households decide who performs which tasks.
d. the interaction of business and government.
4.Economists use the word equality to describe a situation in which
a. each member of society has the same income.
b. each member of society has access to abundant quantities of goods and services,
regardless of his or her income.
c. society is getting the maximum benefits from its scarce resources.
d. society's resources are used efficiently. 5.Efficiency means that
a. society is conserving resources in order to save them for the future.
b. society's goods and services are distributed equally among society's members.
c. society's goods and services are distributed fairly, though not necessarily equally, among society's members.
d. society is getting the maximum benefits from its scarce resources.
6.The opportunity cost of an item is
a. the number of hours needed to earn money to buy the item.
b. what you give up to get that item.
c. usually less than the dollar value of the item.
d. the dollar value of the item.
7.When computing the opportunity cost of attending a concert you should include
a. the price you pay for the ticket and the value of your time.
b. the price you pay for the ticket, but not the value of your time.
c. the value of your time, but not the price you pay for the ticket.
d. neither the price of the ticket nor the value of your time.
8. Denise decides to spend three hours working overtime rather than watching a video with her friends.
She earns $10 an hour. Her opportunity cost of working is a. the $30 she earns working.
b. the $30 minus the enjoyment she would have received from watching the video.
c. the enjoyment she would have received had she watched the video.
d. nothing, since she would have received less than $30 of enjoyment from the video.
9. The opportunity cost of going to college is
a. the total spent on food, clothing, books, transportation, tuition, lodging, and other expenses.
b. the value of the best opportunity a student gives up to attend college.
c. zero for students who are fortunate enough to have all of their college expenses paid by someone else.
d. zero, since a college education will allow a student to earn a larger income after graduation.
10. Suppose after graduating from college you get a job working at a bank earning $30,000 per year.
After two years of working at the bank earning the same salary, you have an opportunity to enroll
in a one-year graduate program that would require you to quit your job at the bank. Which of the
following should not be included in a calculation of your opportunity cost?
a. the cost of tuition and books to attend the graduate program
b. the $30,000 salary that you could have earned if you retained your job at the bank
c. the $45,000 salary that you will be able to earn after having completed your graduate program
d. the value of insurance coverage and other employee benefits you would have received if
you retained your job at the bank
11. A rational decision maker takes an action only if the
a. marginal benefit is less than the marginal cost.
b. marginal benefit is greater than the marginal cost.
c. average benefit is greater than the average cost.
d. marginal benefit is greater than both the average cost and the marginal cost.
12. Making rational decisions "at the margin" means that people
a. make those decisions that do not impose a marginal cost.
b. evaluate how easily a decision can be reversed if problems arise.
c. compare the marginal costs and marginal benefits of each decision.
d. always calculate the dollar costs for each decision.
13. After much consideration, you have chosen Ireland over Spain for your Study Abroad program
next year. However, the deadline for your final decision is still months away and you may
reverse this decision. Which of the following events would prompt you to reverse this decision?
a. The marginal benefit of going to Spain increases.
b. The marginal cost of going to Spain increases.
c. The marginal benefit of going to Ireland increases.
d. The marginal cost of going to Ireland decreases.
14. A construction company has built 30 houses so far this year at a total cost to the company of $7.5
million. If the company builds a 31st house, its total cost will increase to $7.76 million. Which of
the following statements is correct?
a. For the first 30 houses, the average cost per house was $250,000.
b. The marginal cost of the 31st house, if it is built, will be $260,000.
c. If the company can experience a marginal benefit of $275,000 by building the 31st house,
then the company should build it.
d. All of the above are correct.
15. You are considering staying in college another semester so that you can complete a major in
economics. In deciding whether or not to stay you should
a. compare the total cost of your education to the total benefits of your education.
b. compare the total cost of your education to the benefits of staying one more semester.
c. compare the cost of staying one more semester to the benefits of staying one more semester.
d. compare the total benefits of your education to the cost of staying one more semester.
16. In a market economy, who makes the decisions that guide most economic activity? a. firms only b. households only c. firms and households d. Government
17. A circular-flow diagram is a model that
a. helps to explain how participants in the economy interact with one another.
b. helps to explain how the economy is organized.
c. incorporates all aspects of the real economy.
d. Both (a) and (b) are correct. 18. The circular-flow diagram a. is an economic model.
b. incorporates two types of decision makers: households and firms.
c. represents the flows of inputs, outputs, and dollars.
d. All of the above are correct. 19. Factors of production are
a. used to produce goods and services. b. also called output.
c. abundant in most economies.
d. assumed to be owned by firms in the circular-flow diagram. 20.
In the circular-flow diagram, which of the following is not a factor of production? a. labor b. land c. capital d. Money 21.
Which markets are represented in the simple circular-flow diagram?
a. markets for goods and services and markets for financial assets
b. markets for factors of production and markets for financial assets
c. markets for goods and services and markets for factors of production
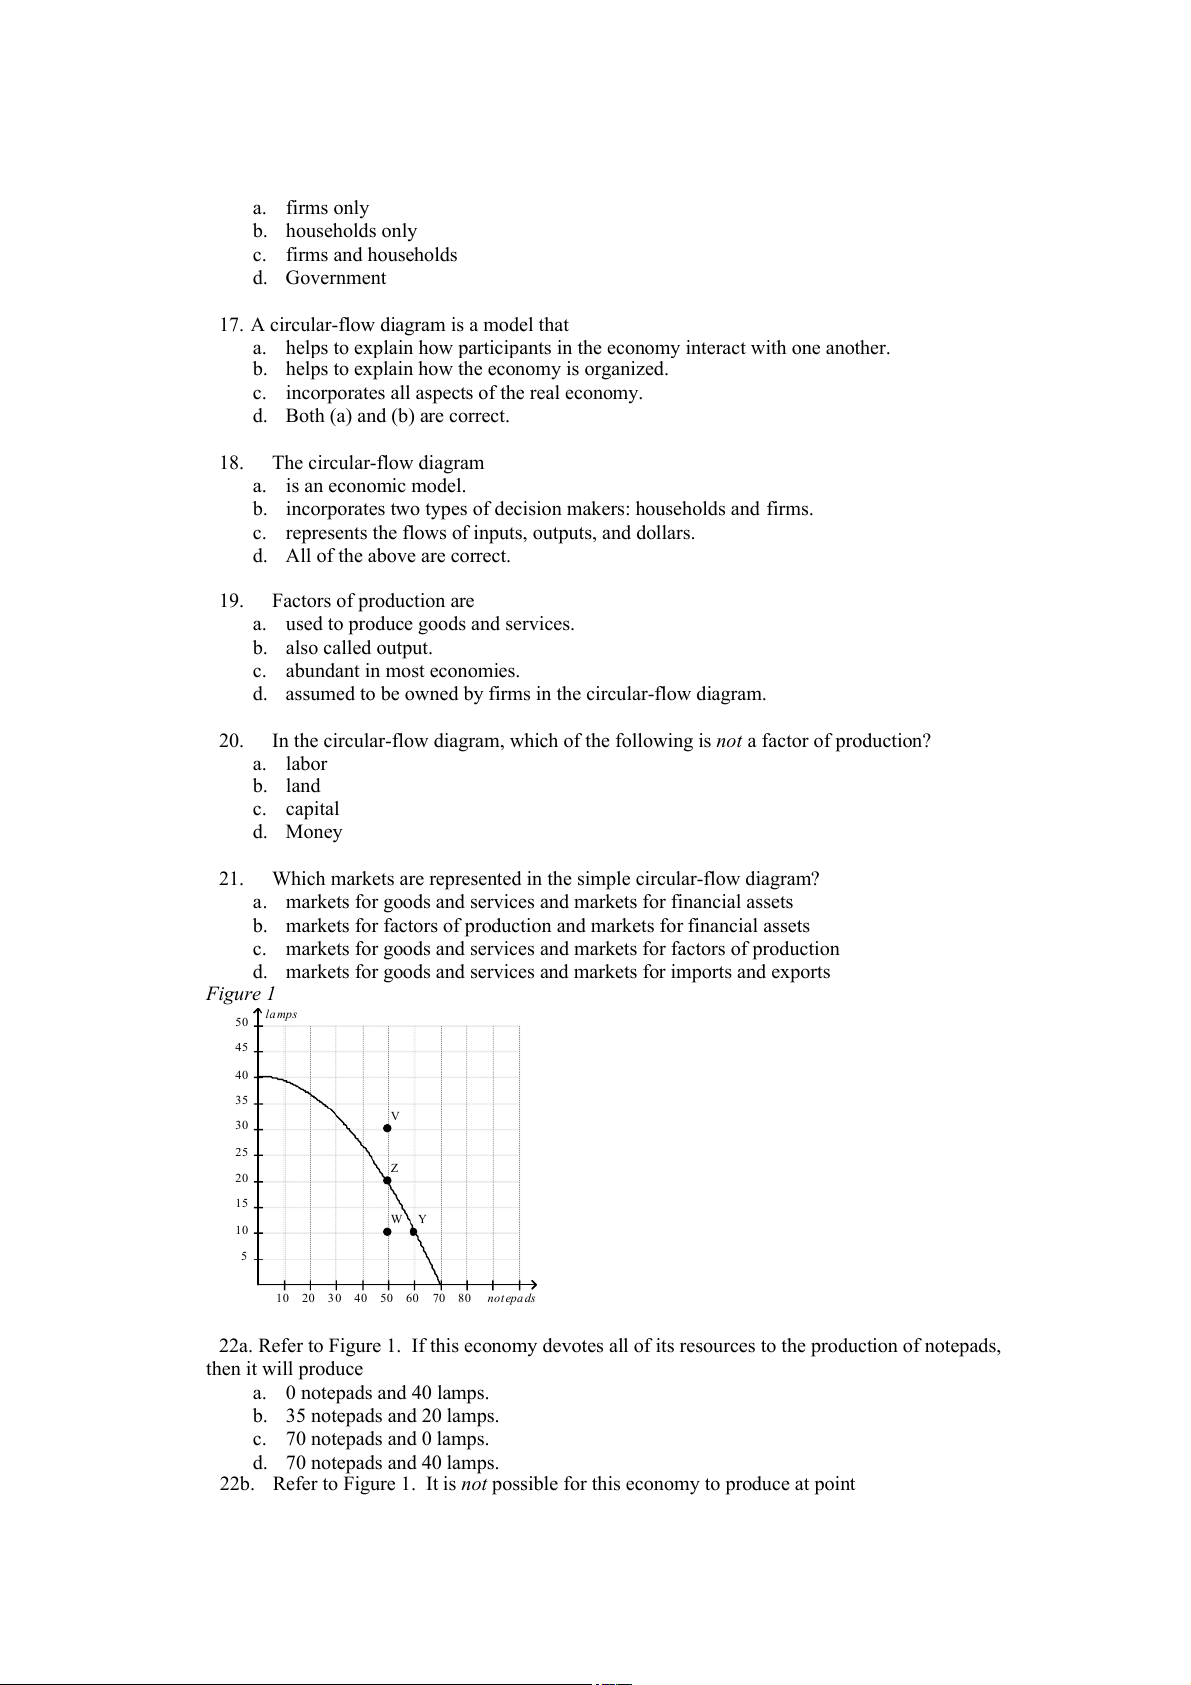
d. markets for goods and services and markets for imports and exports Figure 1 la mps 50 45 40 35 V 30 25 Z 20 15 W Y 10 5 10 20 3 0 40 50 60 70 80 not epa ds
22a. Refer to Figure 1. If this economy devotes all of its resources to the production of notepads, then it will produce a. 0 notepads and 40 lamps. b. 35 notepads and 20 lamps. c. 70 notepads and 0 lamps. d. 70 notepads and 40 lamps.
22b. Refer to Figure 1. It is not possible for this economy to produce at point a. V. b. W. c. Y. d. Z.
22.c. Refer to Figure 1. Efficient production is represented by which point(s)? a. Y, Z b. W, Y, Z c. V, Y, Z d. V
22.d. Refer to Figure 1. Inefficient production is represented by which point(s)? a. Y, Z b. V c. V, W d. W
22.e Refer to Figure 1. The opportunity cost of obtaining 20 additional lamps by moving from point W to point V is a. 0 notepads. b. 10 notepads. c. 50 notepads.
d. None of the above; the economy cannot move from point W to point V. 23
Microeconomics is the study of
a. how money affects the economy.
b. how individual households and firms make decisions.
c. how government affects the economy.
d. how the economy as a whole works. 24.
Which of the following areas of study typifies microeconomics as opposed to macroeconomics?
a. the impact of minimum-wage laws on employment in the fast food industry
b. the effect of changes in household saving rates on the growth rate of national income
c. the impact of faster money growth on the rate of inflation
d. a comparison of alternative tax policies and their respective impacts on the rate of the nation’s economic growth 25.
When economists are trying to explain the world, they are a. scientists. b. policy advisers.
c. in the realm of microeconomics rather than macroeconomics.
d. in the realm of normative economics rather than positive economics. 26.
When economists are trying to help improve the world, they are
a. in the realm of positive economics rather than normative economics.
b. in the realm of macroeconomics rather than microeconomics. c. scientists. d. policy advisers. 27. Normative statements are
a. prescriptive, whereas positive statements are descriptive.
b. descriptive, whereas positive statements are prescriptive.
c. backward-looking, whereas positive statements are forward -looking.
d. forward-looking, whereas positive statements are backward -looking. 28.
“Prices rise when the quantity of money rises rapidly” is an example of a
a. negative economic statement.
b. positive economic statement.
c. normative economic statement.
d. statement that contradicts one of the basic principles of economics. 29.
Which of the following is not an example of a positive, as opposed to normative, statement?
a. Higher gasoline prices will reduce gasoline consumption.
b. Equality is more important than efficiency.
c. Trade restrictions lower our standard of living.
d. If a nation wants to avoid inflation, it will restrict the growth rate of the quantity of money. 30.
Which of the following is an example of a normative, as opposed to positive, statement?
a. The price of gasoline came down sharply during the second half of 2006.
b. If the government were to set a maximum legal price on gasoline, then there would be a shortage of gasoline.
c. Income taxes should be reduced.
d. The federal government obtains much of its revenue from income taxes.
31. An increase in quantity demanded
a. results in a movement downward and to the right along a demand curve.
b. results in a movement upward and to the left along a demand curve.
c. shifts the demand curve to the left.
d. shifts the demand curve to the right.
32. A decrease in the price of a good would
a. increase the supply of the good.
b. increase the quantity demanded of the good.
c. give producers an incentive to produce more to keep profits from falling.
d. shift the supply curve for the good to the left.
33. When we move along a given demand curve,
a. only price is held constant.
b. income and price are held constant.
c. all nonprice determinants of demand are held constant.
d. all determinants of quantity demanded are held constant.
34. When quantity demanded decreases at every possible price, the demand curve has a. shifted to the left. b. shifted to the right.
c. not shifted; rather, we have moved along the demand curve to a new point on the same curve.
d. not shifted; rather, the demand curve has become flatter.
35. Which of the following changes would not shift the demand curve for a good or service? a. a change in income
b. a change in the price of the good or service
c. a change in expectations about the future price of the good or service
d. a change in the price of a related good or service
36. Which of the following would shift the demand curve for gasoline to the right?
a. a decrease in the price of gasoline
b. an increase in consumer income, assuming gasoline is a normal good
c. an increase in the price of cars, a complement for gasoline
d. a decrease in the expected future price of gasoline
37. Currently you purchase ten frozen pizza per month. You will graduate from college in December,
and you will start a new job in January. You have no plans to purchase frozen pizzas in January.
For you, frozen pizzas are a(n) a. substitute good. b. normal good. c. inferior good. d. complementary good.
38. If macaroni and cheese is an inferior good, then an increase in
a. the price will cause the demand curve for macaroni and cheese to shift to the left.
b. the price will cause the demand curve for macaroni and cheese to shift to the right.
c. a consumer’s income will cause the demand curve for macaroni and cheese to shift to the left.
d. a consumer’s income will cause the demand curve for macaroni and cheese to shift to the right.
39. Two goods are substitutes when a decrease in the price of one good
a. decreases the demand for the other good.
b. decreases the quantity demanded of the other good.
c. increases the demand for the other good.
d. increases the quantity demanded of the other good.
40. If a study by medical researchers finds that eating brown rice causes weight loss while eating white
rice causes weight gain, then we likely would see
a. an increase in demand for brown rice and a decrease in demand for white rice.
b. a decrease in demand for brown rice and an increase in demand for white rice.
c. an increase in demand for both brown and white rice.
d. no change in demand for either type of rice because weight loss is not a determinant of demand.
41. Which of the following events could shift the demand curve for gasoline to the left?
a. The income of gasoline buyers rises, and gasoline is a normal good.
b. The income of gasoline buyers falls, and gasoline is an inferior good.
c. Public service announcements run on television encourage people to walk or ride bicycles instead of driving cars.
d. The price of gasoline rises.
42. Today's supply curve for gasoline could shift in response to a change in a. today's price of gasoline.
b. the expected future price of gasoline.
c. the number of buyers of gasoline.
d. All of the above are correct.
43. Which of the following is a determinant of the market supply curve but not a determinant of an individual seller’s supply? a. production technology b. expectations c. input prices d. the number of sellers
44. Which of the following events must cause equilibrium price to rise?
a. demand increases and supply decreases
b. demand and supply both decrease
c. demand decreases and supply increases
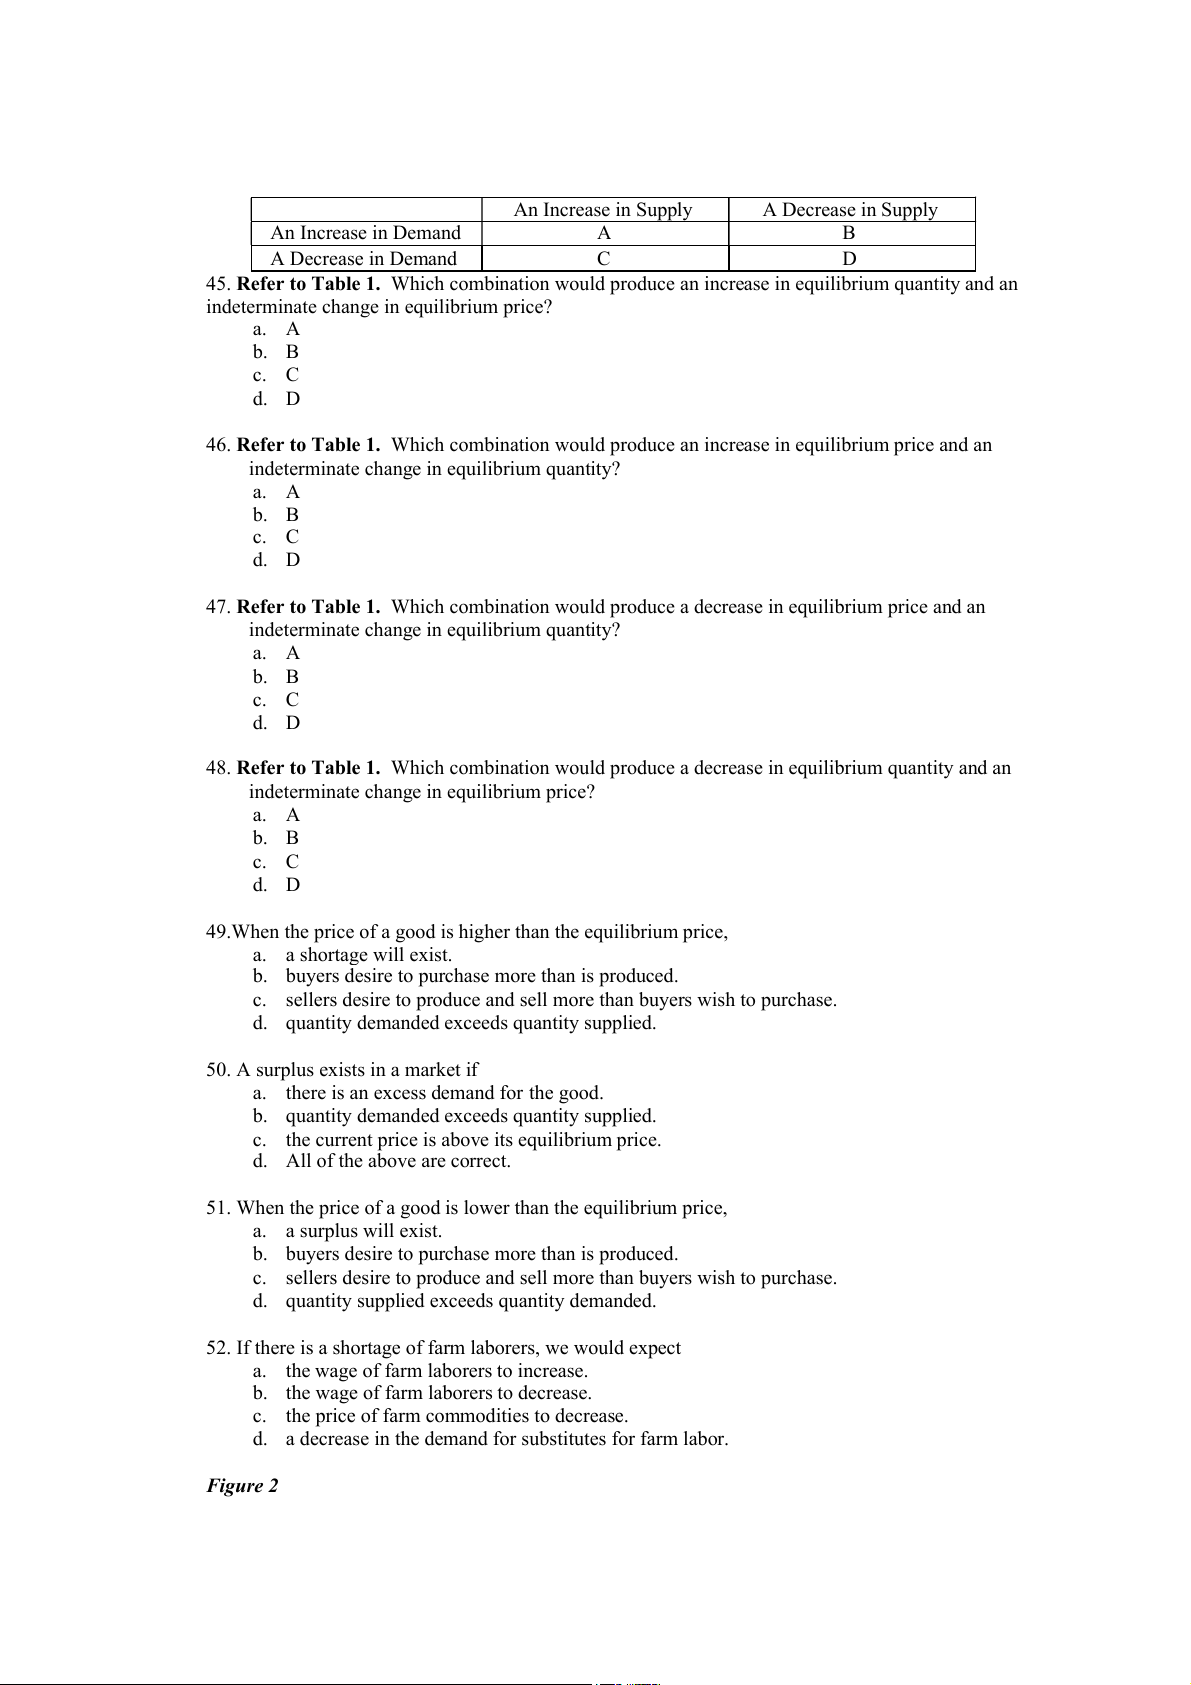
d. demand and supply both increase Table 1 An Increase in Supply A Decrease in Supply An Increase in Demand A B A Decrease in Demand C D
45. Refer to Table 1. Which combination would produce an increase in equilibrium quantity and an
indeterminate change in equilibrium price? a. A b. B c. C d. D
46. Refer to Table 1. Which combination would produce an increase in equilibrium price and an
indeterminate change in equilibrium quantity? a. A b. B c. C d. D
47. Refer to Table 1. Which combination would produce a decrease in equilibrium price and an
indeterminate change in equilibrium quantity? a. A b. B c. C d. D
48. Refer to Table 1. Which combination would produce a decrease in equilibrium quantity and an
indeterminate change in equilibrium price? a. A b. B c. C d. D
49.When the price of a good is higher than the equilibrium price, a. a shortage will exist.
b. buyers desire to purchase more than is produced.
c. sellers desire to produce and sell more than buyers wish to purchase.
d. quantity demanded exceeds quantity supplied.
50. A surplus exists in a market if
a. there is an excess demand for the good.
b. quantity demanded exceeds quantity supplied.
c. the current price is above its equilibrium price.
d. All of the above are correct.
51. When the price of a good is lower than the equilibrium price, a. a surplus will exist.
b. buyers desire to purchase more than is produced.
c. sellers desire to produce and sell more than buyers wish to purchase.
d. quantity supplied exceeds quantity demanded.
52. If there is a shortage of farm laborers, we would expect
a. the wage of farm laborers to increase.
b. the wage of farm laborers to decrease.
c. the price of farm commodities to decrease.
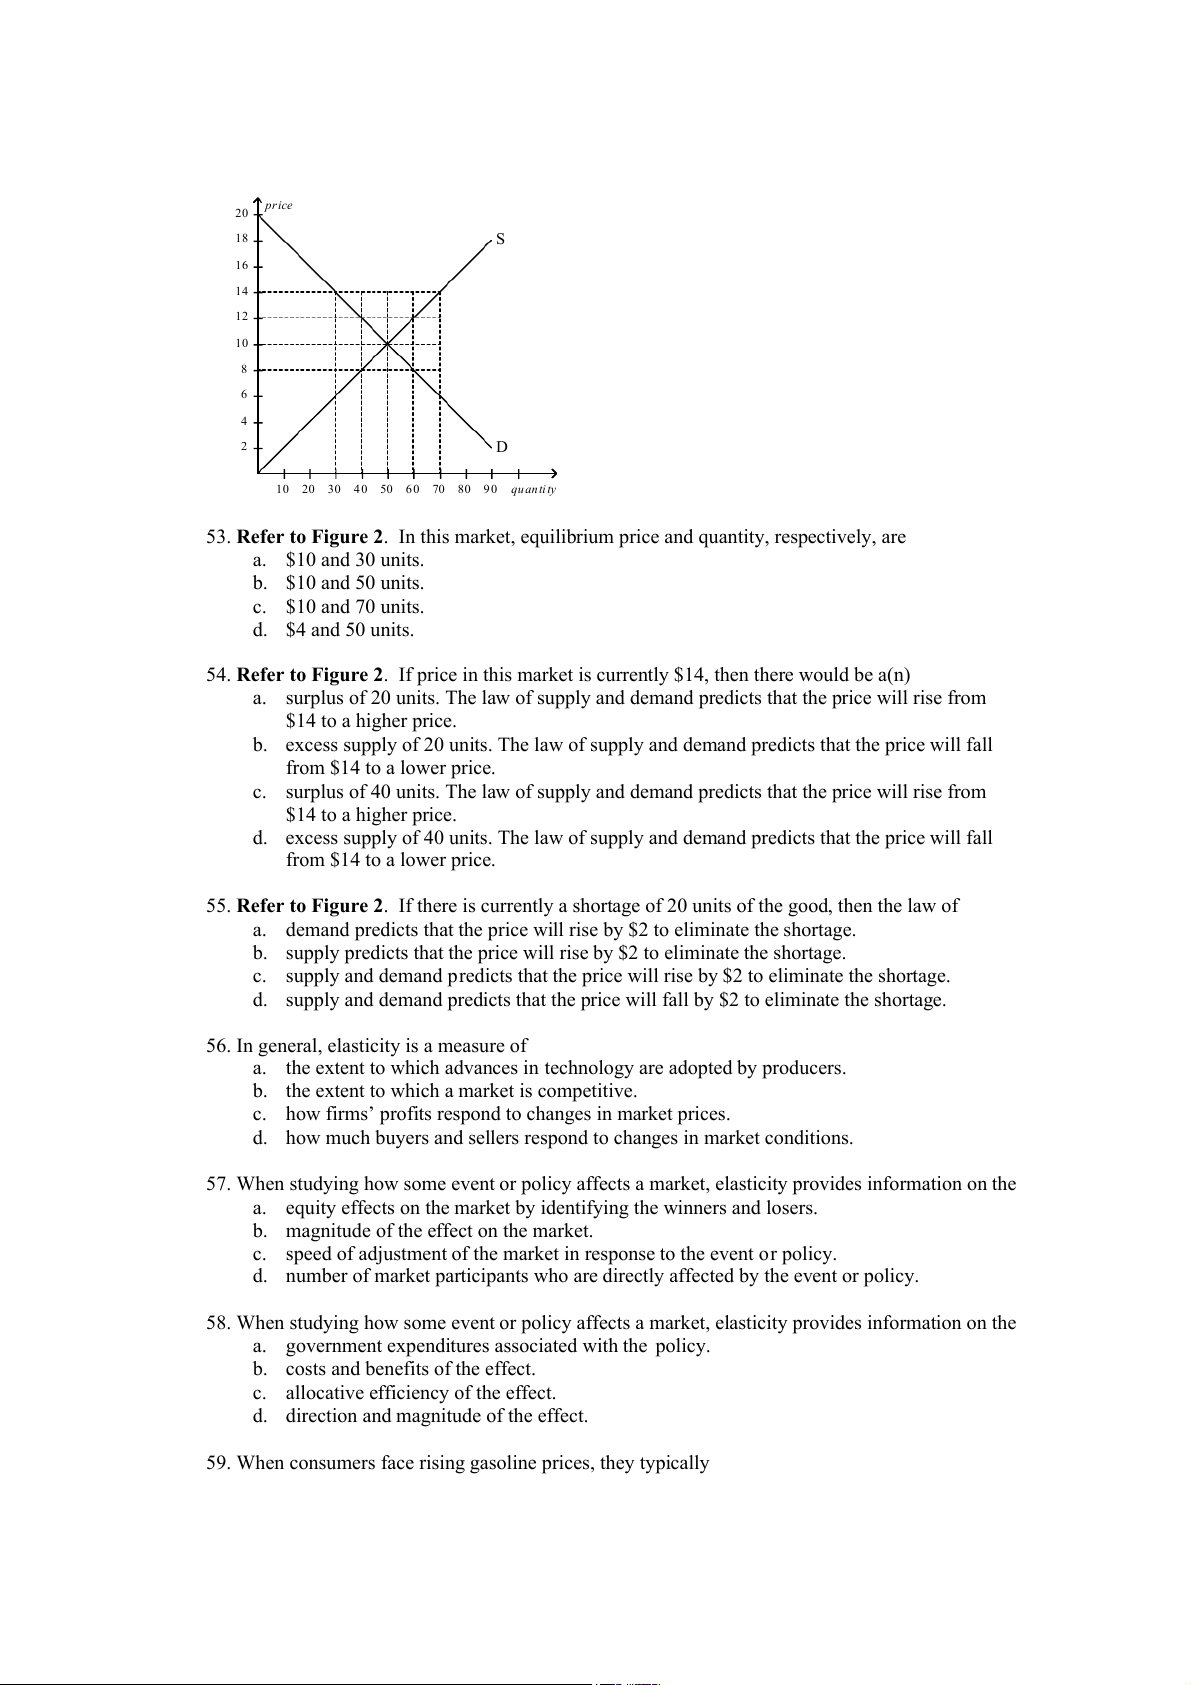
d. a decrease in the demand for substitutes for farm labor. Figure 2 pr ice 20 18 S 16 14 12 10 8 6 4 2 D 10 20 30 4 0 50 6 0 70 80 9 0 qu an ti ty
53. Refer to Figure 2. In this market, equilibrium price and quantity, respectively, are a. $10 and 30 units. b. $10 and 50 units. c. $10 and 70 units. d. $4 and 50 units.
54. Refer to Figure 2. If price in this market is currently $14, then there would be a(n)
a. surplus of 20 units. The law of supply and demand predicts that the price will rise from $14 to a higher price.
b. excess supply of 20 units. The law of supply and demand predicts that the price will fall from $14 to a lower price.
c. surplus of 40 units. The law of supply and demand predicts that the price will rise from $14 to a higher price.
d. excess supply of 40 units. The law of supply and demand predicts that the price will fall from $14 to a lower price.
55. Refer to Figure 2. If there is currently a shortage of 20 units of the good, then the law of
a. demand predicts that the price will rise by $2 to eliminate the shortage.
b. supply predicts that the price will rise by $2 to eliminate the shortage.
c. supply and demand predicts that the price will rise by $2 to eliminate the shortage.
d. supply and demand predicts that the price will fall by $2 to eliminate the shortage.
56. In general, elasticity is a measure of
a. the extent to which advances in technology are adopted by producers.
b. the extent to which a market is competitive.
c. how firms’ profits respond to changes in market prices.
d. how much buyers and sellers respond to changes in market conditions.
57. When studying how some event or policy affects a market, elasticity provides information on the
a. equity effects on the market by identifying the winners and losers.
b. magnitude of the effect on the market.
c. speed of adjustment of the market in response to the event or policy.
d. number of market participants who are directly affected by the event or policy.
58. When studying how some event or policy affects a market, elasticity provides information on the
a. government expenditures associated with the policy.
b. costs and benefits of the effect.
c. allocative efficiency of the effect.
d. direction and magnitude of the effect.
59. When consumers face rising gasoline prices, they typically
a. reduce their quantity demanded more in the long run than in the short run.
b. reduce their quantity demanded more in the short run than in the long run.
c. do not reduce their quantity demanded in the short run or the long run.
d. increase their quantity demanded in the short run but reduce their quantity demanded in the long run.
60. A 10 percent increase in gasoline prices reduces gasoline consumption by about
a. 6 percent after one year and 2.5 percent after five years.
b. 2.5 percent after one year and 6 percent after five years.
c. 10 percent after one year and 20 percent after five years.
d. 0 percent after one year and 1 percent after five years.
61. The price elasticity of demand measures
a. buyers’ responsiveness to a change in the price of a good.
b. the extent to which demand increases as additional buyers enter the market.
c. how much more of a good consumers will demand when incomes rise.
d. the movement along a supply curve when there is a change in demand.
62. Which of the following is not a determinant of the price elasticity of demand for a good? a. the time horizon
b. the steepness or flatness of the supply curve for the good
c. the definition of the market for the good
d. the availability of substitutes for the good
63. The greater the price elasticity of demand, the
a. more likely the product is a necessity.
b. smaller the responsiveness of quantity demanded to a change in price.
c. greater the percentage change in price over the percentage change in quantity demanded.
d. greater the responsiveness of quantity demanded to a change in price. Table 2 Good Price Elasticity of Demand A 1.3 B 2.1
64. Refer to Table 2. Which of the following is consistent with the elasticities given in Table 5-2?
a. A is a luxury, and B is a necessity.
b. A is a good several years after a price increase, and B is that same good several days after the price increase.
c. A is a Kit Kat bar, and B is candy.
d. A has fewer substitutes than B.
65. Elasticity of demand is closely related to the slope of the demand curve. The less responsive
buyers are to a change in price, the
a. steeper the demand curve will be.
b. flatter the demand curve will be.
c. further to the right the demand curve will sit.
d. closer to the vertical axis the demand curve will sit.
66. When the price of bubble gum is $0.50, the quantity demanded is 400 packs per day. When the
price falls to $0.40, the quantity demanded increases to 600. Given this information and using the
midpoint method, we know that the demand for bubble gum is a. inelastic. b. elastic. c. unit elastic. d. perfectly inelastic.
67. For a horizontal demand curve,
a. the slope is undefined, and the price elasticity of demand is equal to 0.
b. the slope is equal to 0, and the price elasticity of demand is undefined.
c. both the slope and price elasticity of demand are undefined.
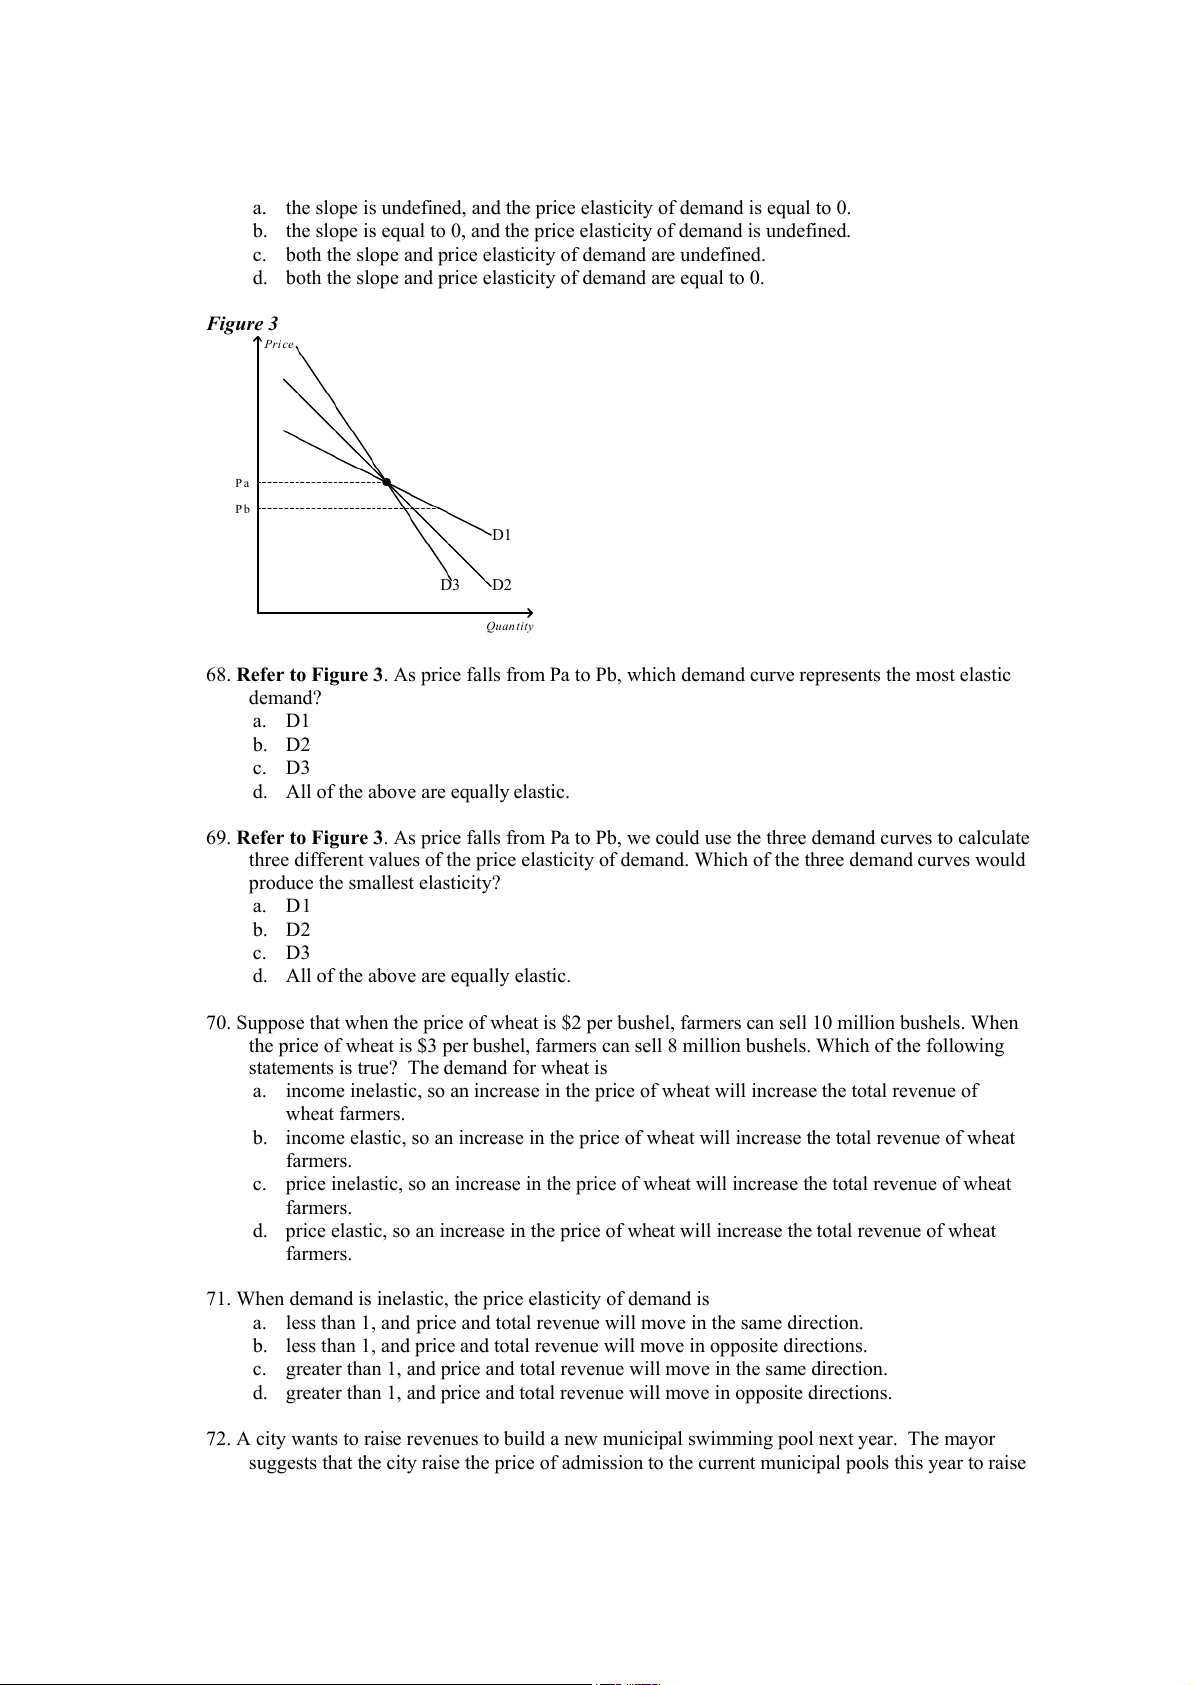
d. both the slope and price elasticity of demand are equal to 0. Figure 3 Pri ce P a P b D1 D3 D2 Quan tity
68. Refer to Figure 3. As price falls from Pa to Pb, which demand curve represents the most elastic demand? a. D1 b. D2 c. D3
d. All of the above are equally elastic.
69. Refer to Figure 3. As price falls from Pa to Pb, we could use the three demand curves to calculate
three different values of the price elasticity of demand. Which of the three demand curves would
produce the smallest elasticity? a. D1 b. D2 c. D3
d. All of the above are equally elastic.
70. Suppose that when the price of wheat is $2 per bushel, farmers can sell 10 million bushels. When
the price of wheat is $3 per bushel, farmers can sell 8 million bushels. Which of the following
statements is true? The demand for wheat is
a. income inelastic, so an increase in the price of wheat will increase the total revenue of wheat farmers.
b. income elastic, so an increase in the price of wheat will increase the total revenue of wheat farmers.
c. price inelastic, so an increase in the price of wheat will increase the total revenue of wheat farmers.
d. price elastic, so an increase in the price of wheat will increase the total revenue of wheat farmers.
71. When demand is inelastic, the price elasticity of demand is
a. less than 1, and price and total revenue will move in the same direction.
b. less than 1, and price and total revenue will move in opposite directions.
c. greater than 1, and price and total revenue will move in the same direction.
d. greater than 1, and price and total revenue will move in opposite directions.
72. A city wants to raise revenues to build a new municipal swimming pool next year. The mayor
suggests that the city raise the price of admission to the current municipal pools this year to raise
revenues. The city manager suggests that the city lower the price of admission to raise revenues. Who is correct?
a. Both the mayor and city manager would be correct if demand were price elastic.
b. Both the mayor and city manager would be correct if demand were price inelastic.
c. The mayor would be correct if demand were price elastic; the city manager would be
correct if demand were price inelastic.
d. The mayor would be correct if demand were price inelastic; the city manager would be
correct if demand were price elastic.
73. Income elasticity of demand measures how
a. the quantity demanded changes as consumer income changes.
b. consumer purchasing power is affected by a change in the price of a good.
c. the price of a good is affected when there is a change in consumer income.
d. many units of a good a consumer can buy given a certain income level.
74. To determine whether a good is considered normal or inferior, one could examine the value of the
a. income elasticity of demand for that good.
b. price elasticity of demand for that good.
c. price elasticity of supply for that good.
d. cross- price elasticity of demand for that good.
75. A bakery would be willing to supply 500 bagels per day at a price of $0.50 each. At a price of
$0.80, the bakery would be willing to supply 1,100 bagels. Using the midpoint method, the price
elasticity of supply for bagels is about a. 0.62. b. 0.77. c. 1.24. d. 1.63.
76. A decrease in supply will cause the largest increase in price when
a. both supply and demand are inelastic.
b. both supply and demand are elastic.
c. demand is elastic and supply is inelastic.
d. demand is inelastic and supply is elastic.
77. Because the demand for wheat tends to be inelastic, the development of a new, more productive hybrid wheat would tend to
a. increase the total revenue of wheat farmers.
b. decrease the total revenue of wheat farmers.
c. decrease the demand for wheat.
d. decrease the supply of wheat. 78. A binding price ceiling (i) causes a surplus. (ii) causes a shortage.
(iii) is set at a price above the equilibrium price.
(iv) is set at a price below the equilibrium price. a. (ii) only b. (iv) only c. (i) and (iii) only d. (ii) and (iv) only
79. A nonbinding price ceiling (i) causes a surplus. (ii) causes a shortage.
(iii) is set at a price above the equilibrium price.
(iv) is set at a price below the equilibrium price. a. (i) only b. (iii) only c. (i) and (iii) only d. (ii) and (iv) only
80. If a price ceiling is a binding constraint on a market, then
a. the equilibrium price must be below the price ceiling.
b. the quantity supplied must exceed the quantity demanded.
c. sellers cannot sell all they want to sell at the price ceiling.
d. buyers cannot buy all they want to buy at the price ceiling. 81. A price floor is
a. a legal minimum on the price at which a good can be sold.
b. often imposed when sellers of a good are successful in their attempts to convince the
government that the market outcome is unfair without a price floor.
c. a source of inefficiency in a market.
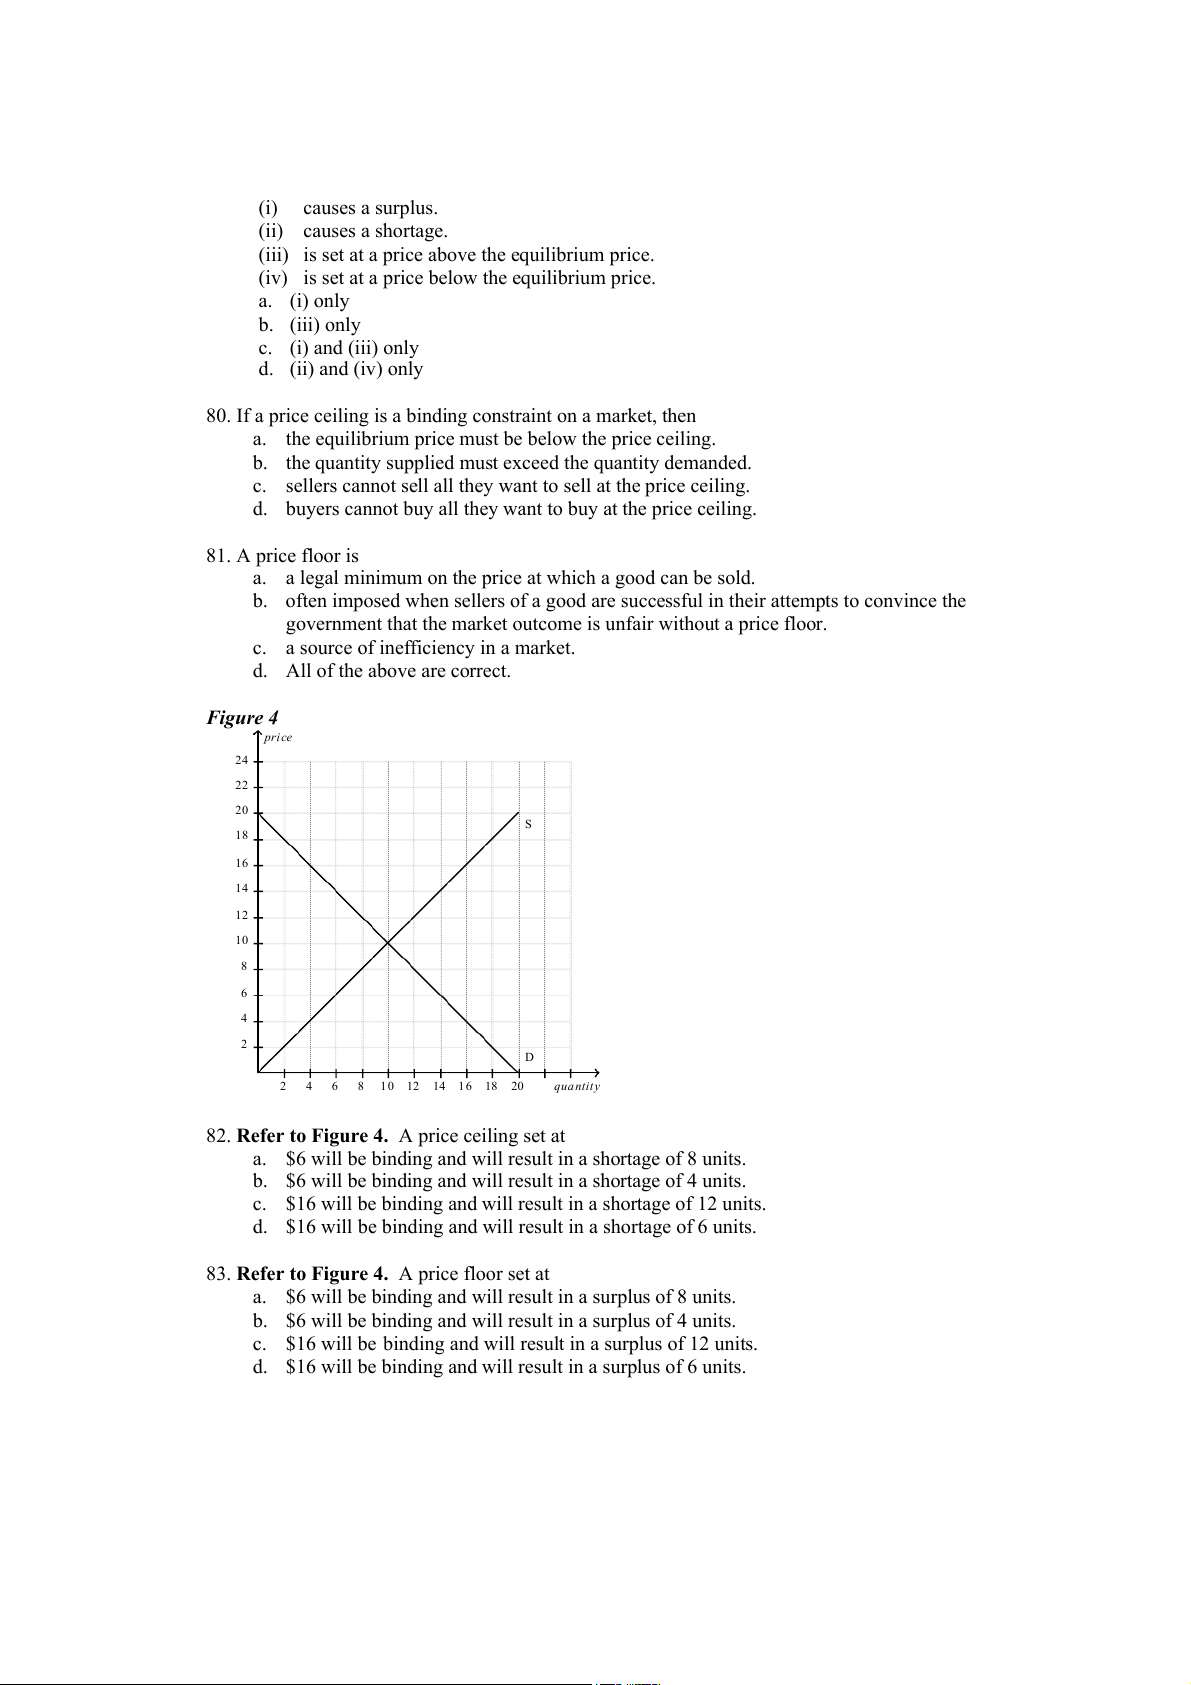
d. All of the above are correct. Figure 4 pri ce 24 22 20 S 18 16 14 12 10 8 6 4 2 D 2 4 6 8 1 0 12 14 1 6 18 20 qua ntit y
82. Refer to Figure 4. A price ceiling set at
a. $6 will be binding and will result in a shortage of 8 units.
b. $6 will be binding and will result in a shortage of 4 units.
c. $16 will be binding and will result in a shortage of 12 units.
d. $16 will be binding and will result in a shortage of 6 units.
83. Refer to Figure 4. A price floor set at
a. $6 will be binding and will result in a surplus of 8 units.
b. $6 will be binding and will result in a surplus of 4 units.
c. $16 will be binding and will result in a surplus of 12 units.
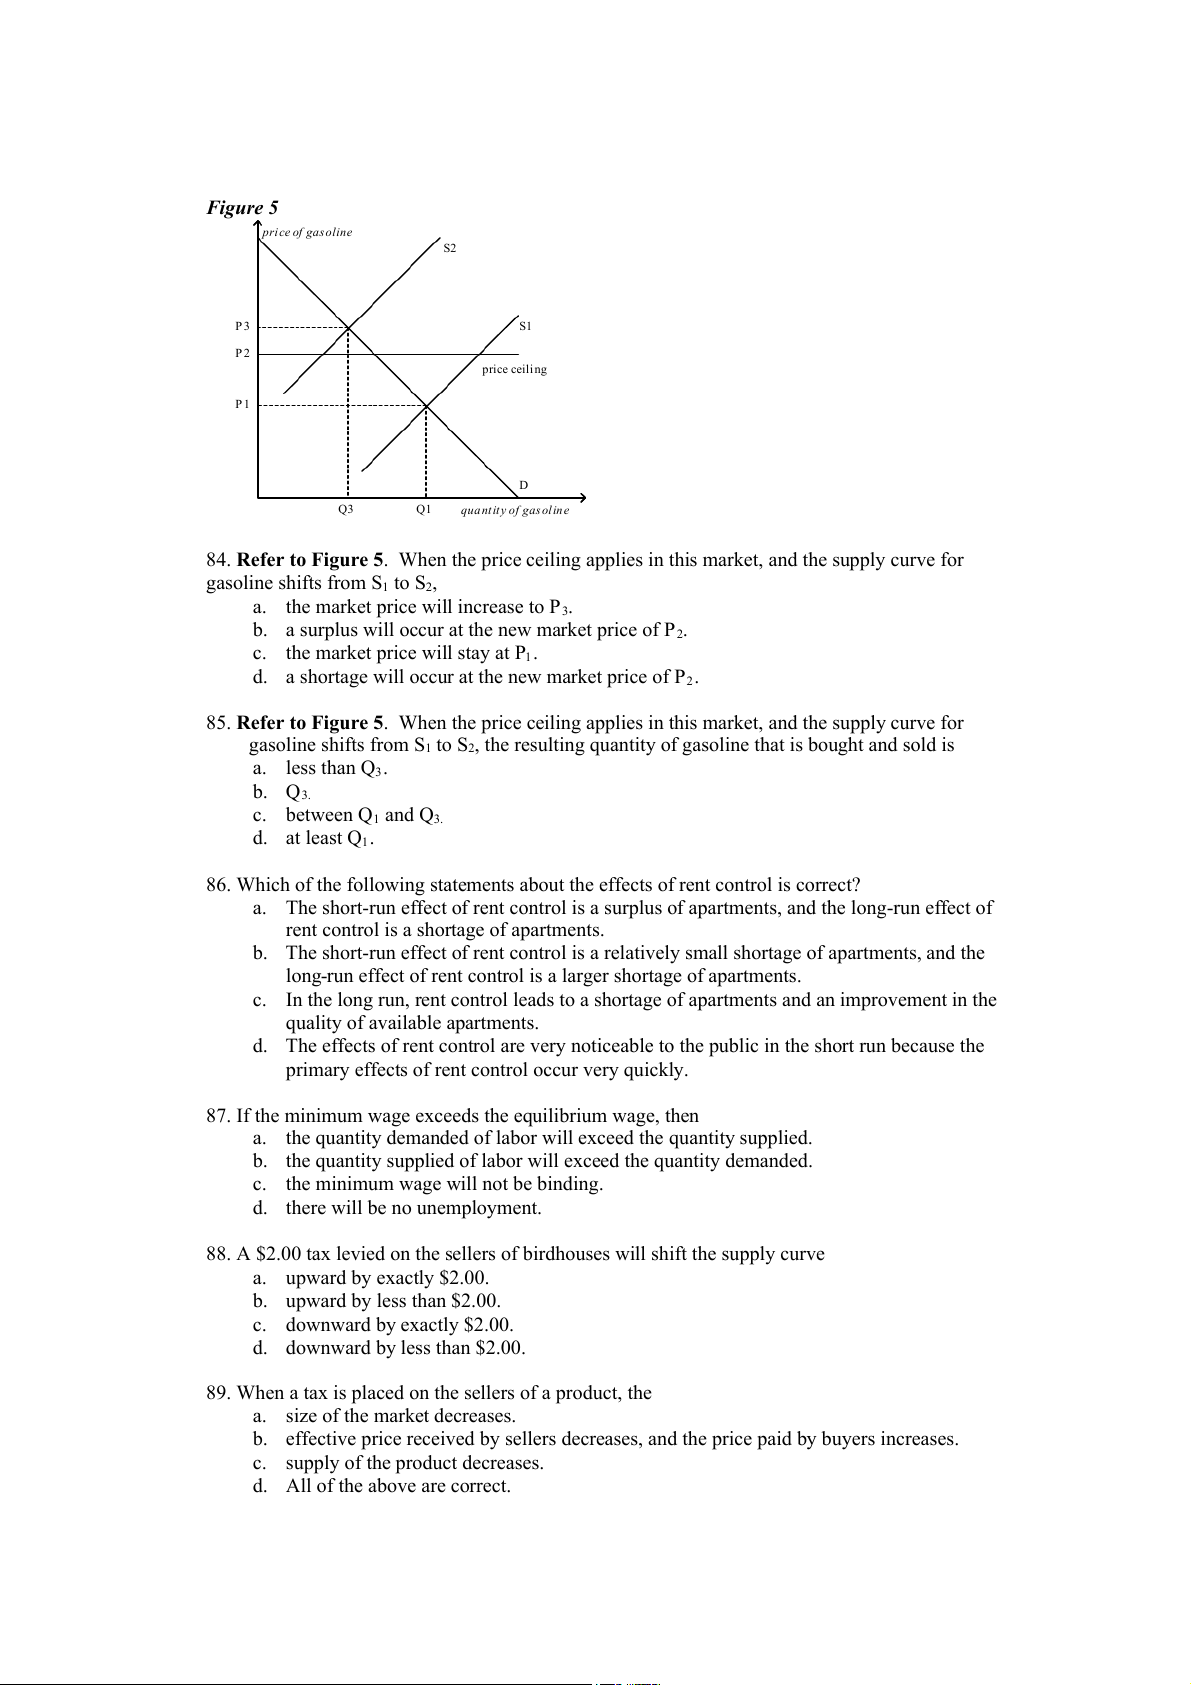
d. $16 will be binding and will result in a surplus of 6 units. Figure 5 pri ce of gas oline S2 P 3 S1 P 2 price ceili ng P 1 D Q3 Q1 qua nt it y of gas ol in e
84. Refer to Figure 5. When the price ceiling applies in this market, and the supply curve for
gasoline shifts from S1 to S2,
a. the market price will increase to P3.
b. a surplus will occur at the new market price of P2.
c. the market price will stay at P1.
d. a shortage will occur at the new market price of P2.
85. Refer to Figure 5. When the price ceiling applies in this market, and the supply curve for
gasoline shifts from S1 to S2, the resulting quantity of gasoline that is bought and sold is a. less than Q3. b. Q3. c. between Q1 and Q3. d. at least Q1.
86. Which of the following statements about the effects of rent control is correct?
a. The short-run effect of rent control is a surplus of apartments, and the long-run effect of
rent control is a shortage of apartments.
b. The short-run effect of rent control is a relatively small shortage of apartments, and the
long-run effect of rent control is a larger shortage of apartments.
c. In the long run, rent control leads to a shortage of apartments and an improvement in the
quality of available apartments.
d. The effects of rent control are very noticeable to the public in the short run because the
primary effects of rent control occur very quickly.
87. If the minimum wage exceeds the equilibrium wage, then
a. the quantity demanded of labor will exceed the quantity supplied.
b. the quantity supplied of labor will exceed the quantity demanded.
c. the minimum wage will not be binding.
d. there will be no unemployment.
88. A $2.00 tax levied on the sellers of birdhouses will shift the supply curve a. upward by exactly $2.00. b. upward by less than $2.00. c. downward by exactly $2.00.
d. downward by less than $2.00.
89. When a tax is placed on the sellers of a product, the
a. size of the market decreases.
b. effective price received by sellers decreases, and the price paid by buyers increases.
c. supply of the product decreases.
d. All of the above are correct.
90. A tax imposed on the buyers of a good will raise the
a. price paid by buyers and lower the equilibrium quantity.
b. price paid by buyers and raise the equilibrium quantity.
c. effective price received by sellers and lower the equilibrium quantity.
d. effective price received by sellers and raise the equilibrium quantity.
91. A $3 tax levied on the buyers of shoes will cause the
a. supply curve for shoes to shift down by $3.
b. supply curve for shoes to shift up by $3.
c. demand curve for shoes to shift down by $3.
d. demand curve for shoes to shift up by $3.
92. The term tax incidence refers to
a. whether buyers or sellers of a good are required to send tax payments to the government.
b. whether the demand curve or the supply curve shifts when the tax is imposed.
c. the distribution of the tax burden between buyers and sellers.
d. widespread view that taxes (and death) are the only certainties in life.
93. When a tax is placed on the buyers of lemonade, the
a. sellers bear the entire burden of the tax.
b. buyers bear the entire burden of the tax.
c. burden of the tax will be always be equally divided between the buyers and the sellers.
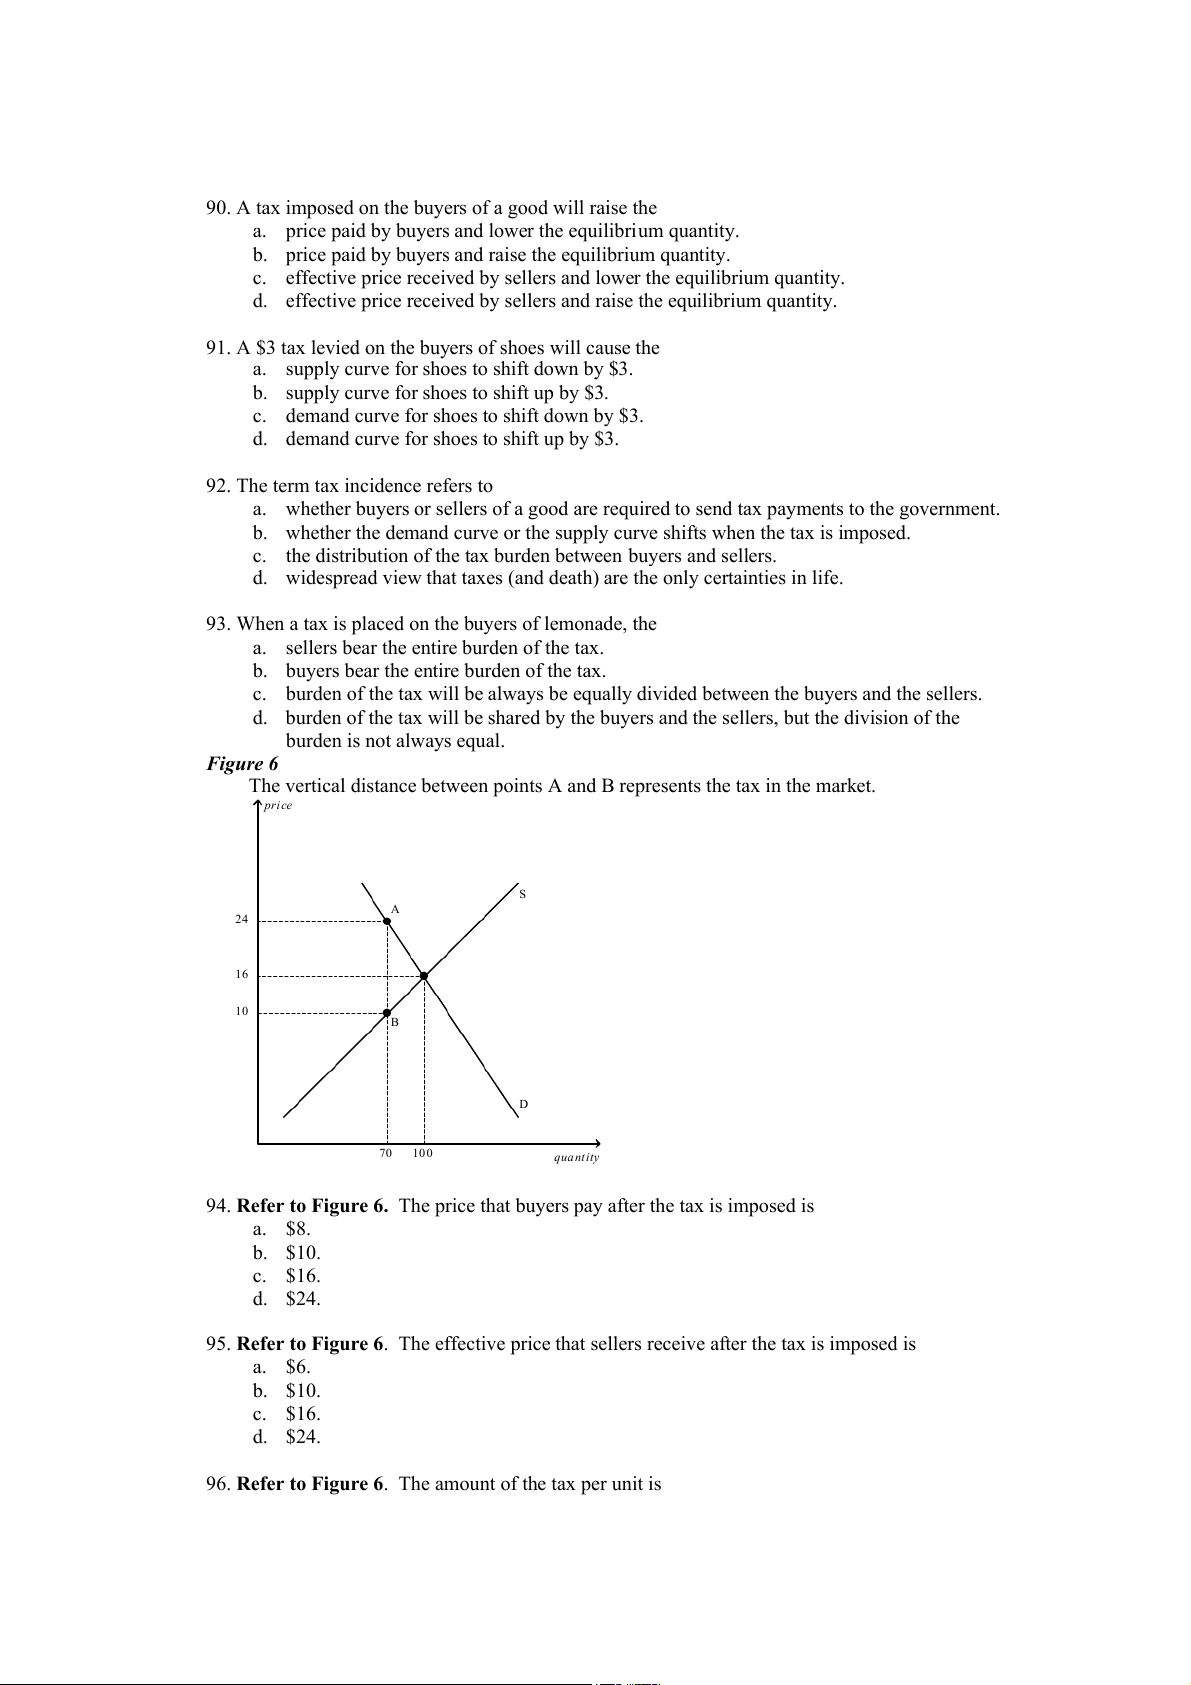
d. burden of the tax will be shared by the buyers and the sellers, but the division of the burden is not always equal. Figure 6
The vertical distance between points A and B represents the tax in the market. pri ce S A 24 16 10 B D 70 10 0 qua nt ity
94. Refer to Figure 6. The price that buyers pay after the tax is imposed is a. $8. b. $10. c. $16. d. $24.
95. Refer to Figure 6. The effective price that sellers receive after the tax is imposed is a. $6. b. $10. c. $16. d. $24.
96. Refer to Figure 6. The amount of the tax per unit is a. $6. b. $8. c. $14. d. $18.
97. Refer to Figure 6. The per-unit burden of the tax on buyers is a. $6. b. $8. c. $14. d. $24.
98. Refer to Figure 6. The per-unit burden of the tax on sellers is a. $6. b. $8. c. $10. d. $14.
99. The incidence of a tax falls more heavily on
a. consumers than producers if demand is more inelastic than supply.
b. producers than consumers if supply is more inelastic than demand.
c. consumers than producers if supply is more elastic than demand.
d. All of the above are correct.
100. Welfare economics is the study of how
a. the allocation of resources affects economic well-being.
b. a price ceiling compares to a price floor.
c. the government helps poor people.
d. a consumer’s optimal choice affects her demand curve. 101. Consumer surplus
a. is the amount a buyer pays for a good minus the amount the buyer is willing to pay for it.
b. is represented on a supply-demand graph by the area below the price and above the demand curve.
c. measures the benefit sellers receive from participating in a market.
d. measures the benefit buyers receive from participating in a market.
102. On a graph, consumer surplus is represented by the area
a. between the demand and supply curves.
b. below the demand curve and above price.
c. below the price and above the supply curve.
d. below the demand curve and to the right of equilibrium price.
103. A drought in California destroys many red grapes. As a result of the drought, the consumer
surplus in the market for red grapes
a. increases, and the consumer surplus in the market for red wine increases.
b. increases, and the consumer surplus in the market for red wine decreases.
c. decreases, and the consumer surplus in the market for red wine increases.
d. decreases, and the consumer surplus in the market for red wine decreases.
104. All else equal, what happens to consumer surplus if the price of a good increases?
a. Consumer surplus increases.
b. Consumer surplus decreases.
c. Consumer surplus is unchanged.
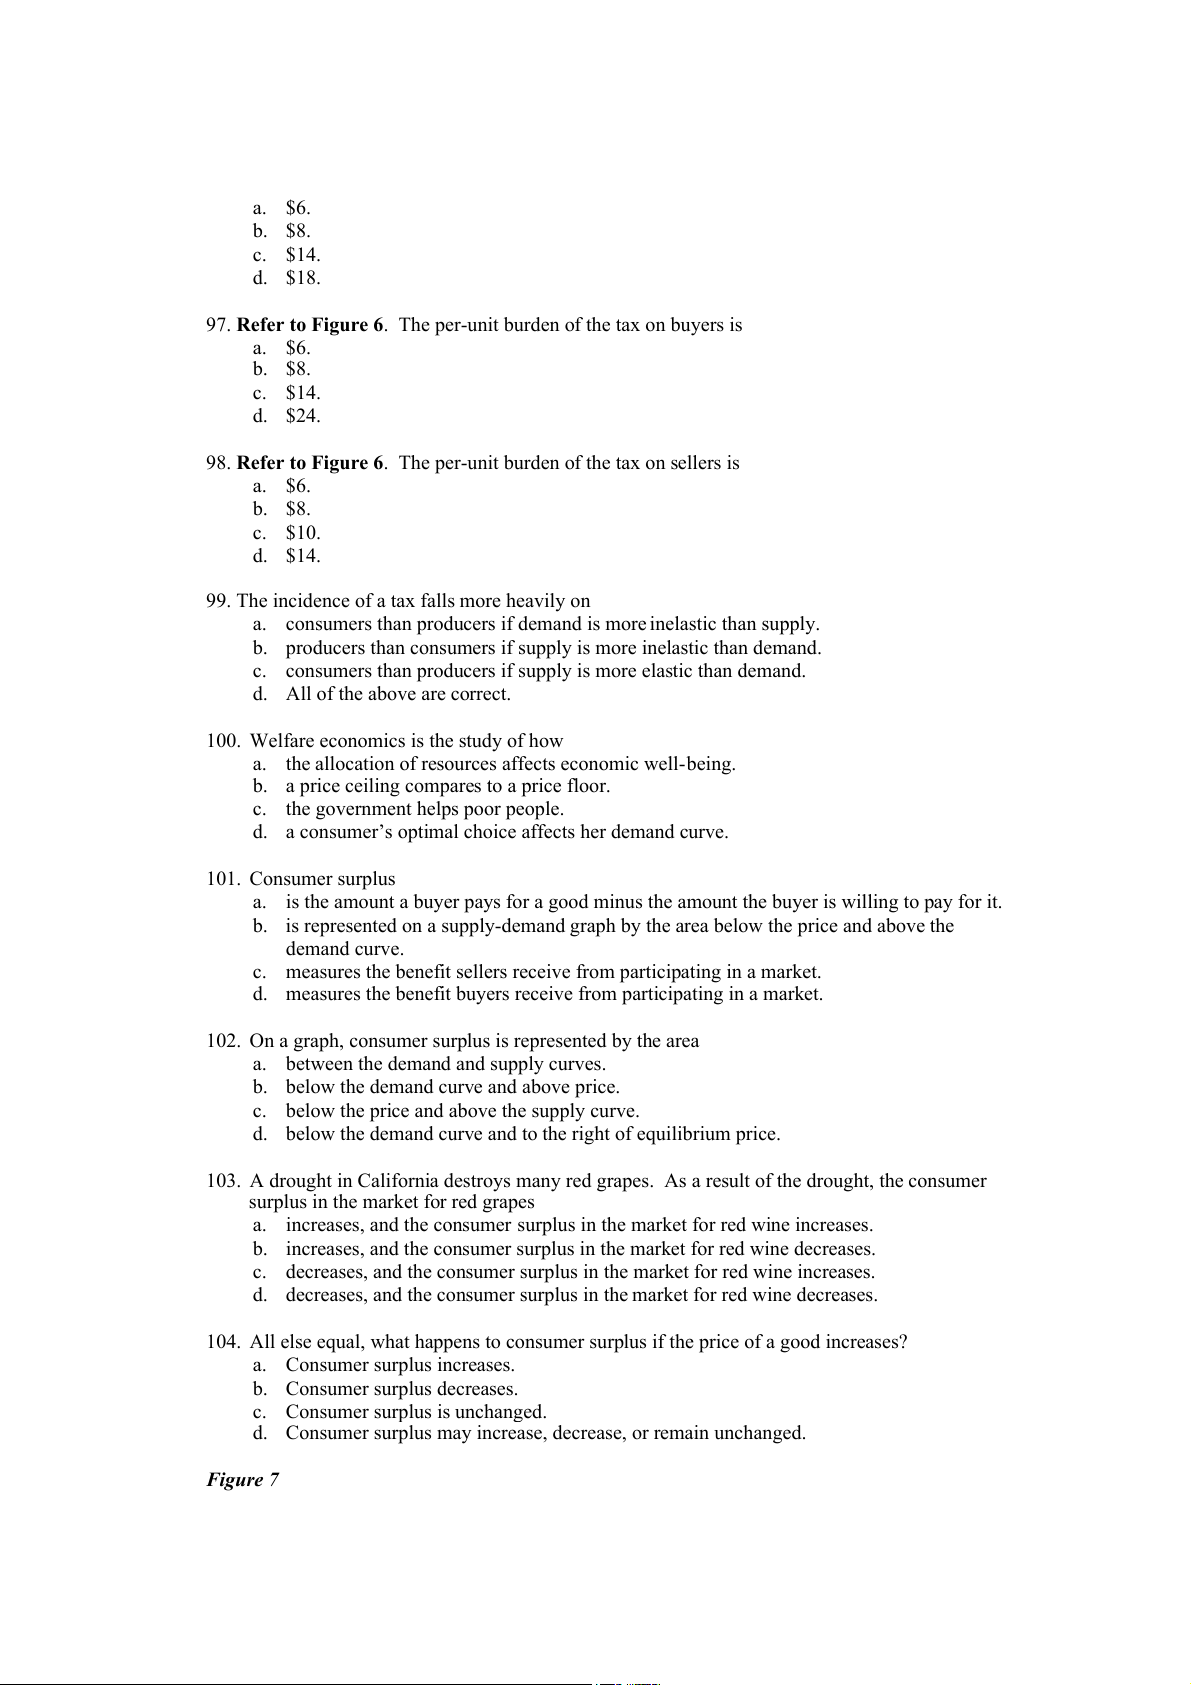
d. Consumer surplus may increase, decrease, or remain unchanged. Figure 7 Pri ce A P 2 B C P 1 D F Demand Q2 Q1 Qua nt it y
105. Refer to Figure 7. When the price is P1, consumer surplus is a. A. b. A+B. c. A+B+C. d. A+B+D.
106. Refer to Figure 7. When the price is P2, consumer surplus is a. A. b. B. c. A+B. d. A+B+C.
107. Refer to Figure 7. When the price rises from P1 to P2, consumer surplus
a. increases by an amount equal to A.
b. decreases by an amount equal to B+C.
c. increases by an amount equal to B+C.
d. decreases by an amount equal to C.
108. Producer surplus measures the
a. benefits to sellers of participating in a market.
b. costs to sellers of participating in a market.
c. price that buyers are willing to pay for sellers’ output of a good or service.
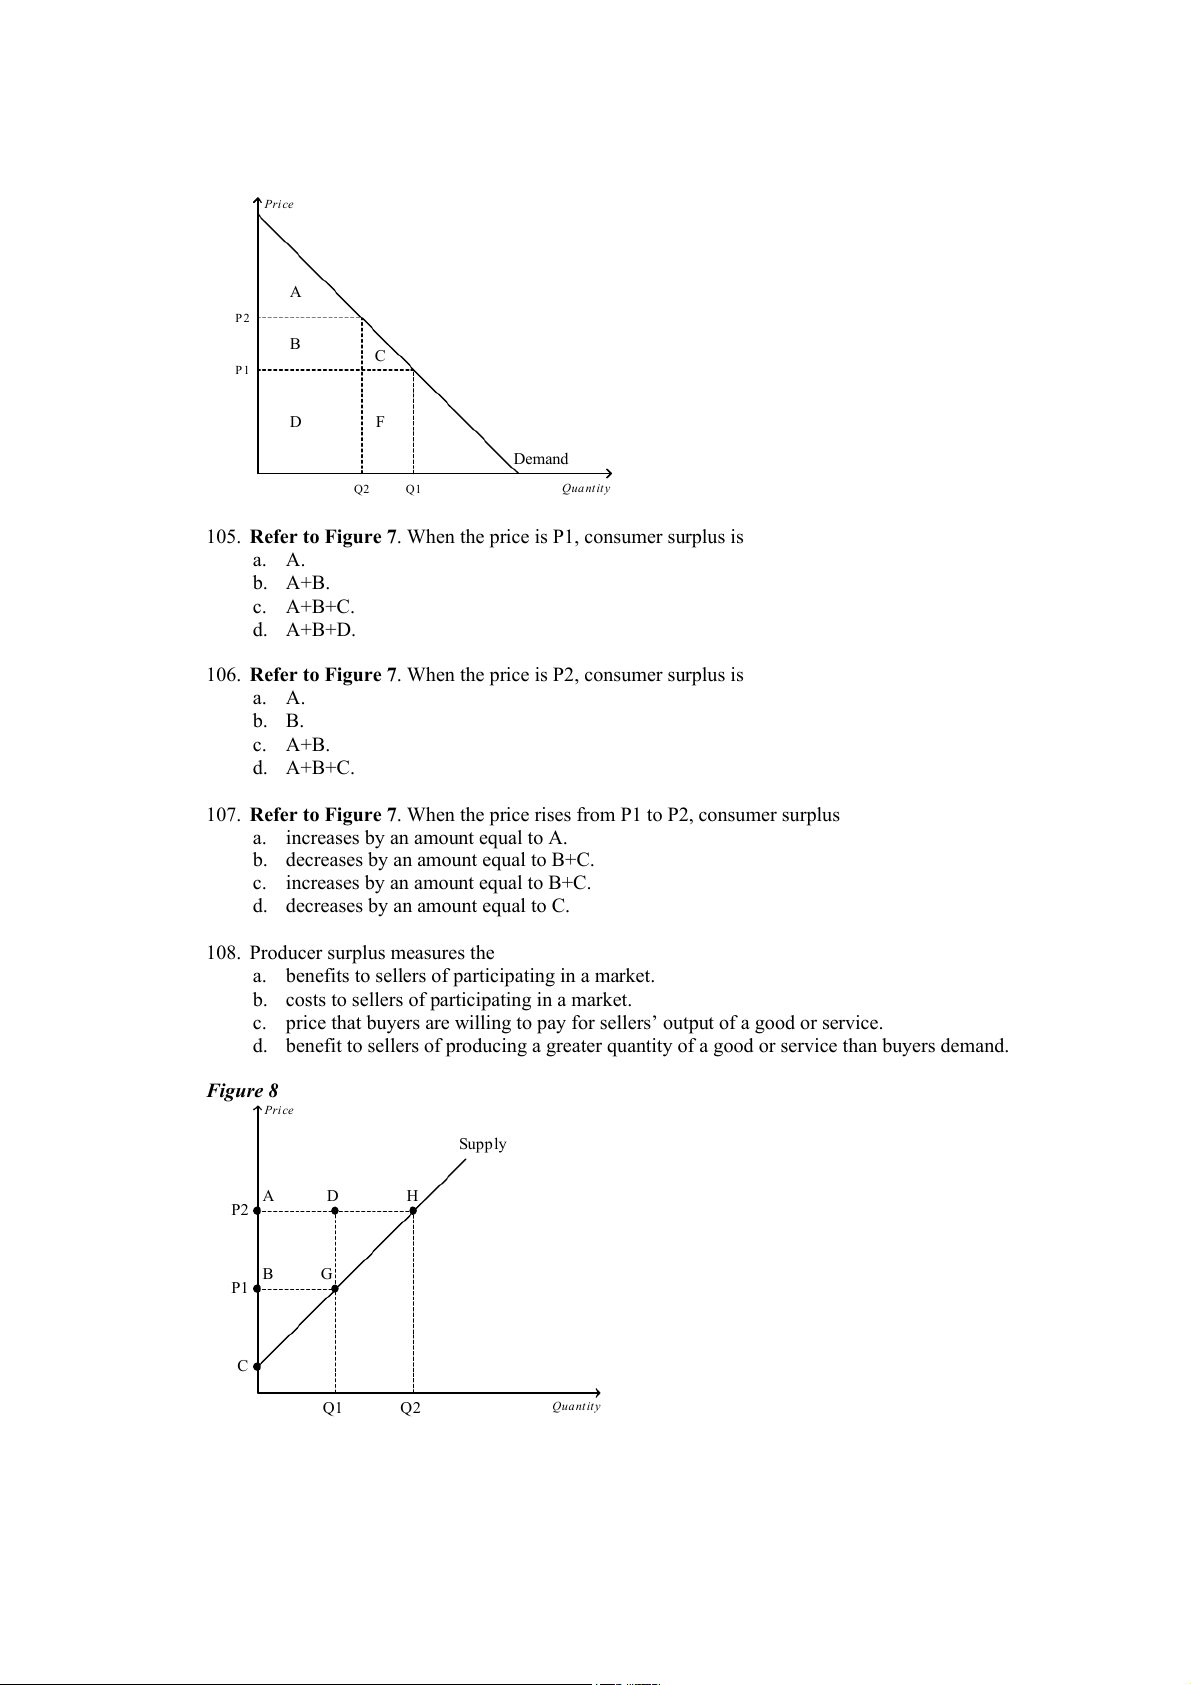
d. benefit to sellers of producing a greater quantity of a good or service than buyers demand. Figure 8 Pri ce Supply A D H P2 B G P1 C Q1 Q2 Qua nt it y
109. Refer to Figure 8. Which area represents producer surplus when the price is P1? a. BCG b. ACH c. ABGD d. DGH
110. Refer to Figure 8. Which area represents producer surplus when the price is P2? a. BCG b. ACH c. ABGD d. AHGB
111. Refer to Figure 8. Which area represents the increase in producer surplus when the price rises from P1 to P2? a. BCG b. ACH c. ABGD d. AHGB
112. If the demand for leather decreases, producer surplus in the leather market a. increases. b. decreases. c. remains the same.
d. may increase, decrease, or remain the same.
113. Total surplus in a market is equal to
a. consumer surplus + producer surplus.
b. value to buyers - amount paid by buyers.
c. amount received by sellers - costs of sellers.
d. producer surplus - consumer surplus.
114. Total surplus is represented by the area
a. under the demand curve and above the price.
b. above the supply curve and up to the price.
c. under the supply curve and up to the price.
d. between the demand and supply curves up to the point of equilibrium.
115. Efficiency in a market is achieved when
a. a social planner intervenes and sets the quantity of output after evaluating buyers'
willingness to pay and sellers' costs.
b. the sum of producer surplus and consumer surplus is maximized.
c. all firms are producing the good at the same low cost per unit.
d. no buyer is willing to pay more than the equilibrium price for any unit of the good.
116. If an allocation of resources is efficient, then
a. consumer surplus is maximized.
b. producer surplus is maximized.
c. all potential gains from trade among buyers are sellers are being realized.
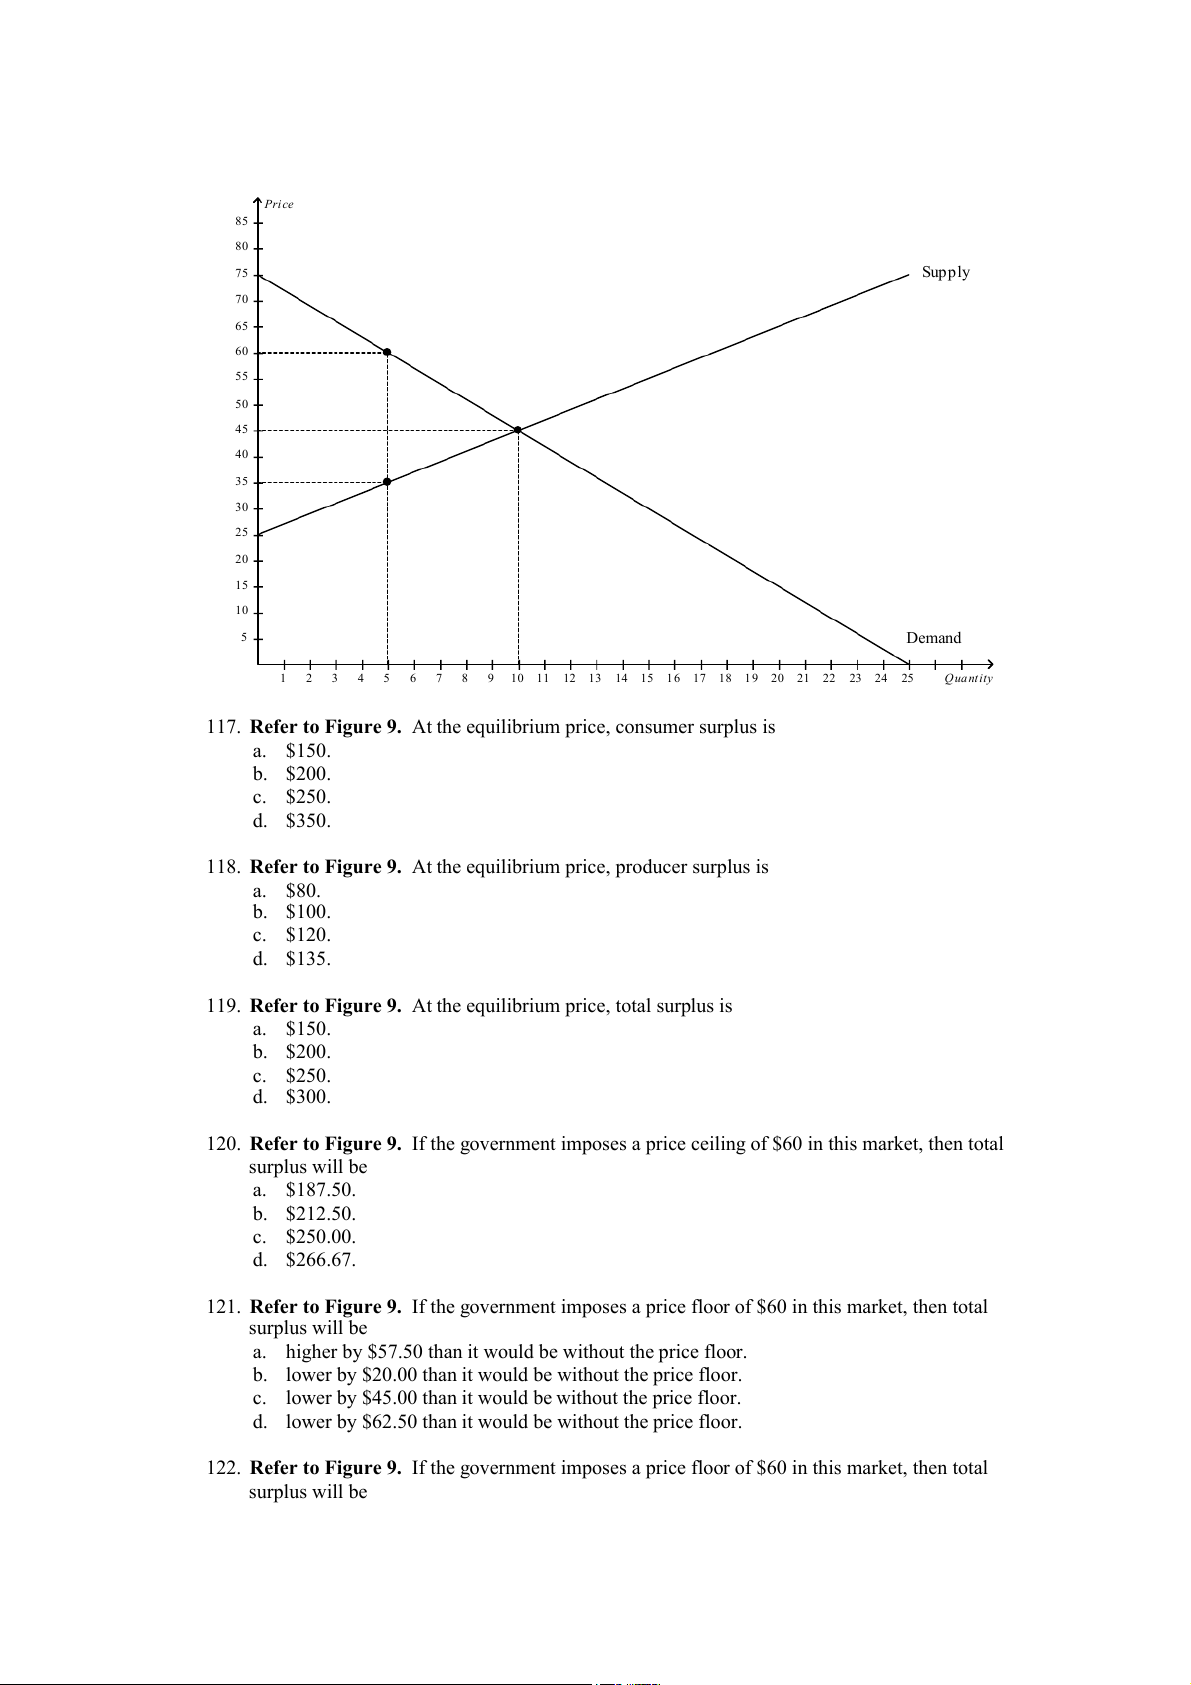
d. the allocation achieves equality as well. Figure 9 Pri ce 85 80 75 Supply 70 65 60 55 50 45 40 35 30 25 20 15 10 5 Demand 1 2 3 4 5 6 7 8 9 10 11 12 13 14 15 1 6 17 18 1 9 20 21 22 23 24 25 Q ua nt ity
117. Refer to Figure 9. At the equilibrium price, consumer surplus is a. $150. b. $200. c. $250. d. $350.
118. Refer to Figure 9. At the equilibrium price, producer surplus is a. $80. b. $100. c. $120. d. $135.
119. Refer to Figure 9. At the equilibrium price, total surplus is a. $150. b. $200. c. $250. d. $300.
120. Refer to Figure 9. If the government imposes a price ceiling of $60 in this market, then total surplus will be a. $187.50. b. $212.50. c. $250.00. d. $266.67.
121. Refer to Figure 9. If the government imposes a price floor of $60 in this market, then total surplus will be
a. higher by $57.50 than it would be without the price floor.
b. lower by $20.00 than it would be without the price floor.
c. lower by $45.00 than it would be without the price floor.
d. lower by $62.50 than it would be without the price floor.
122. Refer to Figure 9. If the government imposes a price floor of $60 in this market, then total surplus will be a. $110.50. b. $125.00. c. $187.50. d. $225.25.
123. The government’s benefit from a tax can be measured by a. consumer surplus. b. producer surplus. c. tax revenue.
d. All of the above are correct.
124. The decrease in total surplus that results from a market distortion, such as a tax, is called a a. wedge loss. b. revenue loss. c. deadweight loss. d. consumer surplus loss.
125. Taxes cause deadweight losses because taxes
a. reduce the sum of producer and consumer surpluses by more than the amount of tax revenue.
b. prevent buyers and sellers from realizing some of the gains from trade.
c. cause marginal buyers and marginal sellers to leave the market, causing the quantity sold to fall.
d. All of the above are correct. Figure 10
In each case, the budget constraint moves from BC-1 to BC-2. y y 8 8 7 (a) 7 (b) 6 6 5 5 4 4 3 3 2 2 1 1 BC-2 BC-1 BC-1 BC-2 1 2 3 4 5 6 7 8 x 1 2 3 4 5 6 7 8 x y y 8 8 7 (c) 7 (d) 6 6 BC-1 BC-2 5 5 4 4 3 3 BC-2 BC-1 2 2 1 1 1 2 3 4 5 6 7 8 x 1 2 3 4 5 6 7 8 x
126. Refer to Figure 10. Which of the graphs in the figure could reflect a simultaneous increase in
the price of good X and decrease in the price of good Y? a. graph a b. graph b c. graph c d. graph d
127. Refer to Figure 10. Which of the graphs in the figure could reflect an increase in income? a. graph a b. graph b c. graph d
d. None of the above is correct.
128. Refer to Figure 10. Which of the graphs in the figure could reflect a decrease in income? a. graph a b. graph b c. graph d
d. None of the above is correct.
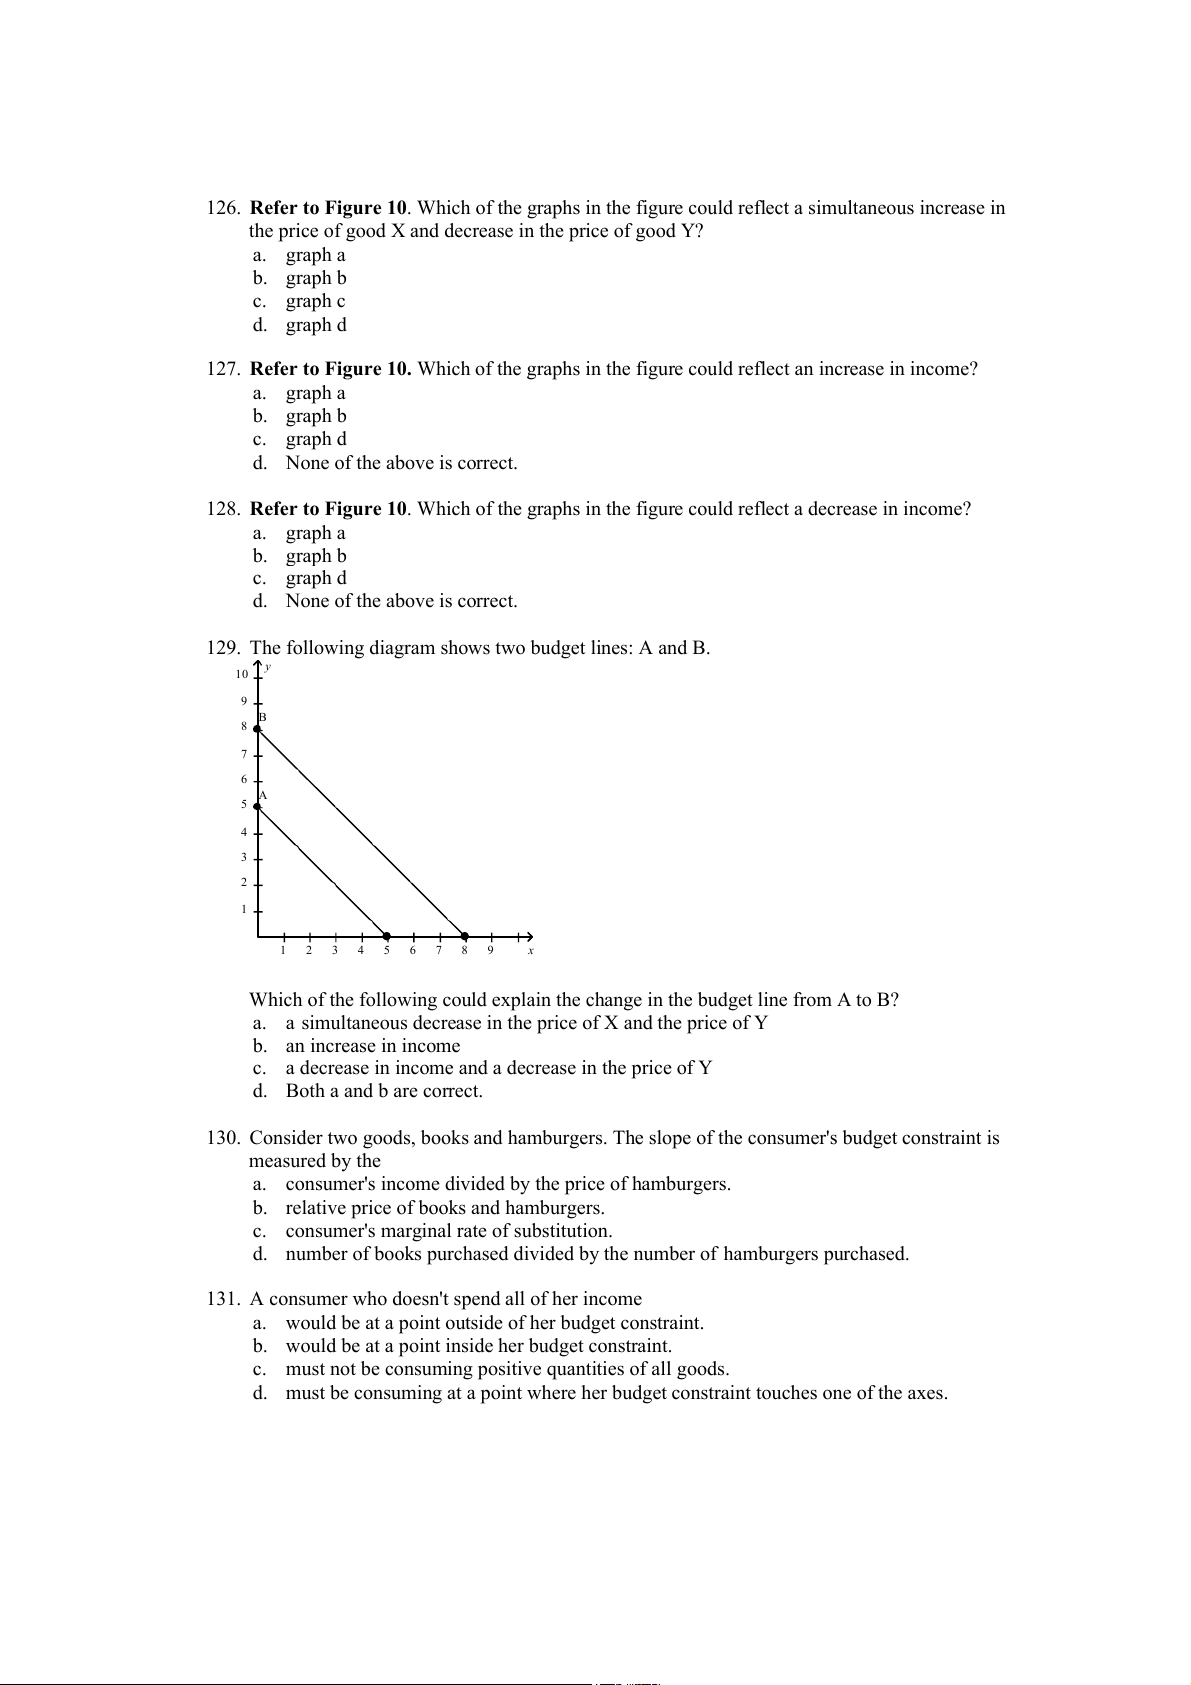
129. The following diagram shows two budget lines: A and B. y 10 9 B 8 7 6 A 5 4 3 2 1 1 2 3 4 5 6 7 8 9 x
Which of the following could explain the change in the budget line from A to B?
a. a simultaneous decrease in the price of X and the price of Y b. an increase in income
c. a decrease in income and a decrease in the price of Y d. Both a and b are correct.
130. Consider two goods, books and hamburgers. The slope of the consumer's budget constraint is measured by the
a. consumer's income divided by the price of hamburgers.
b. relative price of books and hamburgers.
c. consumer's marginal rate of substitution.
d. number of books purchased divided by the number of hamburgers purchased.
131. A consumer who doesn't spend all of her income
a. would be at a point outside of her budget constraint.
b. would be at a point inside her budget constraint.
c. must not be consuming positive quantities of all goods.
d. must be consuming at a point where her budget constraint touches one of the axes.
Tài liệu liên quan:
-

Chương 3: độ co giãn và các nhân tố ảnh hưởng | Microeconomics | Trường Đại học Quốc tế, Đại học Quốc gia Thành phố Hồ Chí Minh
4 2 -

Microeconomics Syllabus | Microeconomics | Trường Đại học Quốc tế, Đại học Quốc gia Thành phố Hồ Chí Minh
4 2 -

Microeconomics Course Syllabus & Assessment Details | Microeconomics | Trường Đại học Quốc tế, Đại học Quốc gia Thành phố Hồ Chí Minh
4 2 -

Assignment 3 - Elasticity MCQs and Key Concepts | Microeconomics | Trường Đại học Quốc tế, Đại học Quốc gia Thành phố Hồ Chí Minh
4 2 -

Assignment 2 - Economic Equilibrium Analysis of Fridges and Motorcycles | Microeconomics | Trường Đại học Quốc tế, Đại học Quốc gia Thành phố Hồ Chí Minh
4 2