Nghiên cứu tác động thị trường trong Bài tập micro | Microeconomics | Trường Đại học Quốc tế, Đại học Quốc gia Thành phố Hồ Chí Minh
Because of the effect of Hurricane Katrina had on New Orleans, about 250,000 residents had to relocate to nearby Baton Rouge. In other words, the demand for housing in Baton Rouge had increased whereas the quantity of houses in that city was limited. This led to the scarcity in the supply of houses, which pushed house prices up (from $130,000 to $156,000). Tài liệu được sưu tầm và soạn thảo dưới dạng file PDF để gửi tới các bạn cùng tham khảo, ôn tập đầy đủ kiến thức, chuẩn bị cho các buổi học thật tốt. Mời bạn đọc đón xem!
Môn: Microeconomics 635 tài liệu
Trường: Trường Đại học Quốc tế, Đại học Quốc gia Thành phố Hồ Chí Minh 1.9 K tài liệu
Tác giả:
Preview text:
Assignment 3
Họ và tên: Đào Thanh Xuân Lớp: E-BDB 4 Case 1: 1.
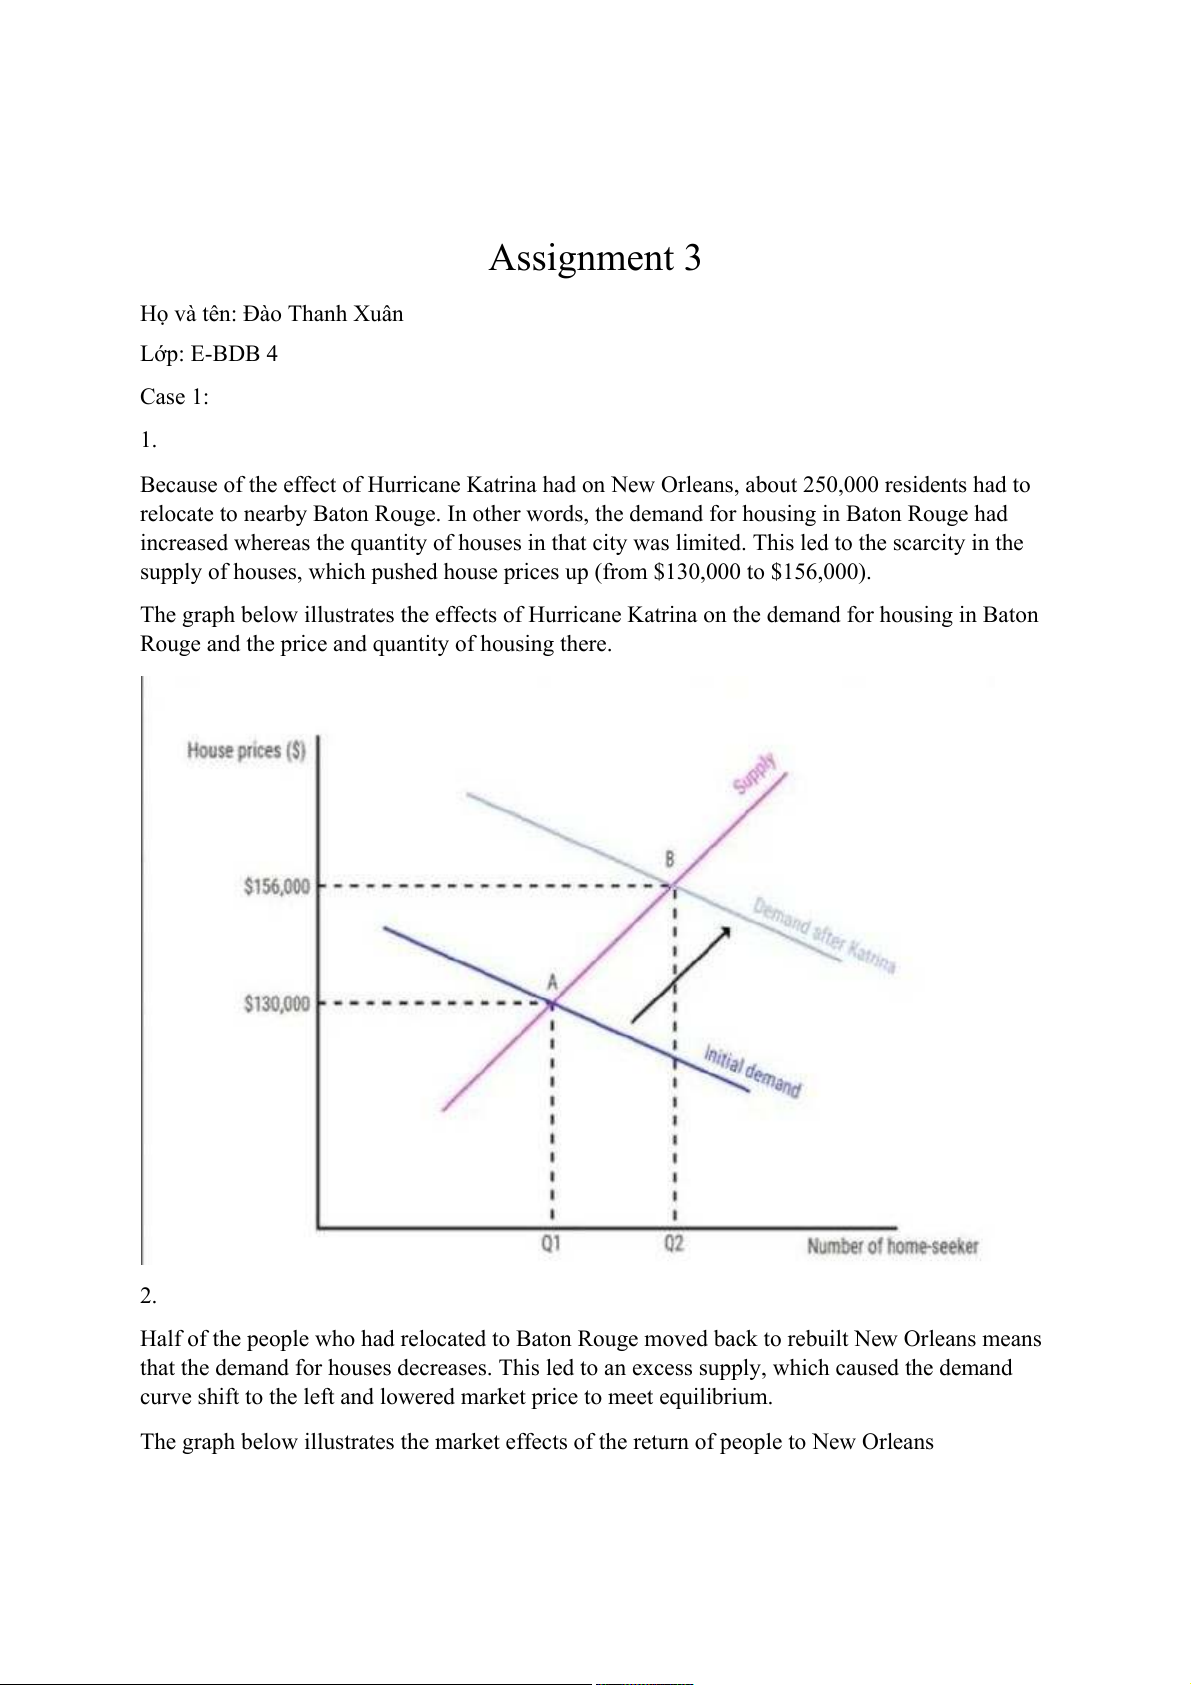
Because of the effect of Hurricane Katrina had on New Orleans, about 250,000 residents had to
relocate to nearby Baton Rouge. In other words, the demand for housing in Baton Rouge had
increased whereas the quantity of houses in that city was limited. This led to the scarcity in the
supply of houses, which pushed house prices up (from $130,000 to $156,000).
The graph below illustrates the effects of Hurricane Katrina on the demand for housing in Baton
Rouge and the price and quantity of housing there. 2.
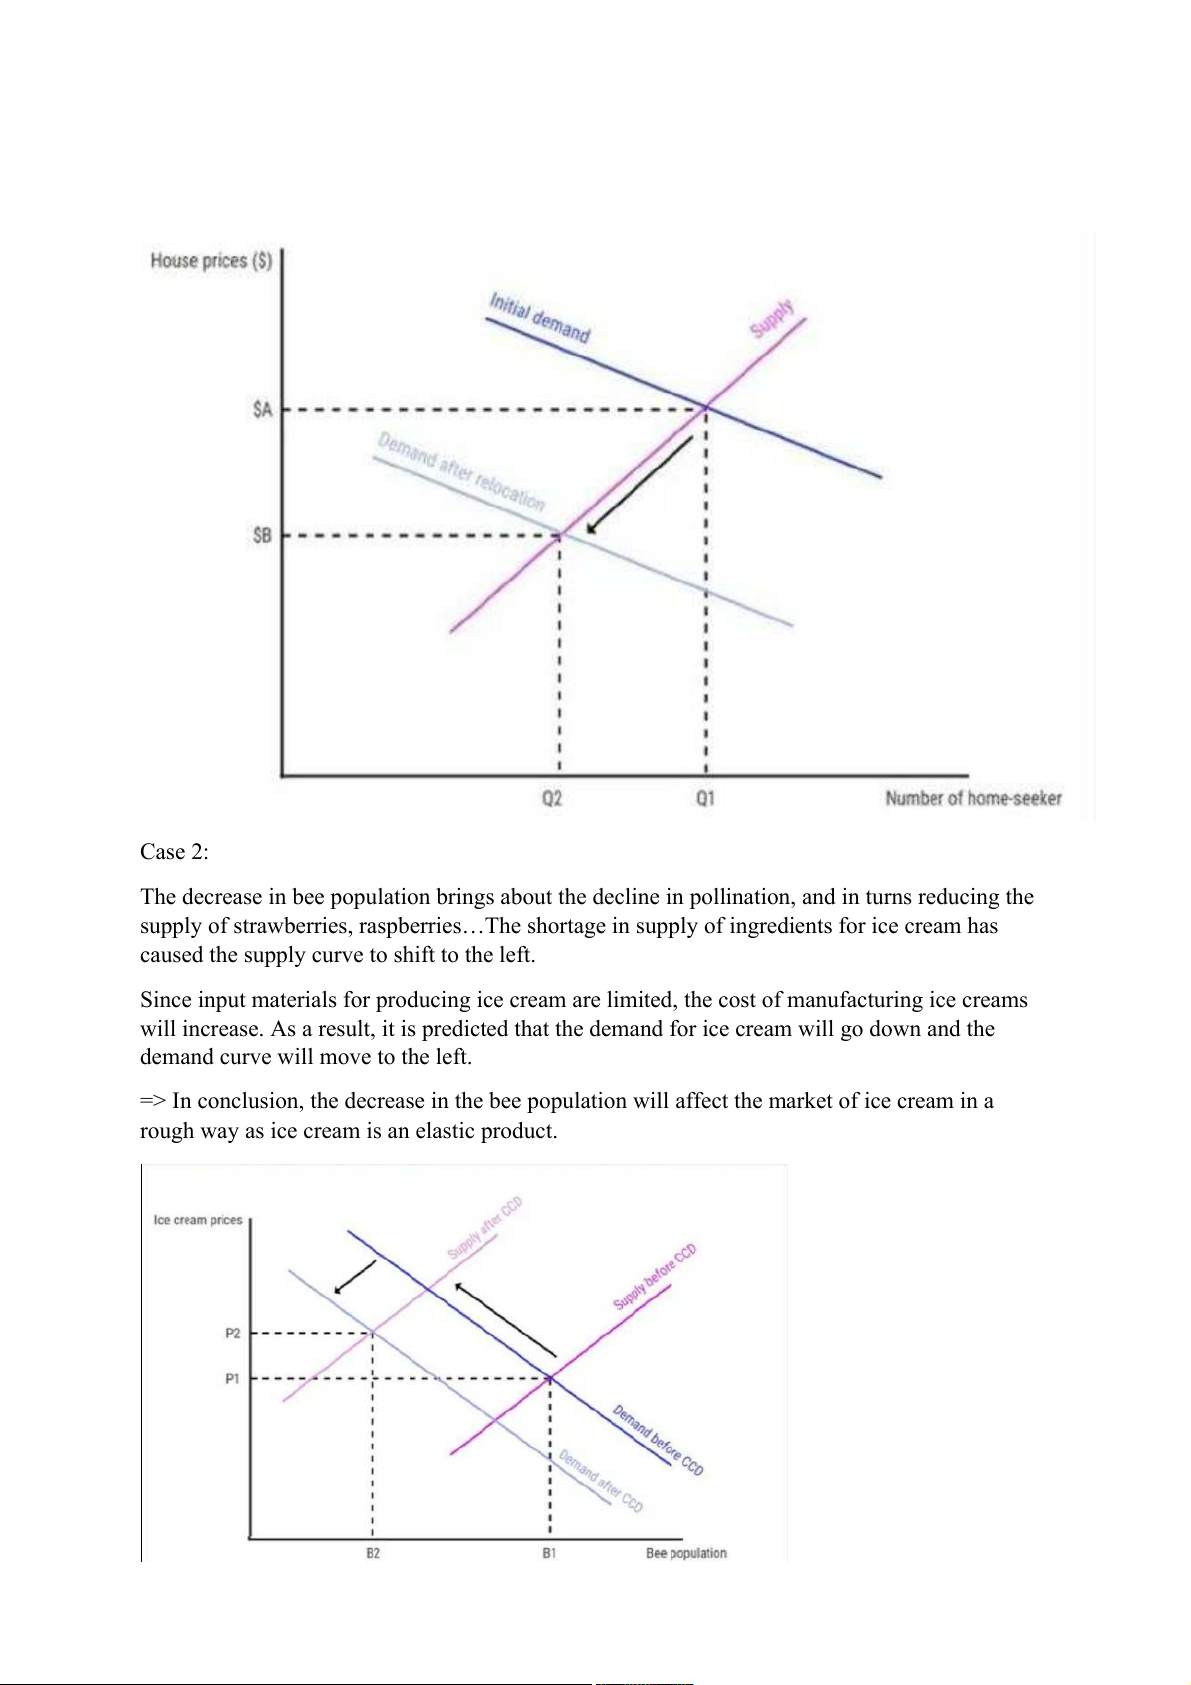
Half of the people who had relocated to Baton Rouge moved back to rebuilt New Orleans means
that the demand for houses decreases. This led to an excess supply, which caused the demand
curve shift to the left and lowered market price to meet equilibrium.
The graph below illustrates the market effects of the return of people to New Orleans Case 2:
The decrease in bee population brings about the decline in pollination, and in turns reducing the
supply of strawberries, raspberries…The shortage in supply of ingredients for ice cream has
caused the supply curve to shift to the left.
Since input materials for producing ice cream are limited, the cost of manufacturing ice creams
will increase. As a result, it is predicted that the demand for ice cream will go down and the
demand curve will move to the left.
=> In conclusion, the decrease in the bee population will affect the market of ice cream in a
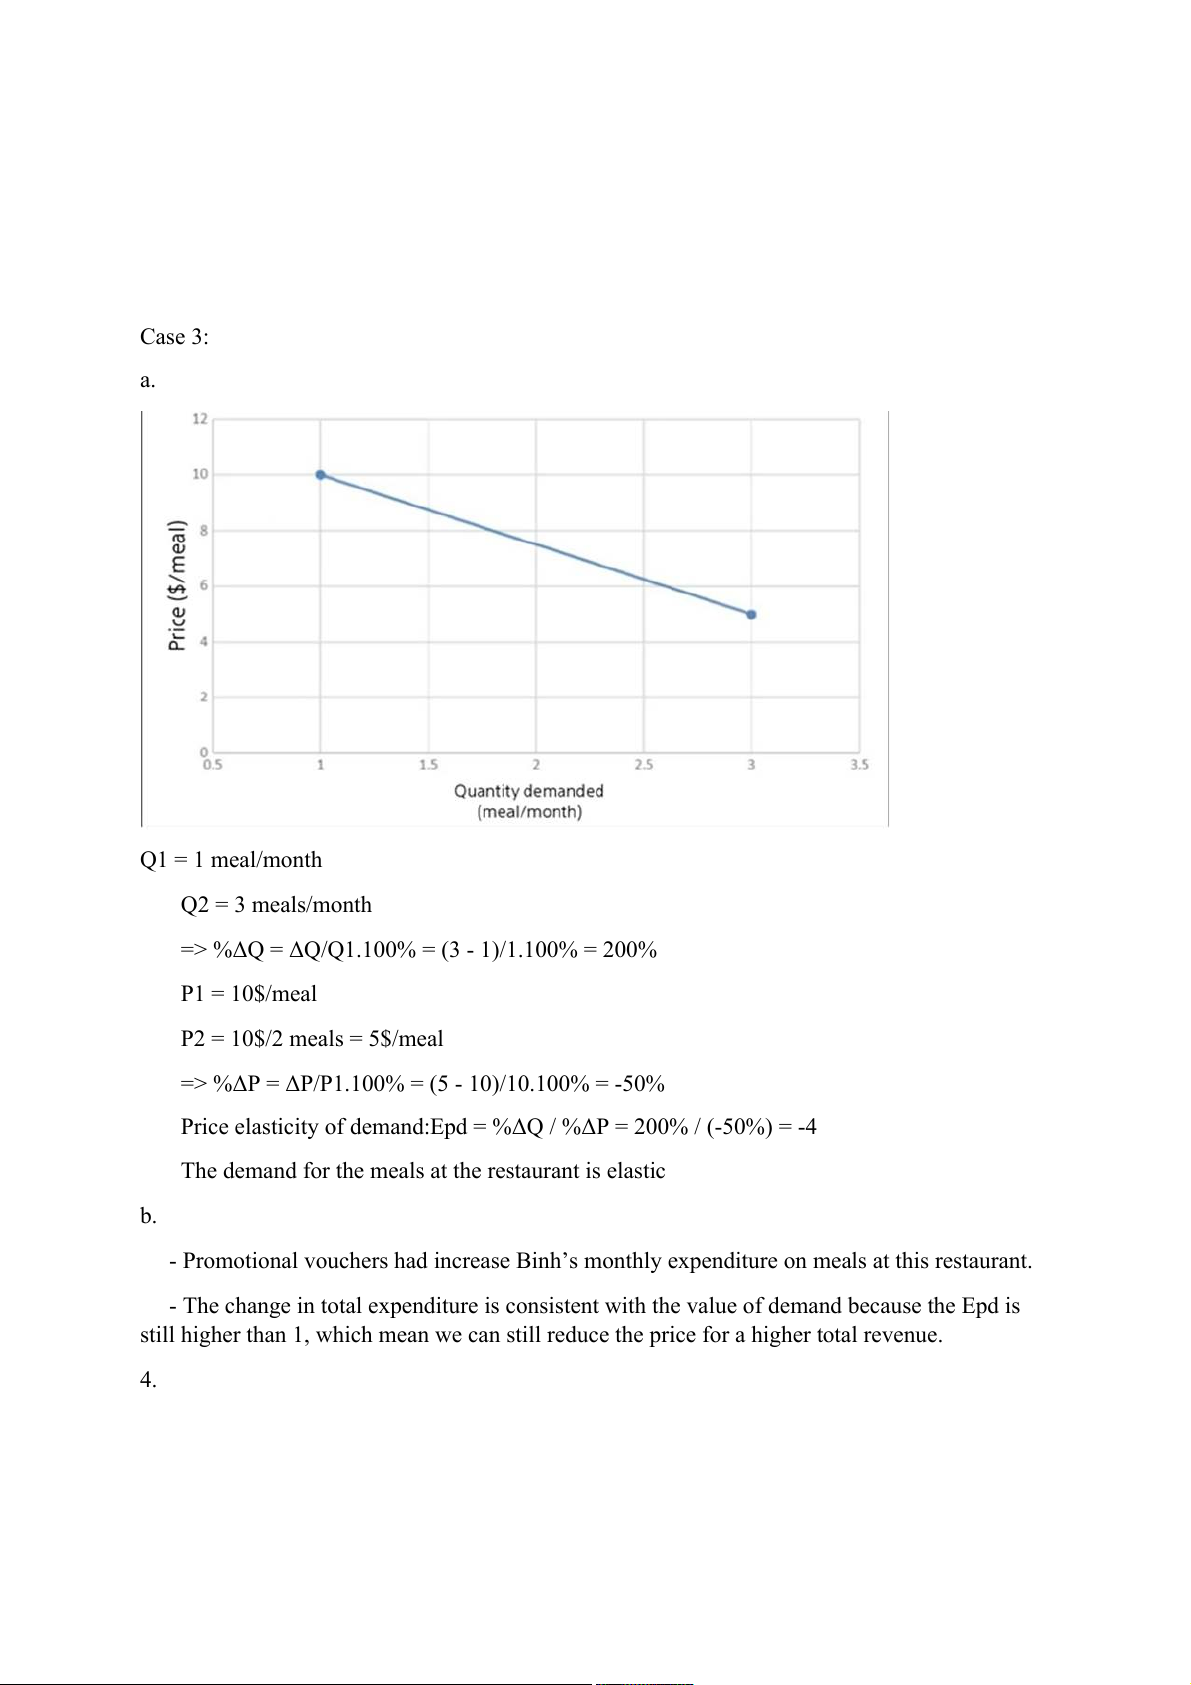
rough way as ice cream is an elastic product. Case 3: a. Q1 = 1 meal/month Q2 = 3 meals/month
=> %ΔQ = ΔQ/Q1.100% = (3 - 1)/1.100% = 200% P1 = 10$/meal P2 = 10$/2 meals = 5$/meal
=> %ΔP = ΔP/P1.100% = (5 - 10)/10.100% = -50%
Price elasticity of demand:Epd = %ΔQ / %ΔP = 200% / (-50%) = -4
The demand for the meals at the restaurant is elastic b.
- Promotional vouchers had increase Binh’s monthly expenditure on meals at this restaurant.
- The change in total expenditure is consistent with the value of demand because the Epd is
still higher than 1, which mean we can still reduce the price for a higher total revenue. 4.
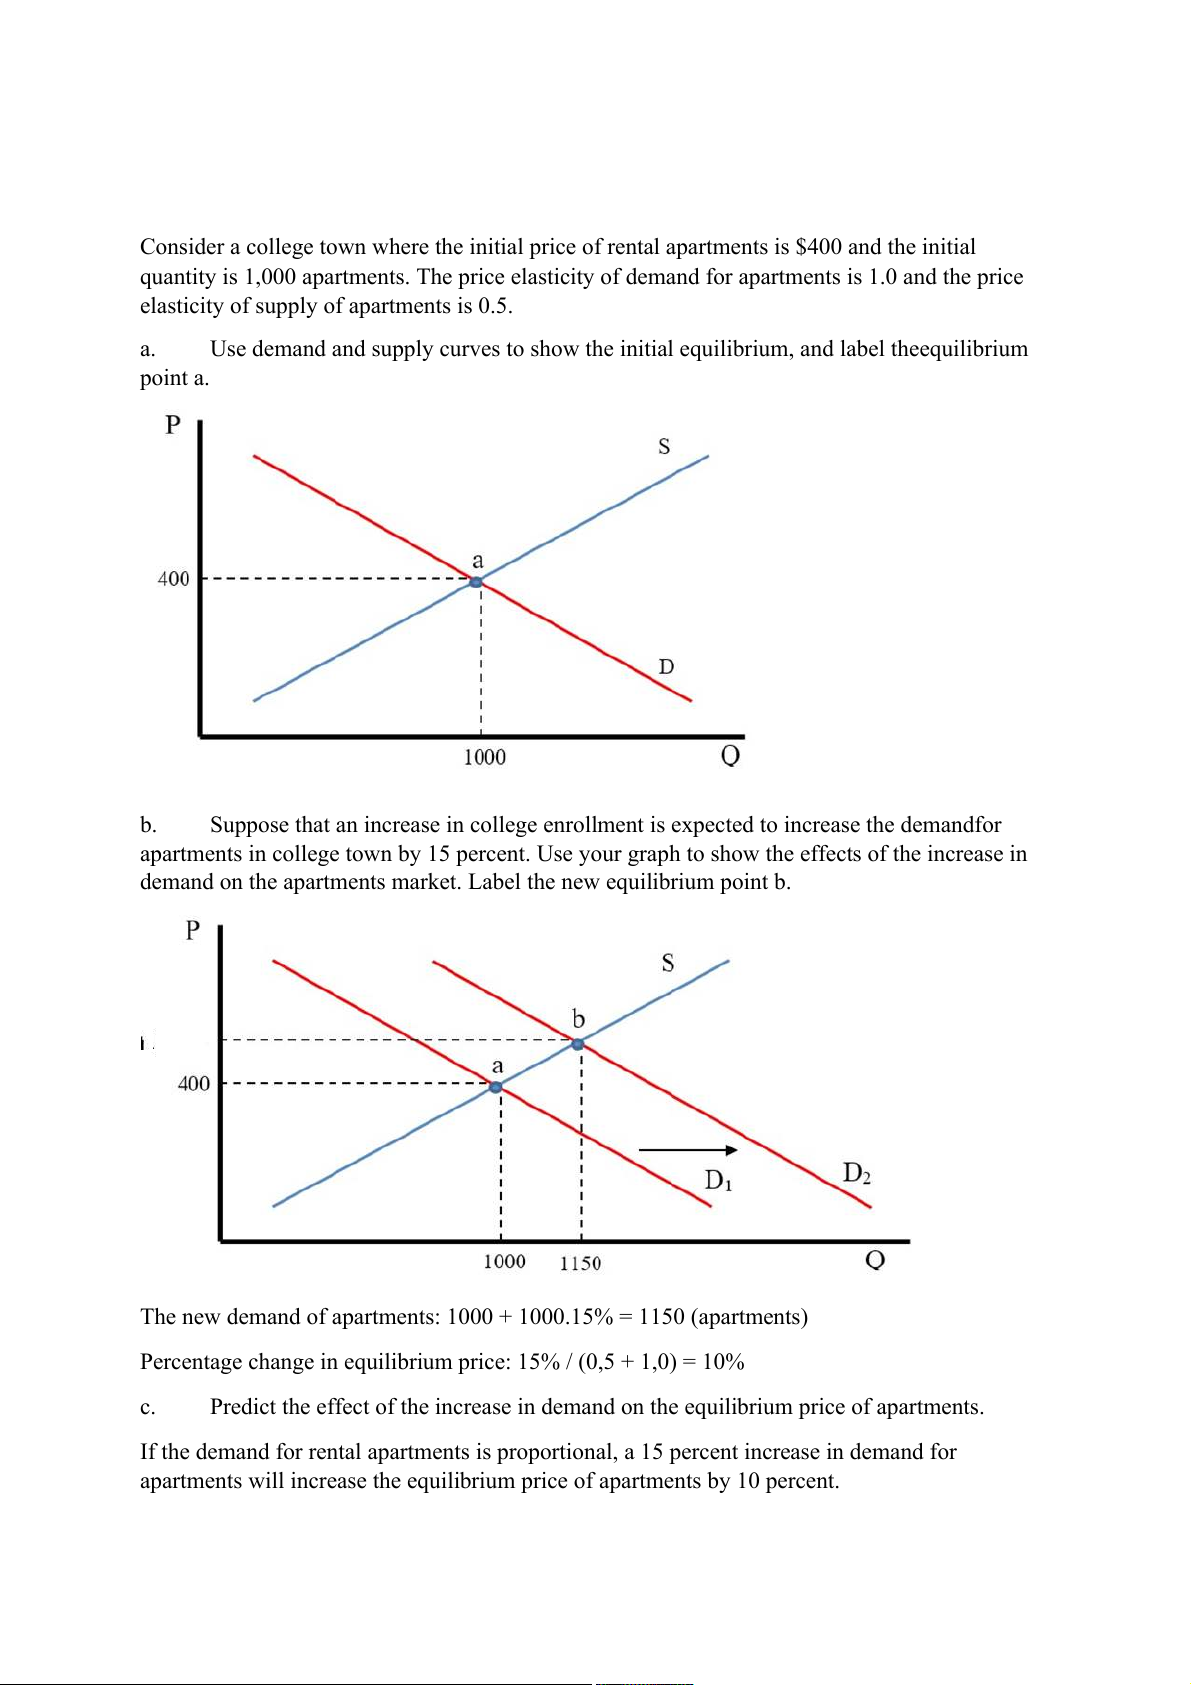
Consider a college town where the initial price of rental apartments is $400 and the initial
quantity is 1,000 apartments. The price elasticity of demand for apartments is 1.0 and the price
elasticity of supply of apartments is 0.5. a.
Use demand and supply curves to show the initial equilibrium, and label theequilibrium point a. b.
Suppose that an increase in college enrollment is expected to increase the demandfor
apartments in college town by 15 percent. Use your graph to show the effects of the increase in
demand on the apartments market. Label the new equilibrium point b.
The new demand of apartments: 1000 + 1000.15% = 1150 (apartments)
Percentage change in equilibrium price: 15% / (0,5 + 1,0) = 10% c.
Predict the effect of the increase in demand on the equilibrium price of apartments.
If the demand for rental apartments is proportional, a 15 percent increase in demand for
apartments will increase the equilibrium price of apartments by 10 percent. 5.
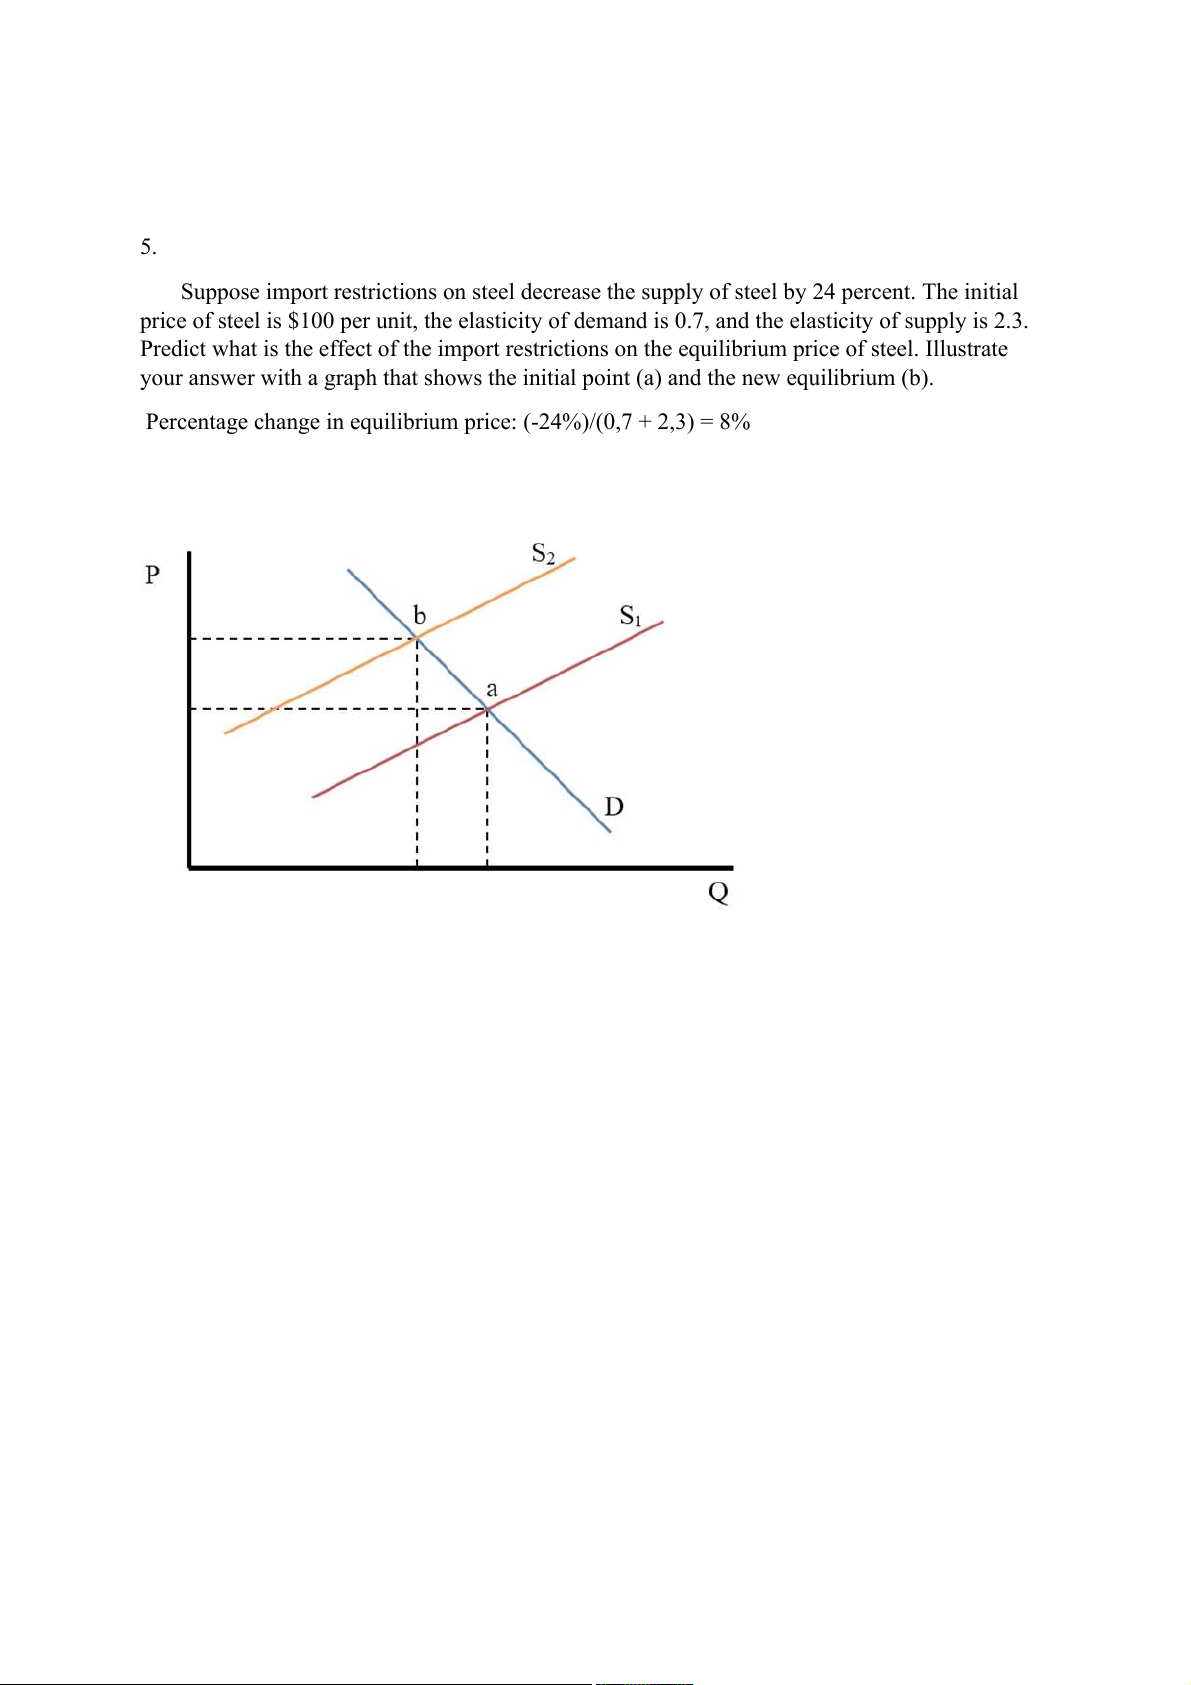
Suppose import restrictions on steel decrease the supply of steel by 24 percent. The initial
price of steel is $100 per unit, the elasticity of demand is 0.7, and the elasticity of supply is 2.3.
Predict what is the effect of the import restrictions on the equilibrium price of steel. Illustrate
your answer with a graph that shows the initial point (a) and the new equilibrium (b).
Percentage change in equilibrium price: (-24%)/(0,7 + 2,3) = 8%
Tài liệu liên quan:
-

Chương 3: độ co giãn và các nhân tố ảnh hưởng | Microeconomics | Trường Đại học Quốc tế, Đại học Quốc gia Thành phố Hồ Chí Minh
3 2 -

Microeconomics Syllabus | Microeconomics | Trường Đại học Quốc tế, Đại học Quốc gia Thành phố Hồ Chí Minh
3 2 -

Microeconomics Course Syllabus & Assessment Details | Microeconomics | Trường Đại học Quốc tế, Đại học Quốc gia Thành phố Hồ Chí Minh
3 2 -

Assignment 3 - Elasticity MCQs and Key Concepts | Microeconomics | Trường Đại học Quốc tế, Đại học Quốc gia Thành phố Hồ Chí Minh
3 2 -

Assignment 2 - Economic Equilibrium Analysis of Fridges and Motorcycles | Microeconomics | Trường Đại học Quốc tế, Đại học Quốc gia Thành phố Hồ Chí Minh
3 2