Oligopoly Analysis of Coca-Cola | Microeconomics | Trường Đại học Quốc tế, Đại học Quốc gia Thành phố Hồ Chí Minh
Soft drinks are defined as water-based flavored drinks usually with added carbon dioxide and with nutritive, nonnutritive, and/or intense sweeteners with other permitted food additives. They first appeared in 1884. It was believed that a drugstore owner in Lisbon Falls, America, produced the product under the brand name Moxie. Soon after, comparable products like Pepsi-Cola and Coco- Cola debuted. Soft drinks have advanced sign. Tài liệu được sưu tầm và soạn thảo dưới dạng file PDF để gửi tới các bạn cùng tham khảo, ôn tập đầy đủ kiến thức, chuẩn bị cho các buổi học thật tốt. Mời bạn đọc đón xem!
Môn: Microeconomics 635 tài liệu
Trường: Trường Đại học Quốc tế, Đại học Quốc gia Thành phố Hồ Chí Minh 1.9 K tài liệu
Tác giả:


Preview text:
National Economics University …...0O0…...
MICROECONOMICS ASSIGNMENT FINAL GROUP PROJECT COCA-COLA Class: EBBA 14.1 TEAM 3 Phan Thi Mai Anh Nguyen Khanh Linh Tran Huyen Nga Ho Thu Nga Nguyen Ha Phuong Ha Noi - 12/2022 INDEX
INTRODUCTION..............................................................................................3
CONTENT...........................................................................................................4
I. The soft drink indusstry is oligopoly..........................................................4
1. A few large firms dominate the market.....................................................4
2. Firms are interdependent/interrelation.......................................................4
3. Products differentiation.............................................................................5
4. Substantial barriers to entry.......................................................................6
5. Imperfect information................................................................................7
II. Factor that affect demand and suppy over last year................................7
1. Demand......................................................................................................7
1.1. Price....................................................................................................7
1.2. Prices of related goods (complementary/ subtitutes)..........................8
1.3. Hobby, tastes, and preferences...........................................................9
1.4. New slogan.......................................................................................10
1.5. Marketing strategy............................................................................10
1.6. New products....................................................................................11
1.7. The recovery after Covid 19.............................................................11
2. Supply......................................................................................................11
2.1. Technology.......................................................................................11
2.2. Costs of production (Input prices)....................................................12
2.3. Government policies.........................................................................12
2.4. Number of producers........................................................................13
CONCLUSION.................................................................................................14
REFERENCES.................................................................................................15 1 INTRODUCTION
Soft drinks are defined as water-based flavored drinks usually with added
carbon dioxide and with nutritive, nonnutritive, and/or intense sweeteners with
other permitted food additives. They first appeared in 1884. It was believed that
a drugstore owner in Lisbon Falls, America, produced the product under the
brand name Moxie. Soon after, comparable products like Pepsi-Cola and Coco-
Cola debuted. Soft drinks have advanced significantly over the previous
century, going from being a product available only at neighborhood pharmacies
to a $60 billion industry that produces 10 billion ounces annually. This
development is the result of breakthroughs in marketing and manufacturing
technology. In this post-industrial period, soft drinks are one of the important
beverage goods, and in recent decades their sales have been rapidly increasing.
The market for soft drinks is growing day by day due to the focus on health and wellbeing.
The global soft drinks market size was valued at USD 416.19 Billion in
2021 and is expected to expand at a CAGR of 5.2% from 2022 to 2028. Rising
disposal incomes, changing lifestyle, and a growing population is expected to
promote market growth over the next few years. The growing demand for clean-
label, gluten-free, low-calorie, and low-carb products drives the global soft
drinks market. Additionally, rising popularity among the millennials and
increasing investments in R&D in the food and beverage sector are expected to drive the industry demand [2].
Coca-Cola is the most famous and best-selling soft drink in history.
Coca-Cola, or Coke, is a carbonated soft drink manufactured by the Coca-Cola
Company. It was created by John Stith Pemberton in Atlanta, Georgia, in the
late 19th century with the intention of being a patent medicine. In 1888,
Pemberton sold Coca-Cola's ownership rights to Asa Griggs Candler. Coca-
Cola was registered as a trademark in 1893 and began selling in every state of
United States by 1895. in 1906, the business started to spread internationally.
Through Candler's innovative marketing strategies, Coca-Cola went on to
dominate the world market for soft drinks in the 20th and 21st centuries. On the
50th anniversary of Coke, it became the national symbol of America. In 2020,
Coca-Cola ranked as the sixth most valuable brand in the world according to
Interbrand's "best global brand" research. Coca-Cola ranked No. 87 in the 2018
Fortune 500 list of the largest United States corporations by total revenue. 2 CONTENT
I. The soft drink indusstry is oligopoly
1. A few large firms dominate the market
The soda market is a large sector of the economy. There are many
carbonated beverages available in real life, which means that there is
competition. However, in the practice, Pepsi Co. and Coca-Cola Co. domained
the carbonated beverage market for decades. Coca-Cola Company is one of the
most influential beverages and soft drinks corporations with global influence
and the largest market share. So, the soft drink industry becomes oligopoly.
Therefore, a smaller company like F&N in the beverage business has a small
share of sales and cannot be compared to the sales of Coca-Cola and Pepsi.
Due to the factor of economies of scale, the market can be categorized
into six main groups. These are Coca-Cola, PepsiCo, Dr. Pepper, National
Beverage, Cheerwine and others. The respective market shares for 2021 are
46.3%, 25.6%, 21.7%, 0.5%, 0.2%, and 5.6% (M. Ridder 2022). It can be seen
that Coca-Cola takes up almost half of the market share and its main
competitor’s share twice as little.
The carbonated beverage business is an oligopoly market rather than a
monopolistic competition market due to the number of firms in the market, the
tendency for firms to enter the market, and the branding and advertisement effort.
2. Firms are interdependent/interrelation
Definition: Firms always consider rival’s response when they make decisions. 3
The firms in the soft drink industry are mutually interdependent and each
firm is affected by the actions of the competitors. The sales of Coca Cola
Company may end up being affected in case Pepsi changes its product
specification or even the price of the product. The competitors often act by
changing their advertising, specification, and price.
In 2003 Coke-Cola introduced it`s affordable pricing strategy, sharply
lowered its prices to 0.06$. A change in price can result in a significantly larger
change in quantity demanded. An increase in demand can help Coke achieve
large-scale production and consequently reduce average total costs in the long
run due to benefits of economies of scale. Consumers would prefer Coca-Cola
rather than Pepsi because it’s cheaper than Pepsi in this segment. Pepsi - the
main rival of Coca-Cola was obliged to reduce its price to a minimum of 0.097$
to maintain its market share. The longer Pepsi allows Coke to retain a price
advantage over it, the more customers it would lose in the long run. However,
these two businesses found it difficult to run operation at such low prices,
therefore they both abandoned their reduced pricing strategy.
3. Products differentiation
Definition: Product differentiation is the characteristic or characteristics
that make your product or service stand out to your target audience. It’s how
you distinguish what you sell from what your competitors do, and it increases
brand loyalty, sales, and growth.
Coca-Cola Company is in an oligopoly type of market structure because
the firms in this industry produce products that are differentiated. The
competition depends on the way the brand of the firm markets its products
because they have similar taste. How then does Coca-Cola differentiate itself from the Pepsi drinks?
- Coca-Cola Company uses diverse competitive strategies to sustain their
leading position in the industry of soft drink. It is vital for the company to
sustain a brand image that mainly looks more diverse than Pepsi.
- Coke has a raisin-vanilla flavor and high salt nutritional value. The
corporation has been able to distinguish its offers to the various customer
segments through its several brands, such as Lemon Coke, Diet Coca-Cola, Cherry, and Vanilla Coke.
- The special of Coke that makes strong impression is different packaging
used for its different brands. Coca-Cola sets itself apart from Pepsi through its
packaging: the classic Coke with the red color, Diet Coke is black. Coca-Cola
frequently releases new looks for its products of each line.
- In addition to the packaging, Coca-Cola ensures that consumers can get
these different brands in different quantities. The plastic bottles come in sizes of 4
0.5, 1, 1.5, and 2 liters, the cans in 0.25 or 0.33 liters, and the glass bottles in
0.25, 0.5, and 1 liter. It guarantees the recyclable and environmentally friendly
nature of the packing materials. In 2021, Coca-Cola reveiled PlantBottle - the
world’s first fully recyclable PET plastic bottle made from 30% plant-based
material. In this way, Coca-Cola has differentiated its drinks from that of Pepsi
to make sure it better meets the needs of its consumers.
- Most of Coca-Cola’s adverts are keen on emphasizing family,
friendship, happiness. The global brand platform of Coca-Cola is “Real Magic”
which invites everyone to celebrate the real magic of humanity and coveys the
message: Magic exists in unexpected moments of connection that transform the ordinary into the exceptional.
- The two competitors produce products that are almost similar, yet their
practices of marketing have largely managed to generate a high brand loyalty
level for every product. Coca Cola maintains its discrepancy from other soft
drinks by spending more than 20% of its advertisement budget to only differentiate its products.
4. Substantial barriers to entry
It is difficult to enter an oligopoly industry and compete as a small start-
up company. Oligopoly firms are large and benefit from economies of scale. It
takes considerable know-how and capital to compete in this industry
Coca-Cola Company operates in an oligopoly market structure. Its only
real competitor is PepsiCo. Together Coca-Cola and Pepsi’s dominate the
industry and their size in the market create barriers that deter new companies
from trying to compete on the international level. High barriers to entry prevent
smaller firms from making a large impact. This allows the two firms to compete
on areas other than price in an attempt to maximize profit.
Producing soft drinks for a wide market would require a significant
investment in production equipment, brand material, and advertising. The high
cost and captital of operating in this industry prevent many companies from
entering the competitive arena. According to O’Sullivan et al (2008), the
government has intervention in this market, making sure there is no bunch of
firms operating in the oligopoly industry by issuing controllers such as patent and business licenses.
There aren’t many barriers to entry in the soft drink industry, it can be
easy for any firm to begin their company and sell soft drinks to their customers.
However, mostly it can be very hard to be noticeable since there are already
numerous diverse products and brands of soft drinks out there for consumers to
select from. According to Doyle (1990), the per capita beverage rate of
consumption is the highest for Coca-Cola Company consolidated in the world.
Additionally, Coca-Cola Company has the highest number of consumers in the
world and has created a high barrier to entry in soft drink market through its 5
increasing advertising. To be precise, building a brand is the biggest barrier to
entry in the soft drink industry.
Economies of scale is a important element that should be took into account:
- Focusing on economies of scale, which basically refers to the manner an
organization can focus on the reduction of the average per unit cost of its
services or goods by basically increasing the production scale for a single type
of product. For Coca-Cola, economics of scale are mostly at work when the
corporation lowers the manufacturing or production cost by increasing its level of output.
- Coca-Cola is considered a billion-dollar brand in 19 countries. It also
owns 16 other billion-dollar brands and 20 more sparkling and still brands,
which each produce around $500 million-$1 billion in revenue annually. The
company has the leadership position in the American soda industry, with a
46.3% market share. PepsiCo ranks second, accounting for 25.6% of the soda market.
- Furthermore, Coca-Cola has a strong global distribution system in 200
countries, possessing more vehicles than both UPS and FedEx combined. Thus,
Coca-Cola has a huge moat with great economies of scale that no competitors
could easily copy or beat. That provides an extremely strong foundation for the business future growth.
5. Imperfect information
Definition: Imperfect information occurs when the economic agents lack
information about a good or any other information relevant to the transaction. In
this case, for example, the consumers may have partial information about the
product quality, which would make it difficult to make a rational choice upon purchase.
Until 2019, Coca-Cola did not mention its sugar content publicly.
Because the consumers were unaware of the high sugar content and the possible
risks associated with the product, they consumed it disproportionately. This
over-consumption has made the public overweight, which puts a significant
strain on the healthcare system and the Government brought in the Sugar
Sweetened Drinks Tax (SSDT) in 2018 6
II. Factor that affect demand and suppy over last year 1. Demand 1.1. Price
The price of Coca-Cola in USA is 0.76$ (while in VietNam is 0.38$). The
average price for 92 countries is 0.94$. Recently, Coca-Cola has raised its price
by 12% mainly due to food inflation. Despite the increase in price of Coke and
global recession, the demand for Coca-Cola doesn’t change much. The
company's second quarter data showed that net revenue increased 12% to reach
$11.3 billion, exceeding analyst estimates. However, Coca-Cola executives
warned that there are already signs of inflation and an economic recesssion
having a bad impact on consumer buying power, particularly Europe.
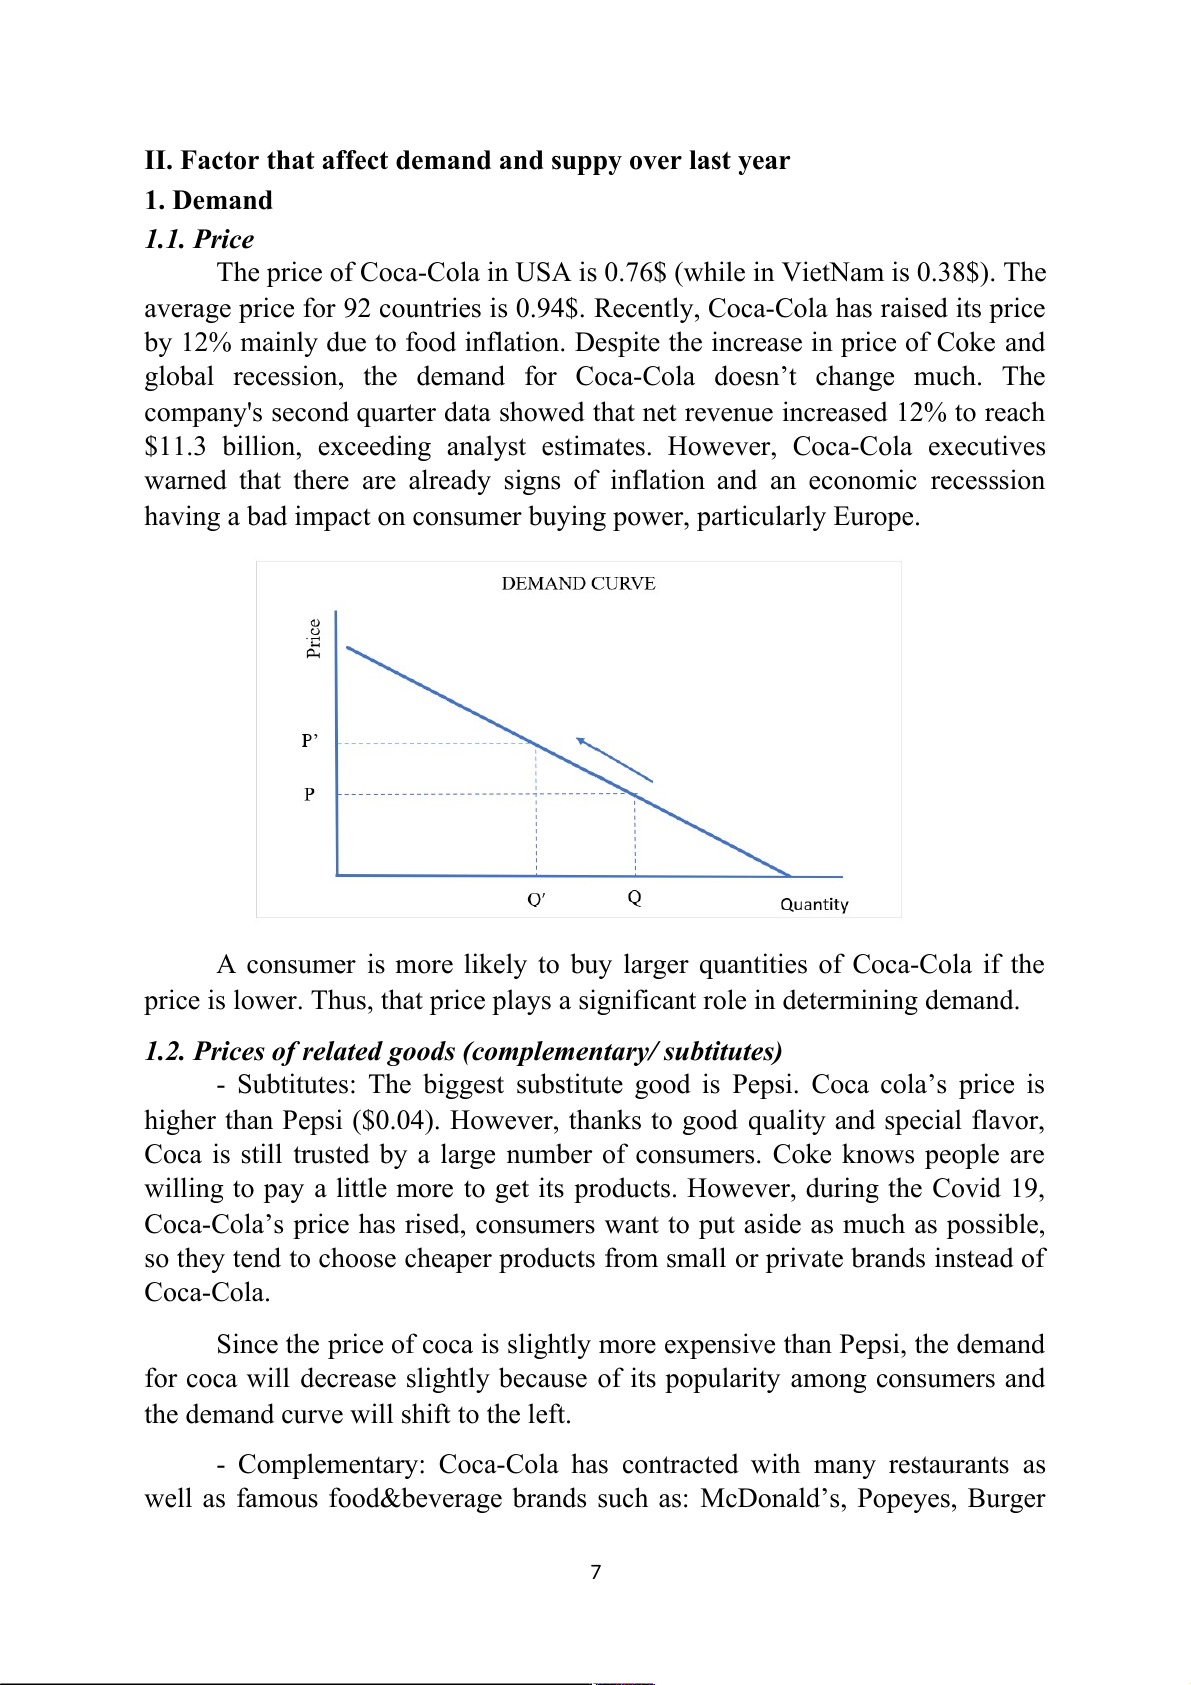
A consumer is more likely to buy larger quantities of Coca-Cola if the
price is lower. Thus, that price plays a significant role in determining demand.
1.2. Prices of related goods (complementary/ subtitutes)
- Subtitutes: The biggest substitute good is Pepsi. Coca cola’s price is
higher than Pepsi ($0.04). However, thanks to good quality and special flavor,
Coca is still trusted by a large number of consumers. Coke knows people are
willing to pay a little more to get its products. However, during the Covid 19,
Coca-Cola’s price has rised, consumers want to put aside as much as possible,
so they tend to choose cheaper products from small or private brands instead of Coca-Cola.
Since the price of coca is slightly more expensive than Pepsi, the demand
for coca will decrease slightly because of its popularity among consumers and
the demand curve will shift to the left.
- Complementary: Coca-Cola has contracted with many restaurants as
well as famous food&beverage brands such as: McDonald’s, Popeyes, Burger 7
King, Domino's Pizza, Dunkin’s Donut... So, the demand for coco cola would
decline if the cost of complementary products (Mc Donald’s, Burger King,
KFC...) rises. This shifts the demand curve to the left.
- The number of consumers: 1.9 billion Coca-Cola products will be sold around
the world each day. Coca-Cola operates in more than 200 countries around the
world and has traditionally—like many global corporations—operated with a
complex network of marketing and advertising partners throughout its
worldwide business (J. Beer 2022). Due to the impact of the covid epidemic in
recent years, the number of consumers is also lower than before the epidemic,
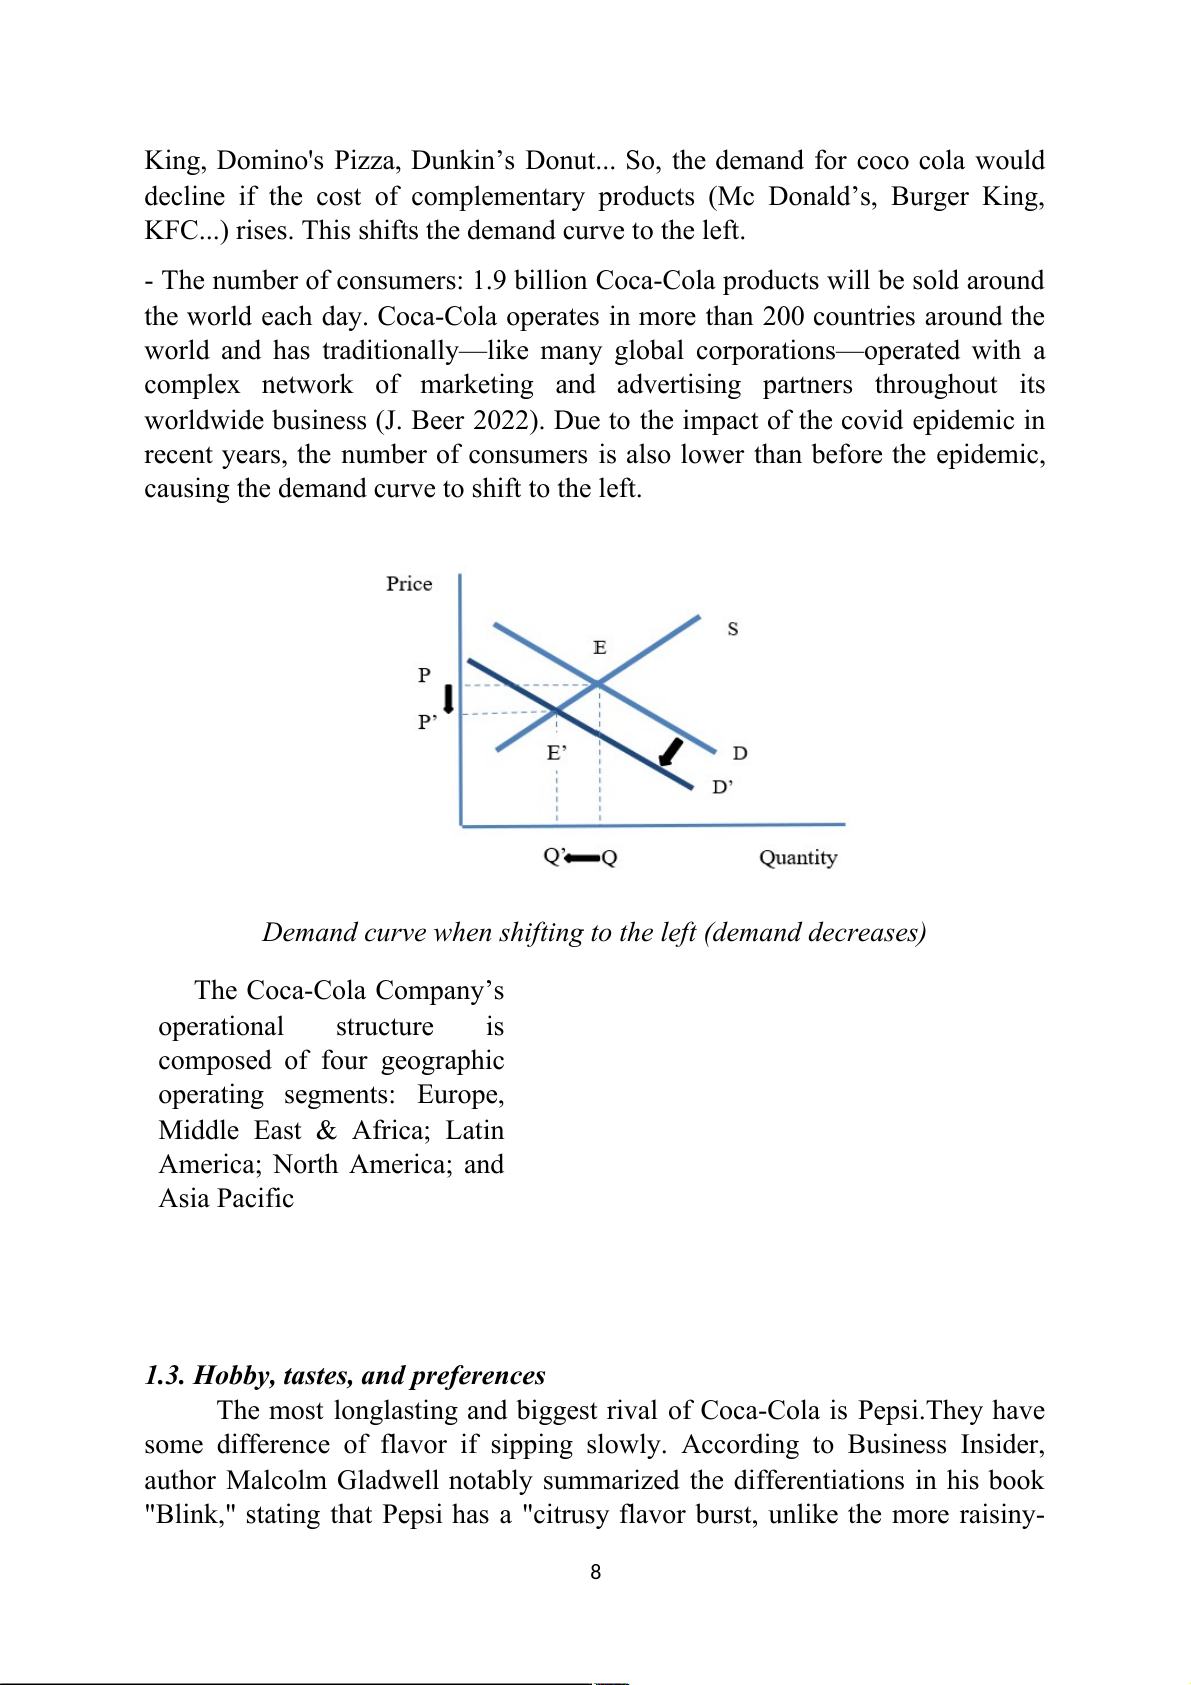
causing the demand curve to shift to the left.
Demand curve when shifting to the left (demand decreases) The Coca-Cola Company’s operational structure is composed of four geographic operating segments: Europe,
Middle East & Africa; Latin America; North America; and Asia Pacific
1.3. Hobby, tastes, and preferences
The most longlasting and biggest rival of Coca-Cola is Pepsi.They have
some difference of flavor if sipping slowly. According to Business Insider,
author Malcolm Gladwell notably summarized the differentiations in his book
"Blink," stating that Pepsi has a "citrusy flavor burst, unlike the more raisiny- 8
vanilla taste of Coke”. It can be saw clearly in the nutrients fact that Pepsi’s
ingredients include citrid acid and Coke lacks it in the category. Pepsi has a
higher amount of sugar as well as calories and caffeine: Pepsi has 2 more grams
of sugar than Coke in a 12-ounce can (41 grams and 39 grams). That’s why
Pepsi is sweeter than Coca - the biggest difference between them. Moreover,
Coca Cola has a higher amount of sodium as well as more aggressive fizz.
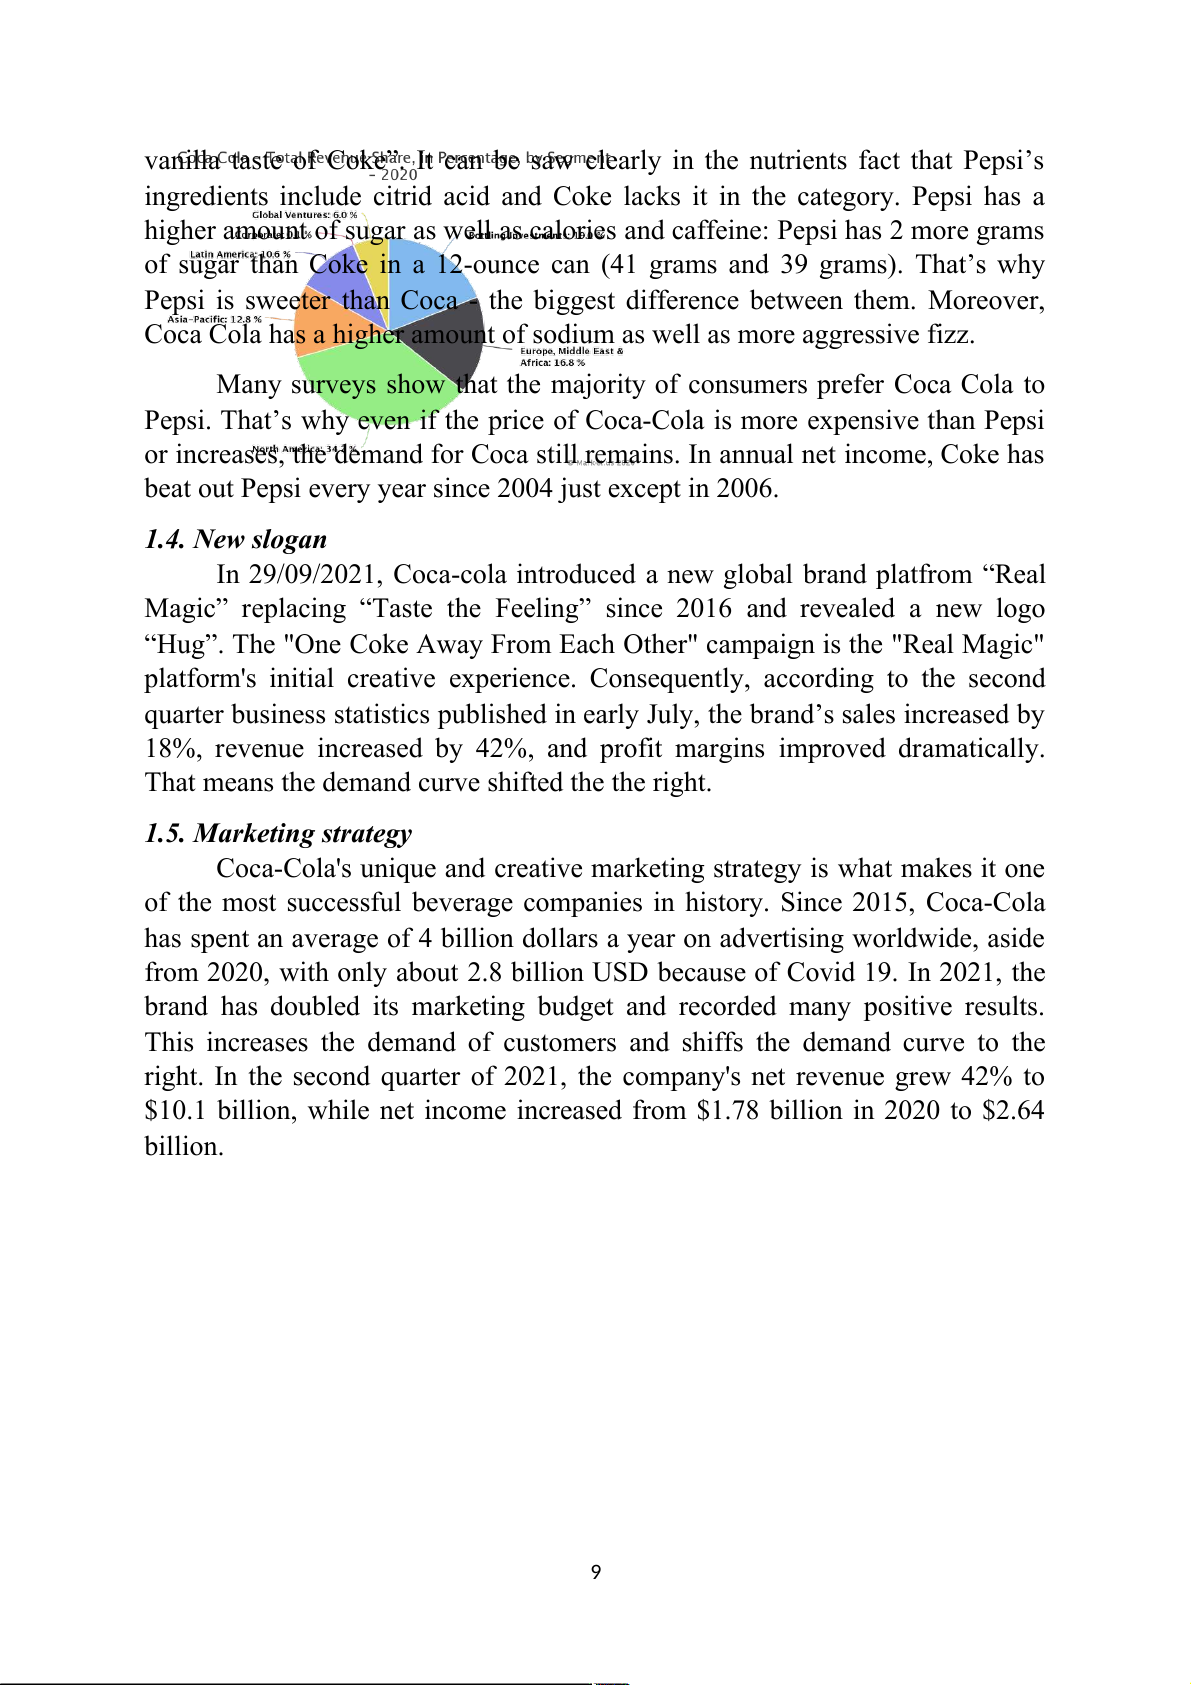
Many surveys show that the majority of consumers prefer Coca Cola to
Pepsi. That’s why even if the price of Coca-Cola is more expensive than Pepsi
or increases, the demand for Coca still remains. In annual net income, Coke has
beat out Pepsi every year since 2004 just except in 2006. 1.4. New slogan
In 29/09/2021, Coca-cola introduced a new global brand platfrom “Real
Magic” replacing “Taste the Feeling” since 2016 and revealed a new logo
“Hug”. The "One Coke Away From Each Other" campaign is the "Real Magic"
platform's initial creative experience. Consequently, according to the second
quarter business statistics published in early July, the brand’s sales increased by
18%, revenue increased by 42%, and profit margins improved dramatically.
That means the demand curve shifted the the right.
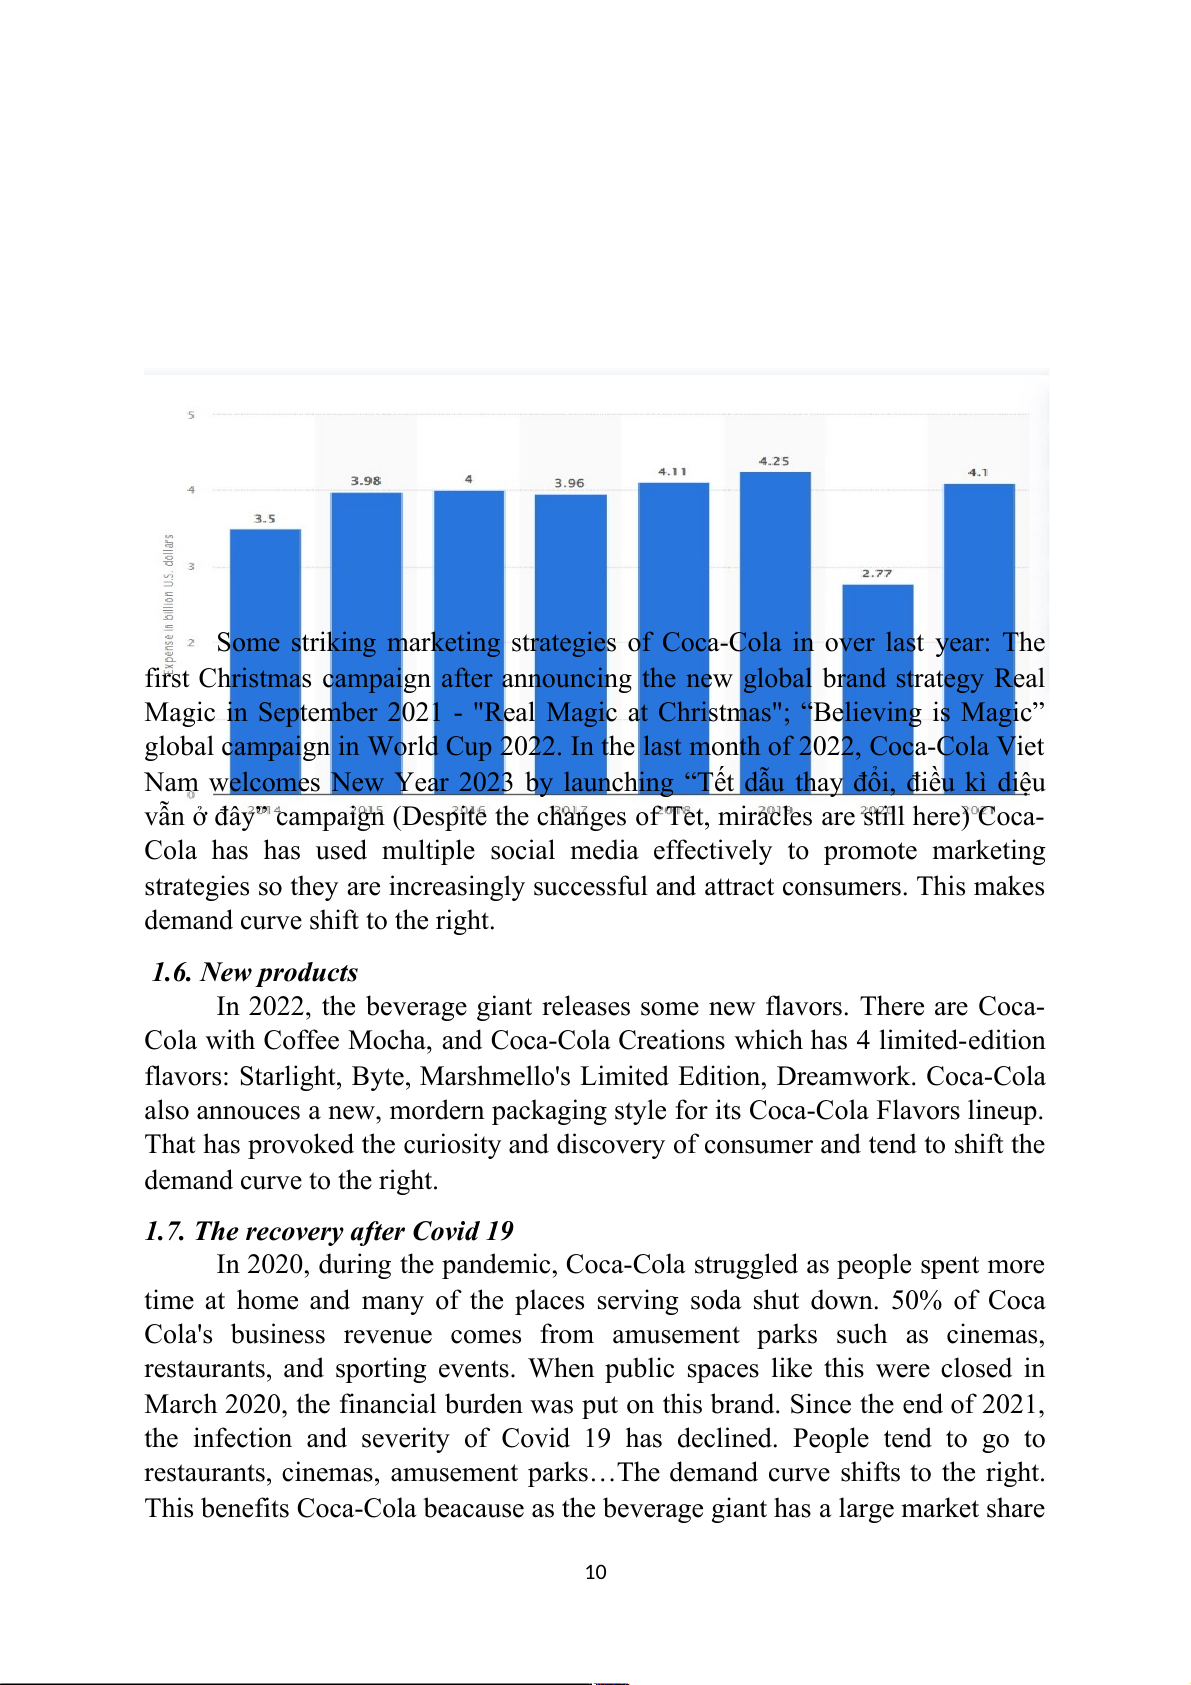
1.5. Marketing strategy
Coca-Cola's unique and creative marketing strategy is what makes it one
of the most successful beverage companies in history. Since 2015, Coca-Cola
has spent an average of 4 billion dollars a year on advertising worldwide, aside
from 2020, with only about 2.8 billion USD because of Covid 19. In 2021, the
brand has doubled its marketing budget and recorded many positive results.
This increases the demand of customers and shiffs the demand curve to the
right. In the second quarter of 2021, the company's net revenue grew 42% to
$10.1 billion, while net income increased from $1.78 billion in 2020 to $2.64 billion. 9
Some striking marketing strategies of Coca-Cola in over last year: The
first Christmas campaign after announcing the new global brand strategy Real
Magic in September 2021 - "Real Magic at Christmas"; “Believing is Magic”
global campaign in World Cup 2022. In the last month of 2022, Coca-Cola Viet
Nam welcomes New Year 2023 by launching “Tết dẫu thay đổi, điều kì diệu
vẫn ở đây” campaign (Despite the changes of Tet, miracles are still here) Coca-
Cola has has used multiple social media effectively to promote marketing
strategies so they are increasingly successful and attract consumers. This makes
demand curve shift to the right.
1.6. New products
In 2022, the beverage giant releases some new flavors. There are Coca-
Cola with Coffee Mocha, and Coca-Cola Creations which has 4 limited-edition
flavors: Starlight, Byte, Marshmello's Limited Edition, Dreamwork. Coca-Cola
also annouces a new, mordern packaging style for its Coca-Cola Flavors lineup.
That has provoked the curiosity and discovery of consumer and tend to shift the demand curve to the right.
1.7. The recovery after Covid 19
In 2020, during the pandemic, Coca-Cola struggled as people spent more
time at home and many of the places serving soda shut down. 50% of Coca
Cola's business revenue comes from amusement parks such as cinemas,
restaurants, and sporting events. When public spaces like this were closed in
March 2020, the financial burden was put on this brand. Since the end of 2021,
the infection and severity of Covid 19 has declined. People tend to go to
restaurants, cinemas, amusement parks…The demand curve shifts to the right.
This benefits Coca-Cola beacause as the beverage giant has a large market share 10
in external consumption channels and Coca-Cola’s price at outside locations is
higher than at grocery stores where sell Coke for home consumption. For the
full year of 2021, the company's revenue grew 17% to $38.7 billion while EPS grew 26% to $2.25. 2. Supply 2.1. Technology
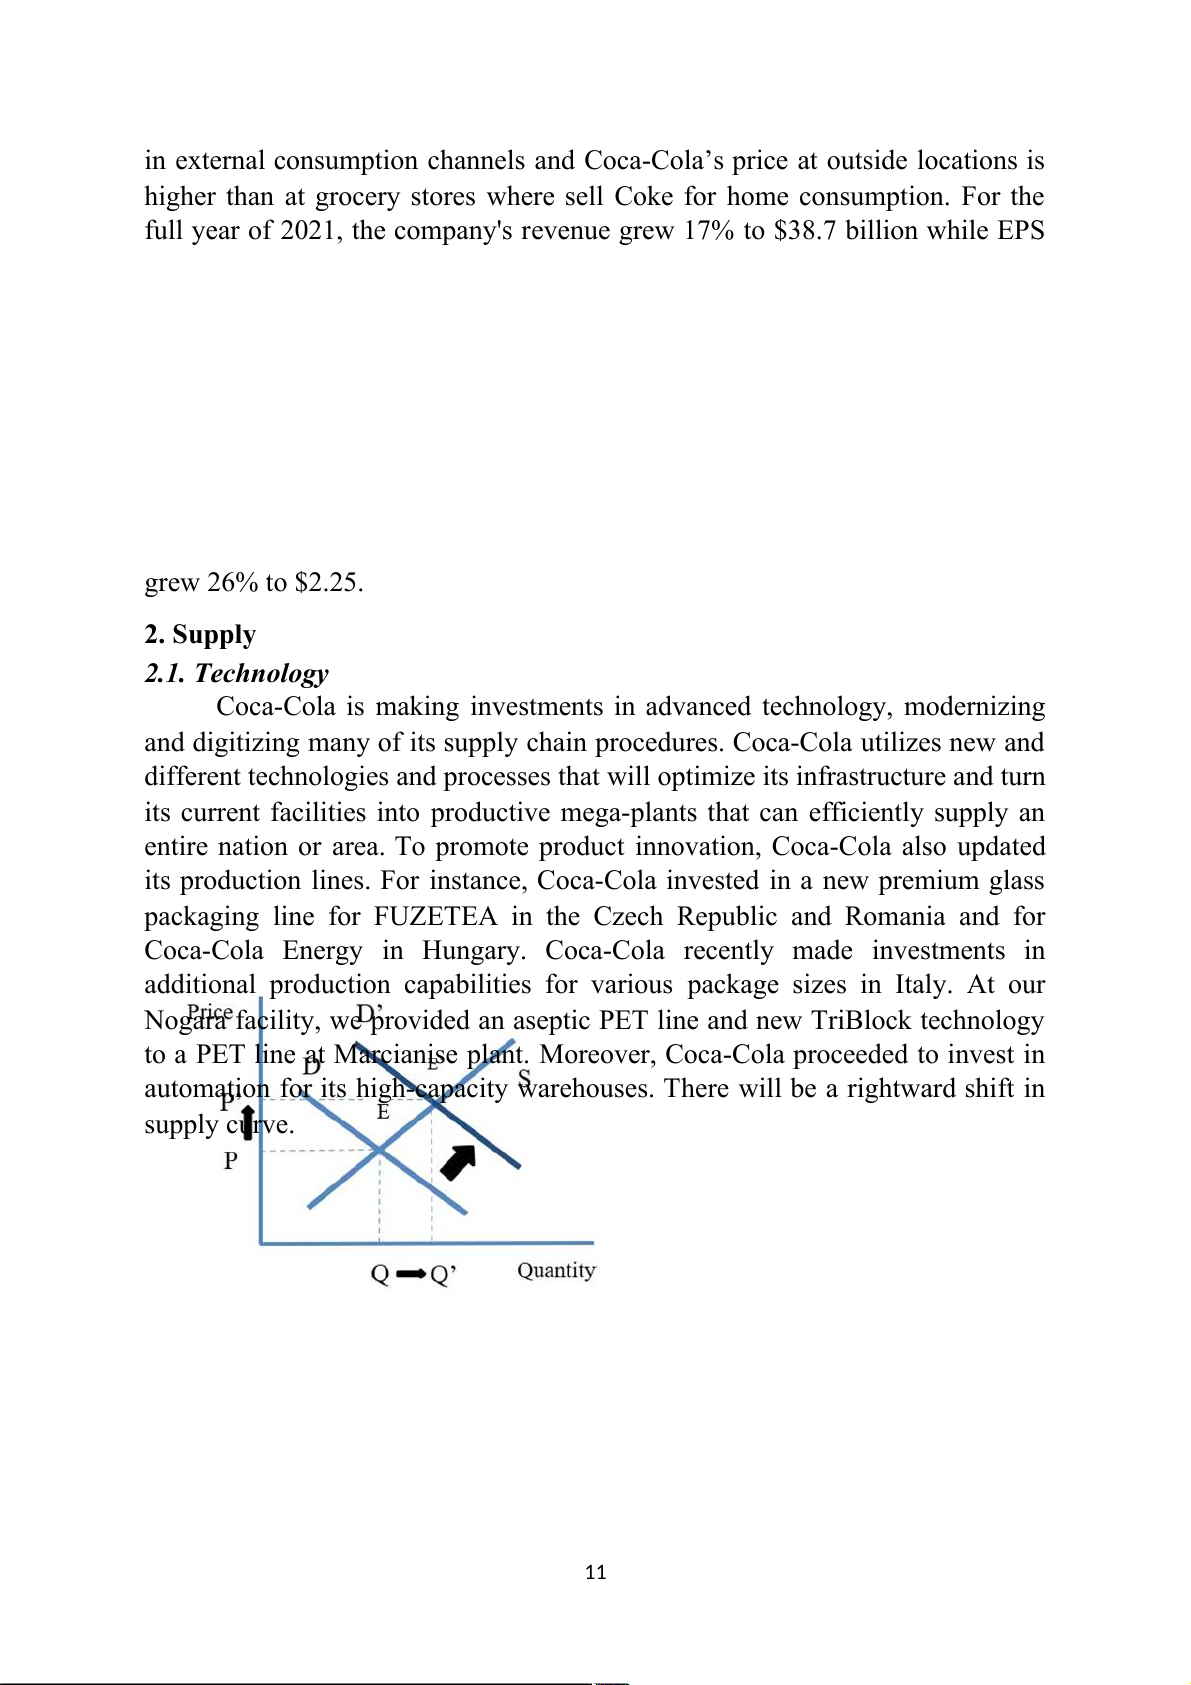
Coca-Cola is making investments in advanced technology, modernizing
and digitizing many of its supply chain procedures. Coca-Cola utilizes new and
different technologies and processes that will optimize its infrastructure and turn
its current facilities into productive mega-plants that can efficiently supply an
entire nation or area. To promote product innovation, Coca-Cola also updated
its production lines. For instance, Coca-Cola invested in a new premium glass
packaging line for FUZETEA in the Czech Republic and Romania and for
Coca-Cola Energy in Hungary. Coca-Cola recently made investments in
additional production capabilities for various package sizes in Italy. At our
Nogara facility, we provided an aseptic PET line and new TriBlock technology
to a PET line at Marcianise plant. Moreover, Coca-Cola proceeded to invest in
automation for its high-capacity warehouses. There will be a rightward shift in supply curve. 11
Supply curve shifts to the right (supply increases)
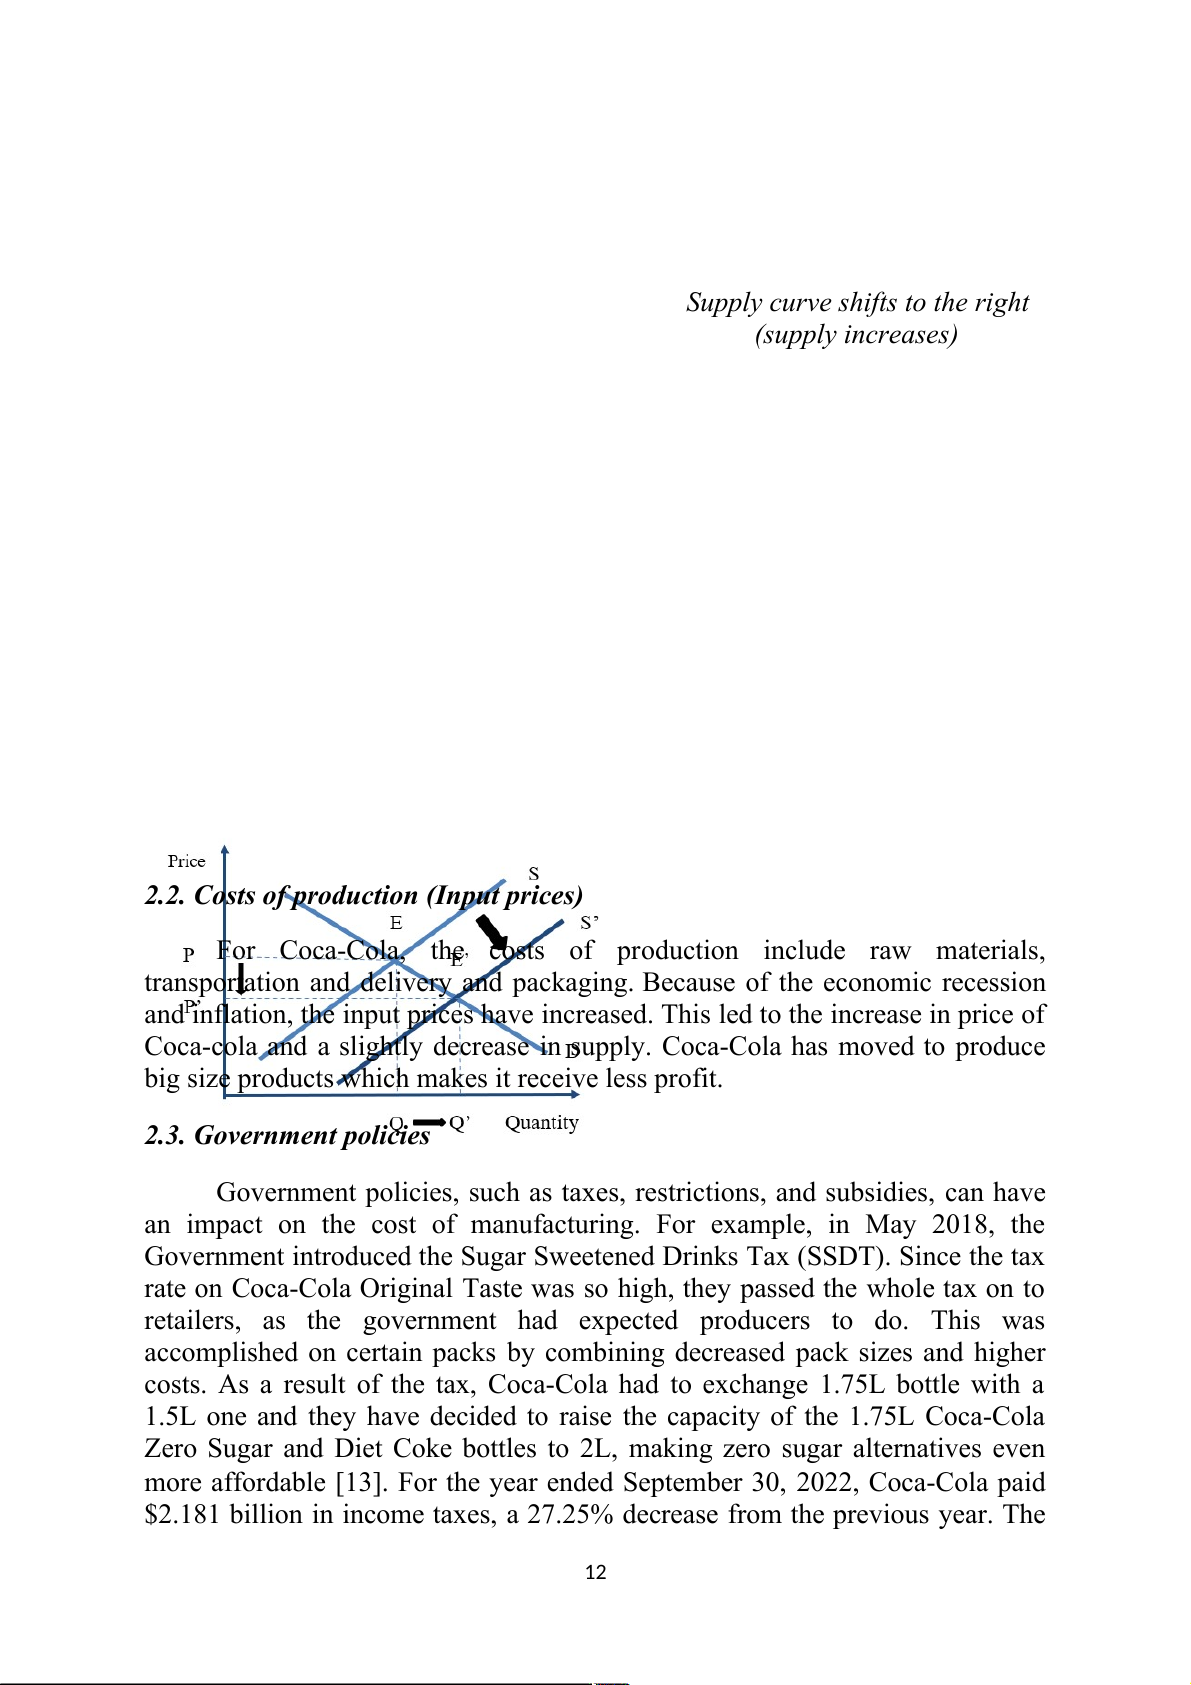
2.2. Costs of production (Input prices)
For Coca-Cola, the costs of production include raw materials,
transportation and delivery and packaging. Because of the economic recession
and inflation, the input prices have increased. This led to the increase in price of
Coca-cola and a slightly decrease in supply. Coca-Cola has moved to produce
big size products which makes it receive less profit.
2.3. Government policies
Government policies, such as taxes, restrictions, and subsidies, can have
an impact on the cost of manufacturing. For example, in May 2018, the
Government introduced the Sugar Sweetened Drinks Tax (SSDT). Since the tax
rate on Coca-Cola Original Taste was so high, they passed the whole tax on to
retailers, as the government had expected producers to do. This was
accomplished on certain packs by combining decreased pack sizes and higher
costs. As a result of the tax, Coca-Cola had to exchange 1.75L bottle with a
1.5L one and they have decided to raise the capacity of the 1.75L Coca-Cola
Zero Sugar and Diet Coke bottles to 2L, making zero sugar alternatives even
more affordable [13]. For the year ended September 30, 2022, Coca-Cola paid
$2.181 billion in income taxes, a 27.25% decrease from the previous year. The 12
company must deal with harsh taxation policies in some countries to set up its
branches. The government policies in many countries have significantly come
up with policies for price control. The companies must control their prices
according to the country’s policies [14]. It seems that policies of
government have minimal impact on the supply of Coca. The supply curve may shift to the left.
Supply curve shifts to the left (Supply decreases)
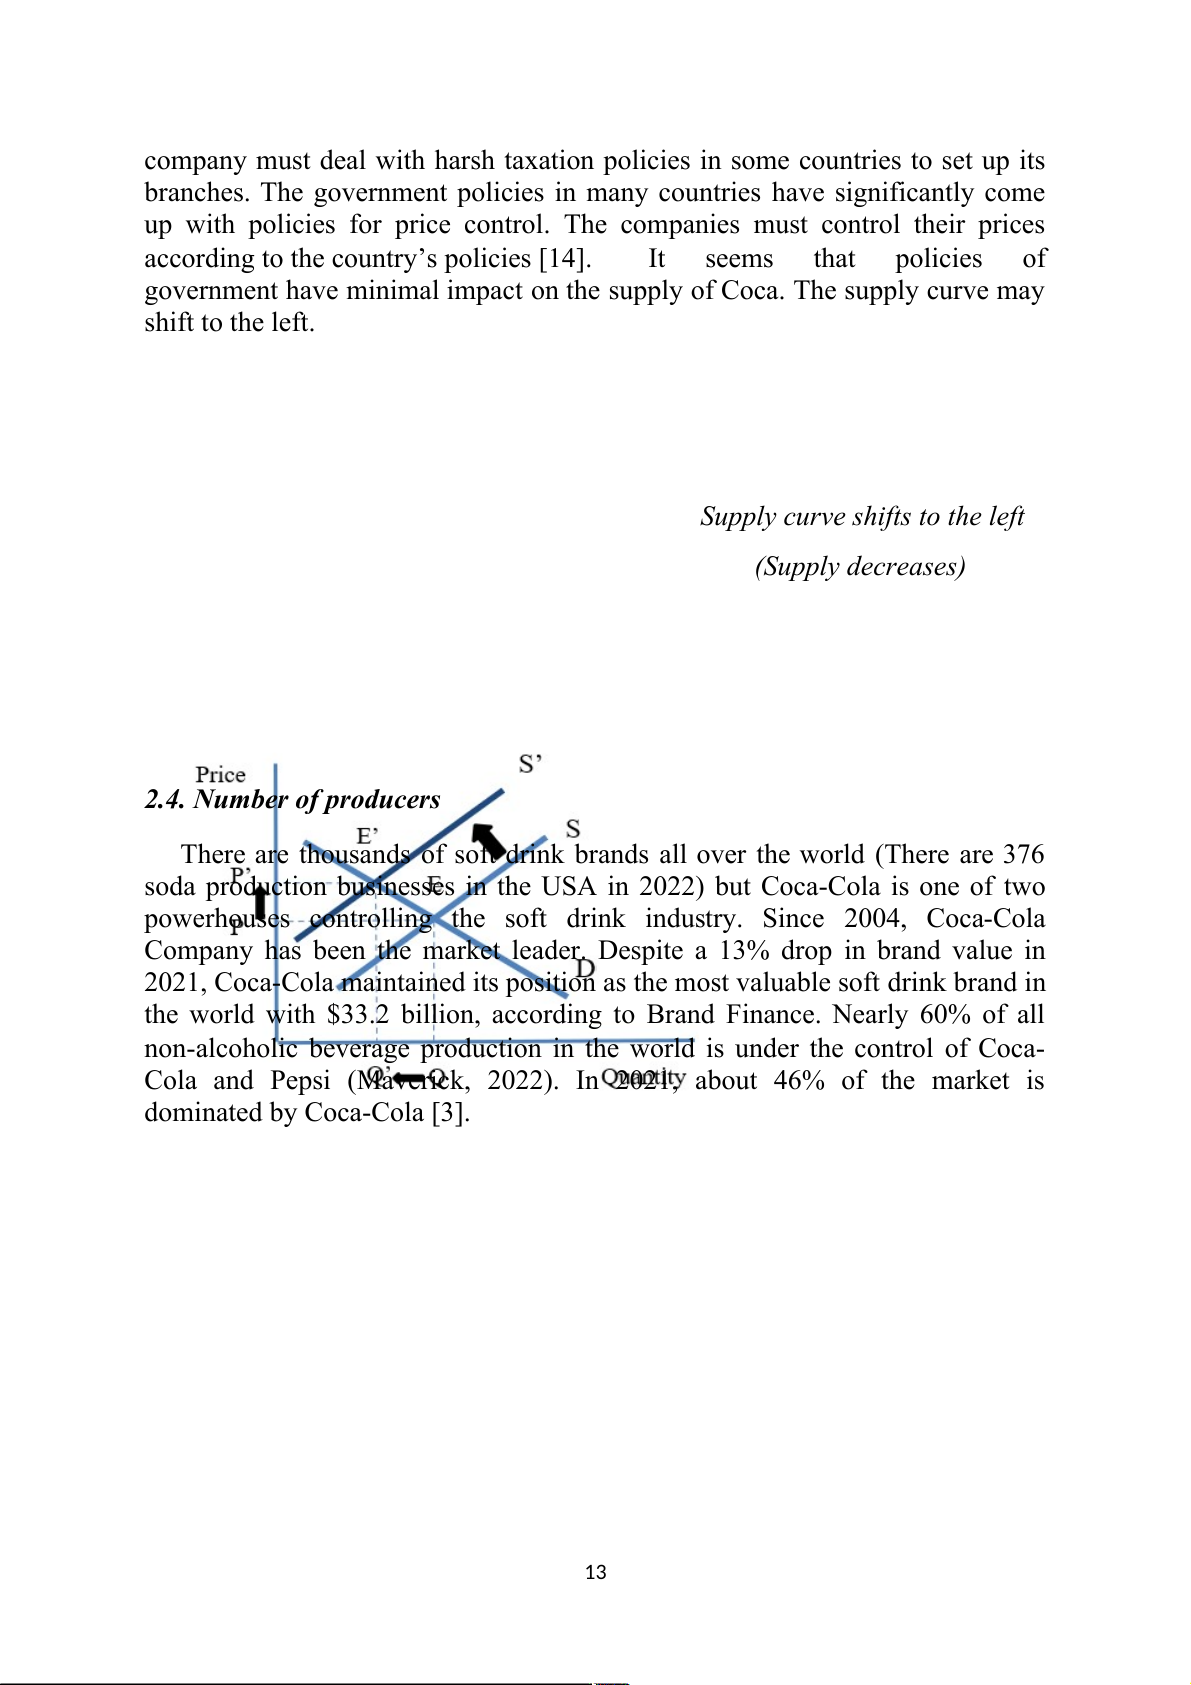
2.4. Number of producers
There are thousands of soft drink brands all over the world (There are 376
soda production businesses in the USA in 2022) but Coca-Cola is one of two
powerhouses controlling the soft drink industry. Since 2004, Coca-Cola
Company has been the market leader. Despite a 13% drop in brand value in
2021, Coca-Cola maintained its position as the most valuable soft drink brand in
the world with $33.2 billion, according to Brand Finance. Nearly 60% of all
non-alcoholic beverage production in the world is under the control of Coca-
Cola and Pepsi (Maverick, 2022). In 2021, about 46% of the market is dominated by Coca-Cola [3]. 13 CONCLUSION
The soft drink industry is oligopoly which is closer to monopoly than
pure comeptition. It has features of oligopoly market: a few big bussiness
control the market, interdependent firms, the difference of products, quite high
barriers to enter or exit, imperfect information. Coca-Cola is the top brand in this market.
With all these factors above, in 2022 Coca-Cola’s financial report has
gone beyond expectations and raised growth forecast despite global recession.
Coca-Cola's revenue for the year ended September 30, 2022, was $42.343
billion, up 12.01% from the previous year [15]. According to the report of
Coca-Cola’s third-quarter 2022 results: Net revenues increased by 10% to $11.1
billion, and organic revenues (non-GAAP) increased by 16%; Operating Income
increased by 7%, Comparable Currency Neutral Operating Income (Non-
GAAP) grew 18%; Operating Margin was 27.9% compared to 28.9% the year
before, while comparable operating margin (non-GAAP) was 29.5% compared
to 30.0%; EPS rised by 14% to $0.65 while comparable EPS (non-GAAP)
increased by 7% to $0.69. Reuters reports that Coca-third-quarter Cola's
revenue and earnings above expectations, which led to a 2.3% increase in the
company's stock price. The company expects net sales to increase 14–15% in
2022, which is 2% more than its earlier prediction of 12–13%. Coca-Cola
increased its prior prediction for full-year earnings per share growth from 5-6%
to 6-7%. In 2022, Coca-Cola’s brand is valued at 97.9 billion U.S. dollars.
Moreover, following the Brand Finance Food & Drink 2022, Coca-Cola
dominates the non-alcoholic beverage industry with a global market value of
US$35.4 billion; Coca-Cola also has an outstanding AAA+ rating, making it the
most powerful non-alcoholic beverage brand. In general, Coca-Cola is the top
brand in the soft drink industry with 46.3% market shares. 14 REFERENCES
1. L.J. Mohan Rao, K. Ramalakshmi (2011), Recent Trends in Soft Beverages
[2]. Soft Drinks Market Size, Share & Trends Analysis Report By Product,
https://www.grandviewresearch.com/industry-analysis/soft-drinks-market- report
3. M. Ridder (2022), Leading carbonated soft drink (CSD) companies in the
United States in 2021, based on volume share
4. Coca Cola market structure Analytical Essay (2021)
5. D. Saxena (2018), Product Differentiation is the Secret Ingredient (Pepsi vs.
Coca-Cola), https://www.superheuristics.com/product-differentiation-pepsi-vs- coca-cola/
6. Level Strategic Pricing Between Coca Cola Company and PepsiCo. Journal
of Economics & Management Strategy, 905-931
7. Doyle, P. (1990), Building successful brands: the strategic options. Journal of consumer Marketing, 5-20
8. UKEssays (2018), The Competitive Strategies Of Coca Cola Economics
Essay, https://www.ukessays.com/essays/economics/the-competitive-strategies-
of-coca-cola-economics-essay.php?vref=1
9. K. Martin (2022), Why Coca-Cola Is Planning To Keep Raising Its Prices,
https://www.tastingtable.com/943054/why-coca-cola-is-planning-to-keep- raising-its-prices/
10. J. Beer (2022), Coca-Cola has an ambitious plan to double its number of
customers in the next few years
11. M. Ridder (2022), Coca-Cola Company's advertising expense from 2014 to 2021,
12. Supply Chain Overview, https://www.coca-colahellenic.com/en/about-us/ what-we-do/supply-chain [13]. The Sugar Tax,
https://www.coca-cola.co.uk/ingredients/reducing-sugar/lets-talk-about-soft- drinks-tax
[14]. Flood P. (2000), Managing Strategy Implementation, an Organizational Behavior Perspective 15
14. J. Gelski (2021), Food Business News, State of the Beverage Industry
15. CocaCola Revenue 2010-2022, Macrotrends
16. J.B. Maverick, Coke vs. Pepsi: Who Controls the Market Share?
https://www.investopedia.com/ask/answers/060415/how-much-global-beverage
-industry-controlled-coca-cola-and-pepsi.asp#citation-1
17. Coca-Cola Reports Third Quarter 2022 Results and Raises Full-Year
Guidance, https://investors.coca-colacompany.com/news-events/press-releases/
detail/1071/coca-cola-reports-third-quarter-2022-results-and-raises 18. Brand Finance Food & Drink 2022,
https://brandirectory.com/rankings/food/ 16
Tài liệu liên quan:
-

Chương 3: độ co giãn và các nhân tố ảnh hưởng | Microeconomics | Trường Đại học Quốc tế, Đại học Quốc gia Thành phố Hồ Chí Minh
0 0 -

Microeconomics Syllabus | Microeconomics | Trường Đại học Quốc tế, Đại học Quốc gia Thành phố Hồ Chí Minh
0 0 -

Microeconomics Course Syllabus & Assessment Details | Microeconomics | Trường Đại học Quốc tế, Đại học Quốc gia Thành phố Hồ Chí Minh
0 0 -

Assignment 3 - Elasticity MCQs and Key Concepts | Microeconomics | Trường Đại học Quốc tế, Đại học Quốc gia Thành phố Hồ Chí Minh
0 0 -

Assignment 2 - Economic Equilibrium Analysis of Fridges and Motorcycles | Microeconomics | Trường Đại học Quốc tế, Đại học Quốc gia Thành phố Hồ Chí Minh
1 1