Production Possibilities and Opportunity Costs Analysis | Microeconomics | Trường Đại học Quốc tế, Đại học Quốc gia Thành phố Hồ Chí Minh
First and foremost, the guiding missiles’ increasing output from 0 to 12 thousands worth 2 million cars. In other words, 2 million cars is the opportunity cost for the increase from 0 to 12 thousands in producing guiding missiles. (From E to D) The opportunity cost of producing 12 thousands more guided missiles. Tài liệu được sưu tầm và soạn thảo dưới dạng file PDF để gửi tới các bạn cùng tham khảo, ôn tập đầy đủ kiến thức, chuẩn bị cho các buổi học thật tốt. Mời bạn đọc đón xem!
Môn: Microeconomics 635 tài liệu
Trường: Trường Đại học Quốc tế, Đại học Quốc gia Thành phố Hồ Chí Minh 1.9 K tài liệu
Tác giả:

Preview text:
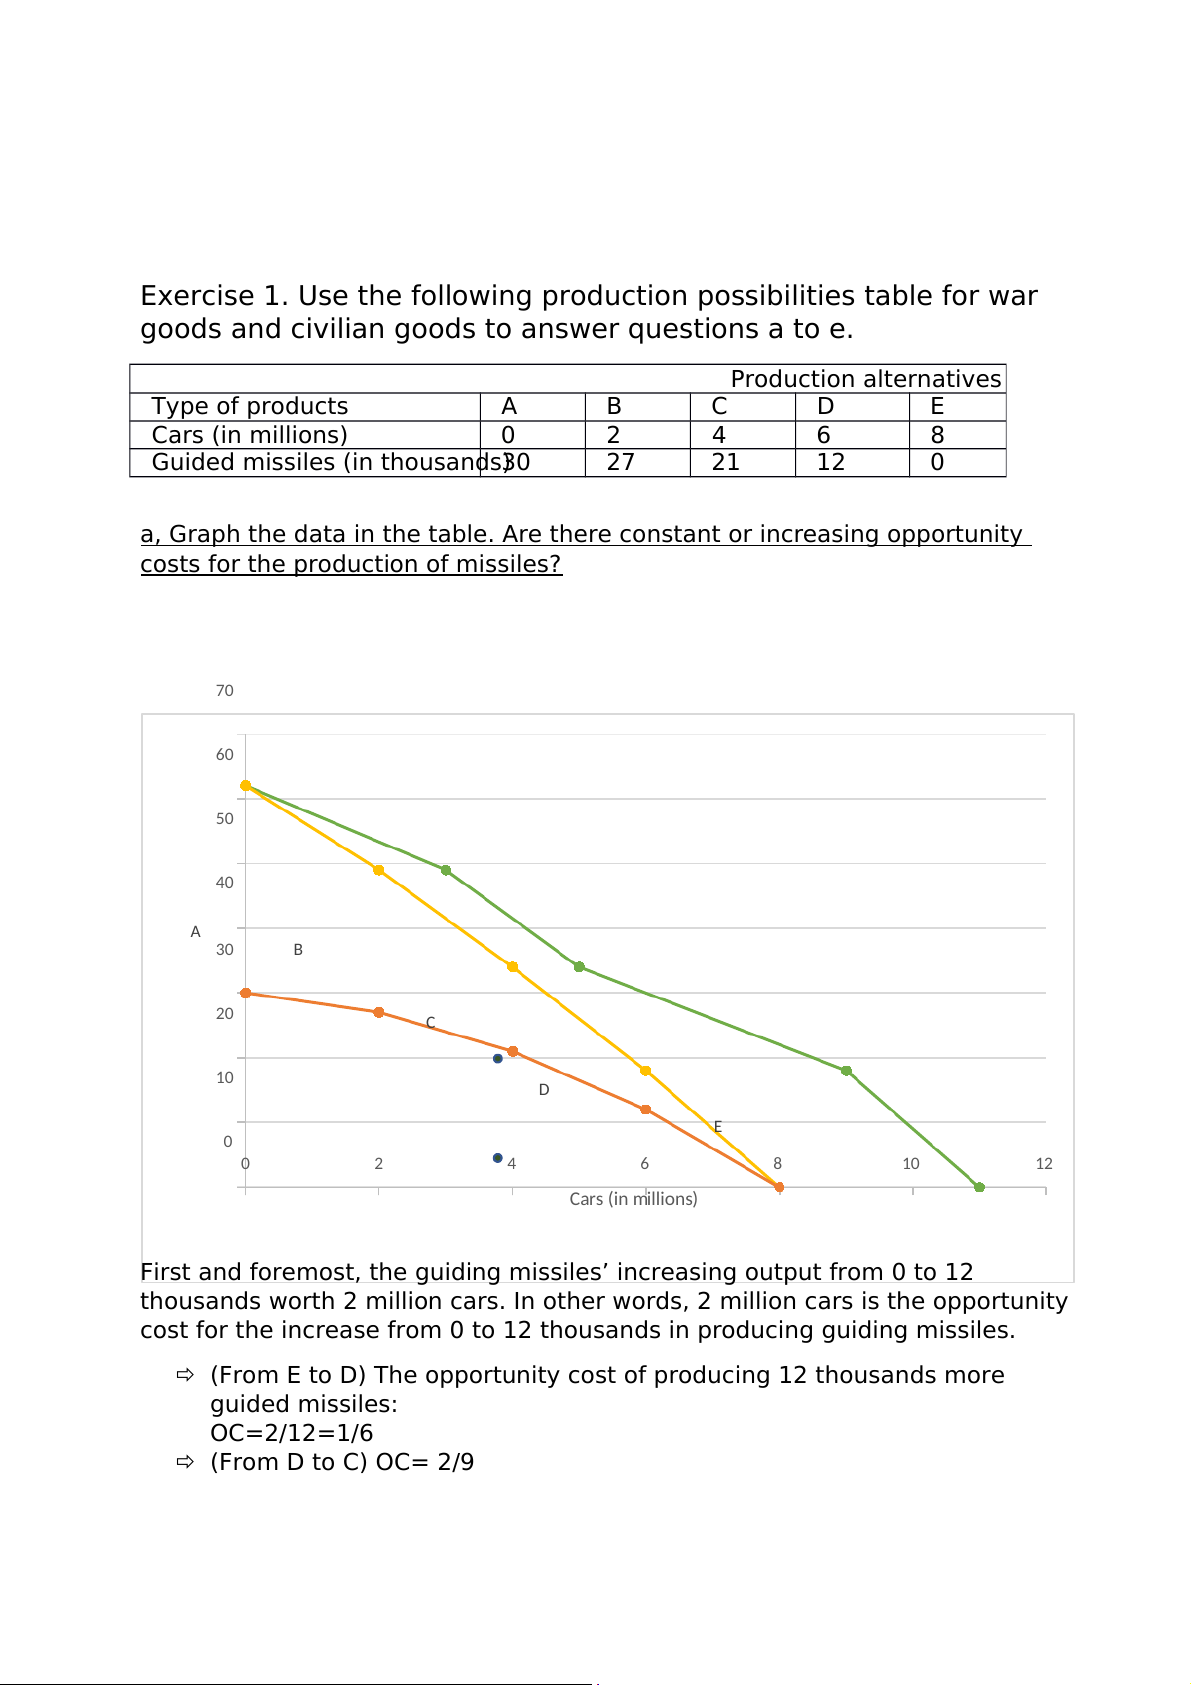
Exercise 1. Use the following production possibilities table for war
goods and civilian goods to answer questions a to e. Production alternatives Type of products A B C D E Cars (in millions) 0 2 4 6 8
Guided missiles (in thousands)30 27 21 12 0
a, Graph the data in the table. Are there constant or increasing opportunity
costs for the production of missiles? 70 60 ) 50 nds usa 40 ho A s (in t 30 B ile is d m 20 C uide G 10 D E 0 0 2 4 6 8 10 12 Cars (in millions)
First and foremost, the guiding missiles’ increasing output from 0 to 12
thousands worth 2 million cars. In other words, 2 million cars is the opportunity
cost for the increase from 0 to 12 thousands in producing guiding missiles.
(From E to D) The opportunity cost of producing 12 thousands more guided missiles: OC=2/12=1/6 (From D to C) OC= 2/9 (From C to B) OC= 1/3 (From B to A) OC= 2/3
Due to aforementioned statistic, there are no constant opportunity cost
but only increasing one in producing guided missiles.
b. If the economy is currently at point C:
- What is the cost of one million more cars?
The opportunity cost of producing 2 million more cars from C to D is 9
thousands guided missiles => The cost of one million more cars is 9/2= 4.5 thousand guided missiles
- What is the cost of one thousand more guided missiles?
The opportunity cost of producing 6 thousand more guided missiles from
C to B is 2 million cars => The cost of one thousand more guided missiles is 1/3=0.333 million cars
c. Label a point G inside the curve of the graph. What do es it indicate?
If point G lies inside the curve and indicate the production output of car
and guided missiles are 4 millions and 10 thousands respectively, it shows
the shortage in production efÏciency. Instead, with the statistic of 4
million cars, the most efÏcient number of guided missiles can actually be reached is 21 thousands.
d. Label a point H that lies outside the PPF curve.
- What does this point indicate?
If point G lies outside the curve and indicate the production output of car
and guided missiles are 4 millions and 25 thousands respectively, it shows
impossibility in making use of the limited resources. Instead, with the
statistic of 4 million cars, the most efÏcient number of guided missiles can
only be reached is 21 thousands.
- What must occur before the economy can attain the level of production indicated by point H?
The economy can attain the level of production indicated by point H only
when the inputs, such as labor, cutting-edged technology, are affordable
and being utilized wisely to reach the highest efÏciency in each
production procedure. For instance, with a surge in demand for vaccine
after the pandemic, modern machines, materials and human resources
are some of the top priorities for big manufacturers.
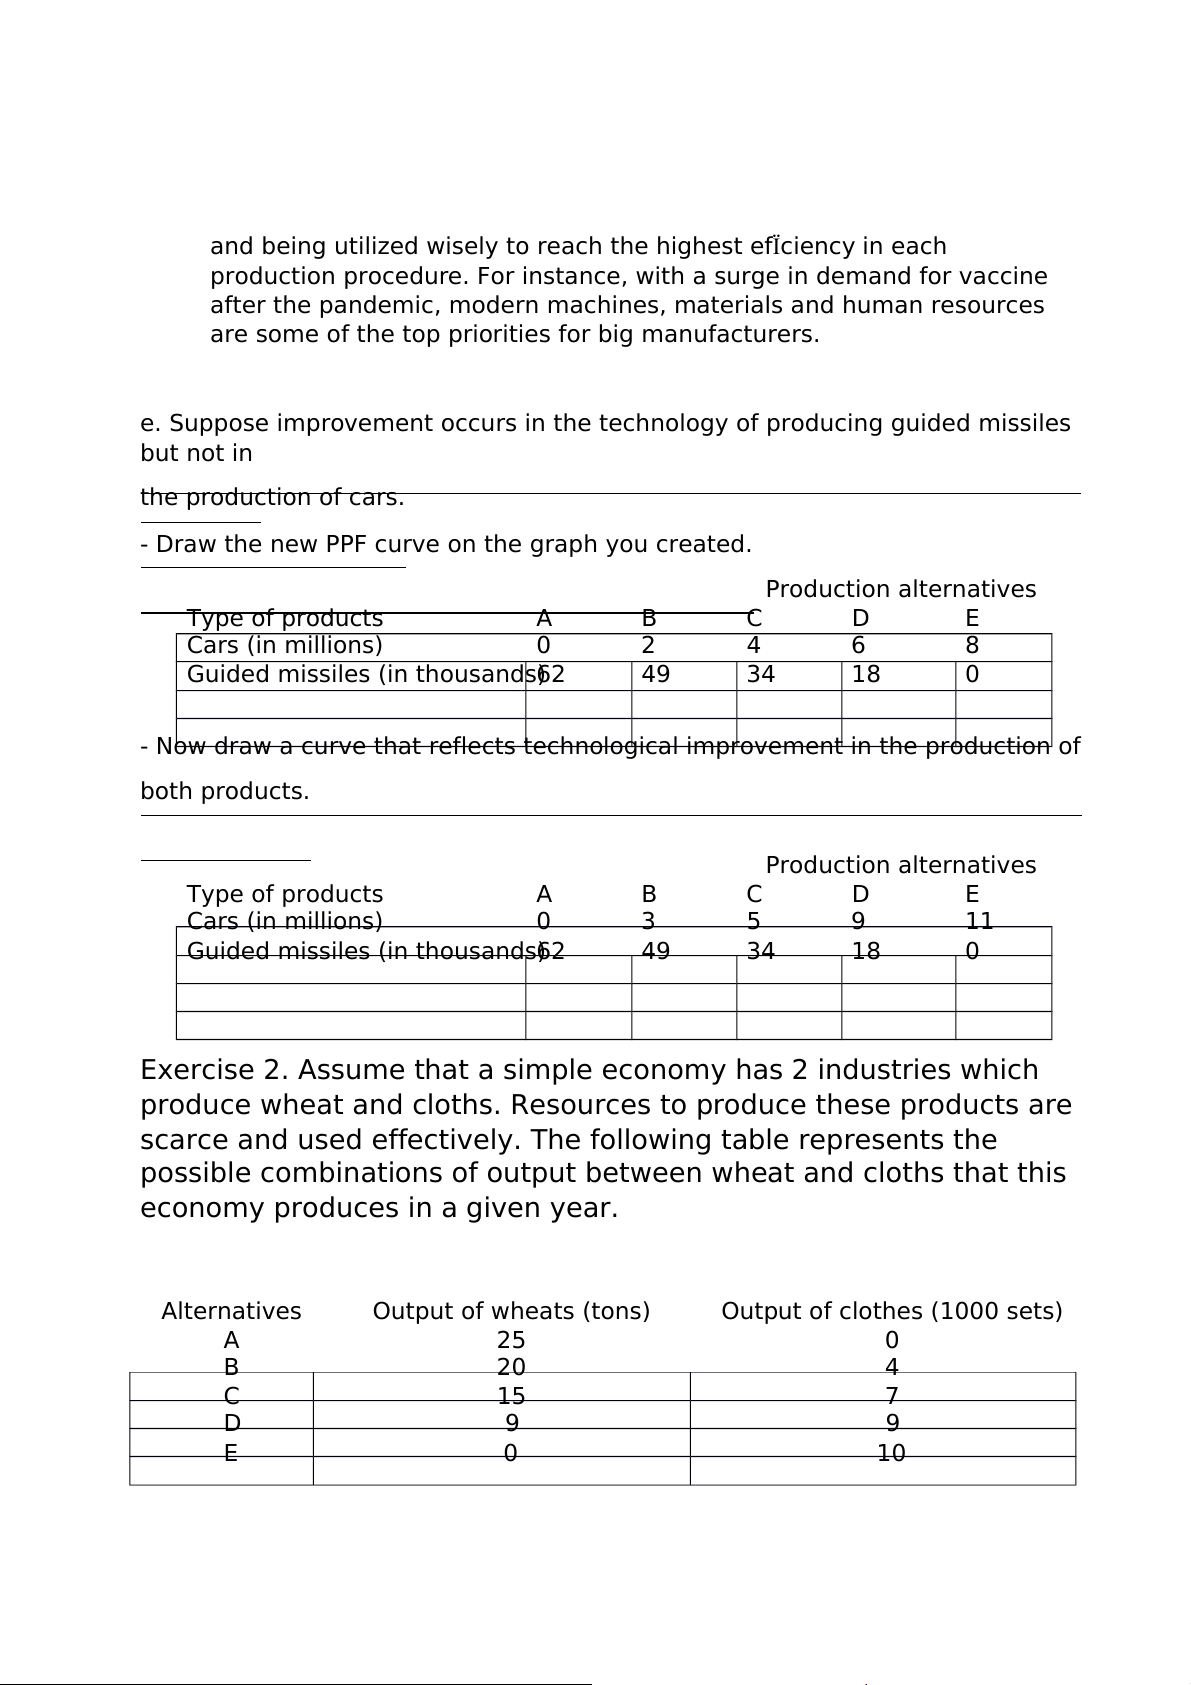
e. Suppose improvement occurs in the technology of producing guided missiles but not in the production of cars.
- Draw the new PPF curve on the graph you created. Production alternatives Type of products A B C D E Cars (in millions) 0 2 4 6 8
Guided missiles (in thousands)62 49 34 18 0
- Now draw a curve that reflects technological improvement in the production of both products. Production alternatives Type of products A B C D E Cars (in millions) 0 3 5 9 11
Guided missiles (in thousands)62 49 34 18 0
Exercise 2. Assume that a simple economy has 2 industries which
produce wheat and cloths. Resources to produce these products are
scarce and used effectively. The following table represents the
possible combinations of output between wheat and cloths that this
economy produces in a given year. Alternatives Output of wheats (tons) Output of clothes (1000 sets) A 25 0 B 20 4 C 15 7 D 9 9 E 0 10
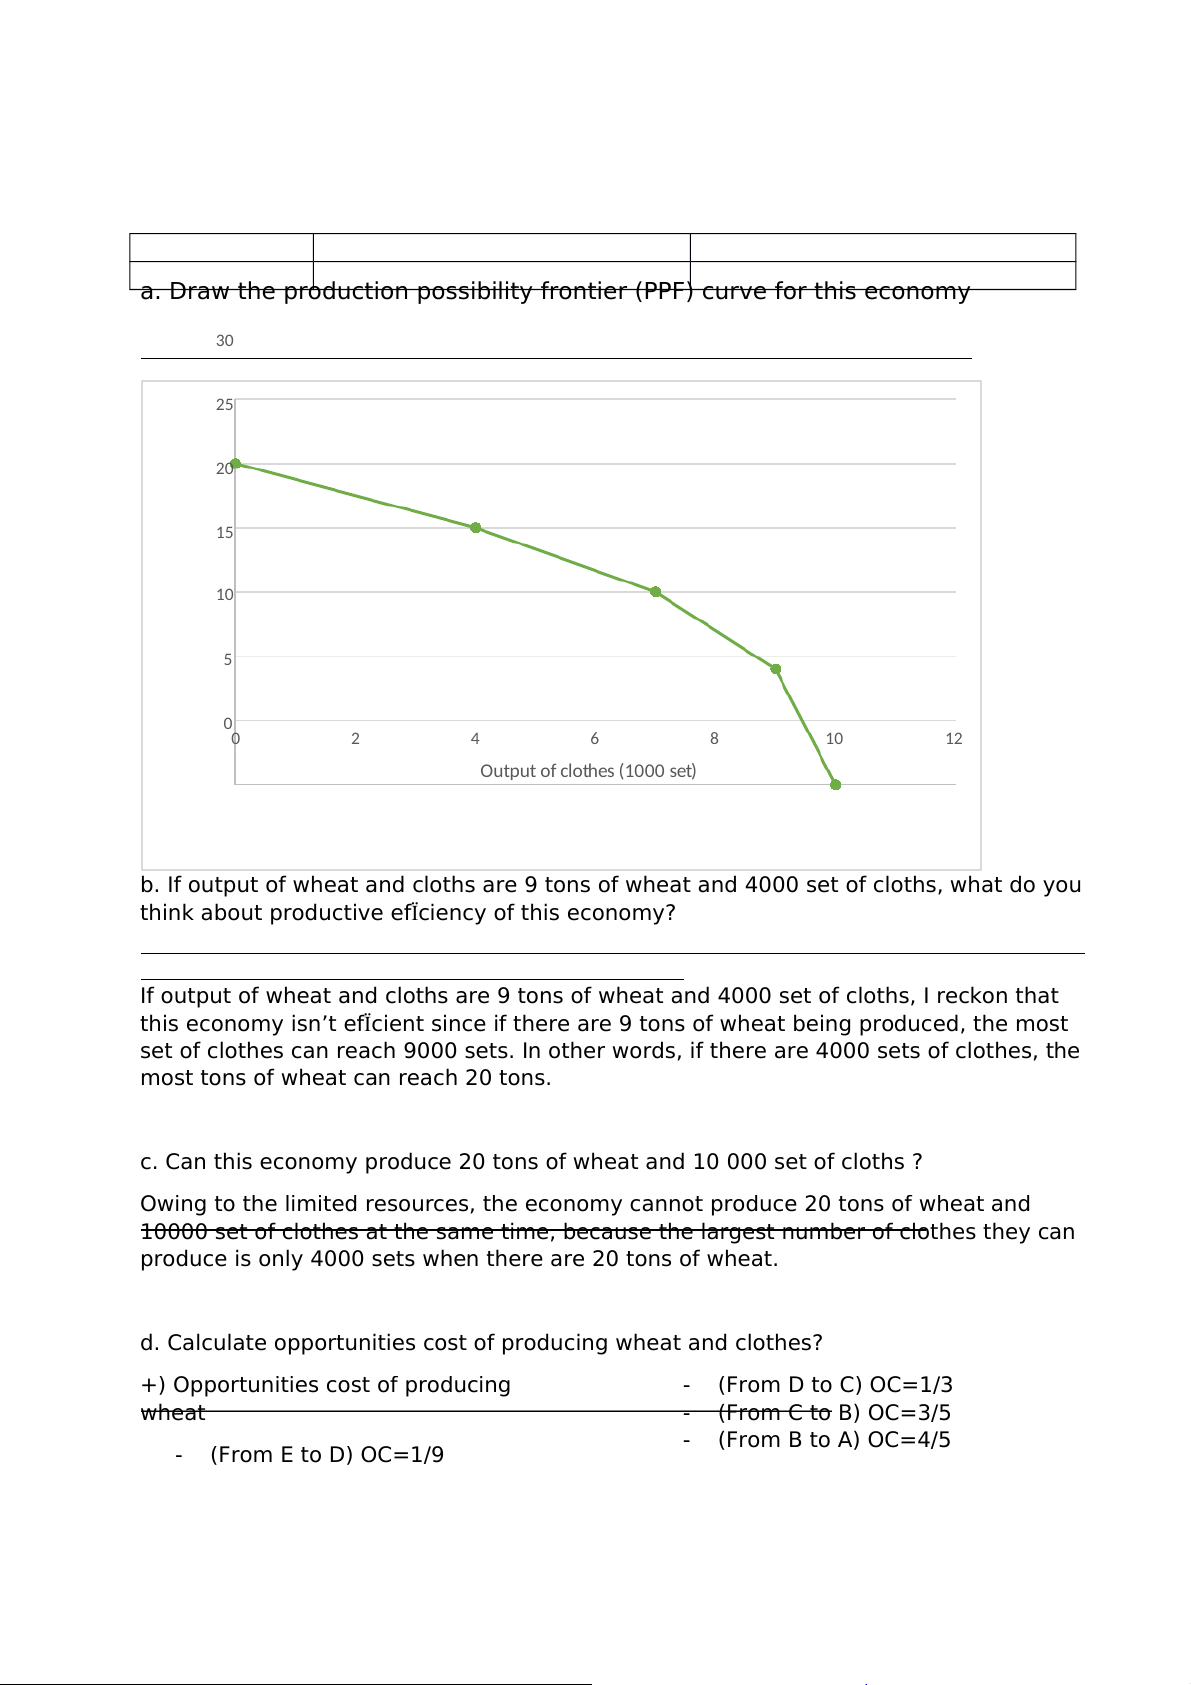
a. Draw the production possibility frontier (PPF) curve for this economy 30 25 ) 20 t (tons hea 15 of w 10 Output 5 00 2 4 6 8 10 12 Output of clothes (1000 set)
b. If output of wheat and cloths are 9 tons of wheat and 4000 set of cloths, what do you
think about productive efÏciency of this economy?
If output of wheat and cloths are 9 tons of wheat and 4000 set of cloths, I reckon that
this economy isn’t efÏcient since if there are 9 tons of wheat being produced, the most
set of clothes can reach 9000 sets. In other words, if there are 4000 sets of clothes, the
most tons of wheat can reach 20 tons.
c. Can this economy produce 20 tons of wheat and 10 000 set of cloths ?
Owing to the limited resources, the economy cannot produce 20 tons of wheat and
10000 set of clothes at the same time, because the largest number of clothes they can
produce is only 4000 sets when there are 20 tons of wheat.
d. Calculate opportunities cost of producing wheat and clothes?
+) Opportunities cost of producing - (From D to C) OC=1/3 wheat - (From C to B) OC=3/5 - (From B to A) OC=4/5 - (From E to D) OC=1/9
+) Opportunities cost of producing - (From B to C) OC=5/3 wheat - (From C to D) OC=3 - (From D to E) OC= - (From A to B) OC=5/4
Tài liệu liên quan:
-

Chương 3: độ co giãn và các nhân tố ảnh hưởng | Microeconomics | Trường Đại học Quốc tế, Đại học Quốc gia Thành phố Hồ Chí Minh
5 3 -

Microeconomics Syllabus | Microeconomics | Trường Đại học Quốc tế, Đại học Quốc gia Thành phố Hồ Chí Minh
5 3 -

Microeconomics Course Syllabus & Assessment Details | Microeconomics | Trường Đại học Quốc tế, Đại học Quốc gia Thành phố Hồ Chí Minh
5 3 -

Assignment 3 - Elasticity MCQs and Key Concepts | Microeconomics | Trường Đại học Quốc tế, Đại học Quốc gia Thành phố Hồ Chí Minh
5 3 -

Assignment 2 - Economic Equilibrium Analysis of Fridges and Motorcycles | Microeconomics | Trường Đại học Quốc tế, Đại học Quốc gia Thành phố Hồ Chí Minh
5 3