Report-1 Volume measuring technique - Chemistry Laboratory | Trường Đại học Quốc tế, Đại học Quốc gia Thành phố HCM
Report-1 Volume measuring technique - Chemistry Laboratory | Trường Đại học Quốc tế, Đại học Quốc gia Thành phố HCM được sưu tầm và soạn thảo dưới dạng file PDF để gửi tới các bạn sinh viên cùng tham khảo, ôn tập đầy đủ kiến thức, chuẩn bị cho các buổi học thật tốt. Mời bạn đọc đón xem!
Môn: Chemistry Laboratory (CH012IU) 59 tài liệu
Trường: Trường Đại học Quốc tế, Đại học Quốc gia Thành phố Hồ Chí Minh 2 K tài liệu
Tác giả:


Preview text:
INTERNATIONAL UNIVERSITY, VIETNAM NATIONAL UNIVERSITY - HCMC SCHOOL OF BIOTECHNOLOGY
ANALYTICAL CHEMISTRY LABORATORY REPORT EXPERIMENT 1
VOLUME MEASURING TECHNIQUE – STATISTIC ANALYSIS
Instructor: MSc. Bui Xuan Anh Dao Group number: 7 Group’s member: Ho Thanh Mai BTBTIU17127 Ngo Dang Yen Nhi BTBTIU17040 Ho My Tu BTBTIU17030
Date of submission: 23/05/2020 1 I/ INTRODUCTION
Analytical chemistry studies about the separation, identification and determination of chemicals
composition by using instruments and technique. It helps in both quantification and qualification
of the materials. Experiment 1 provide knowledge of using electrical and analytical balance to
measure the weight of bean, distilled water and salt-water. The experiment also applies
calibration methods which compare the standard measurement and the measurement from
laboratory instrument. Thus, by applying statistics in collecting and analyzing the data,
differences between each material or equipment are compared.
Analytical balance is used in measuring red bean and green bean weight. Data collected can used
for determining differences between two kind of beans.
Electrical balance is used in quantifying mass of distilled water and salt-water. Their density are
calculated and a comparison is performed base on statistic to compare two density.
In calibration of distilled water mass, volumetric pipette, cylinder and pasteur pipette are used.
The statistics test provides a potential method for comparing the accuracy of each instrument,
which will determine what equipment give best accuracy in measurement. 2
II/ RESULTS AND DISCUSSION
A. PART 1: STATISTIC ANALYSIS
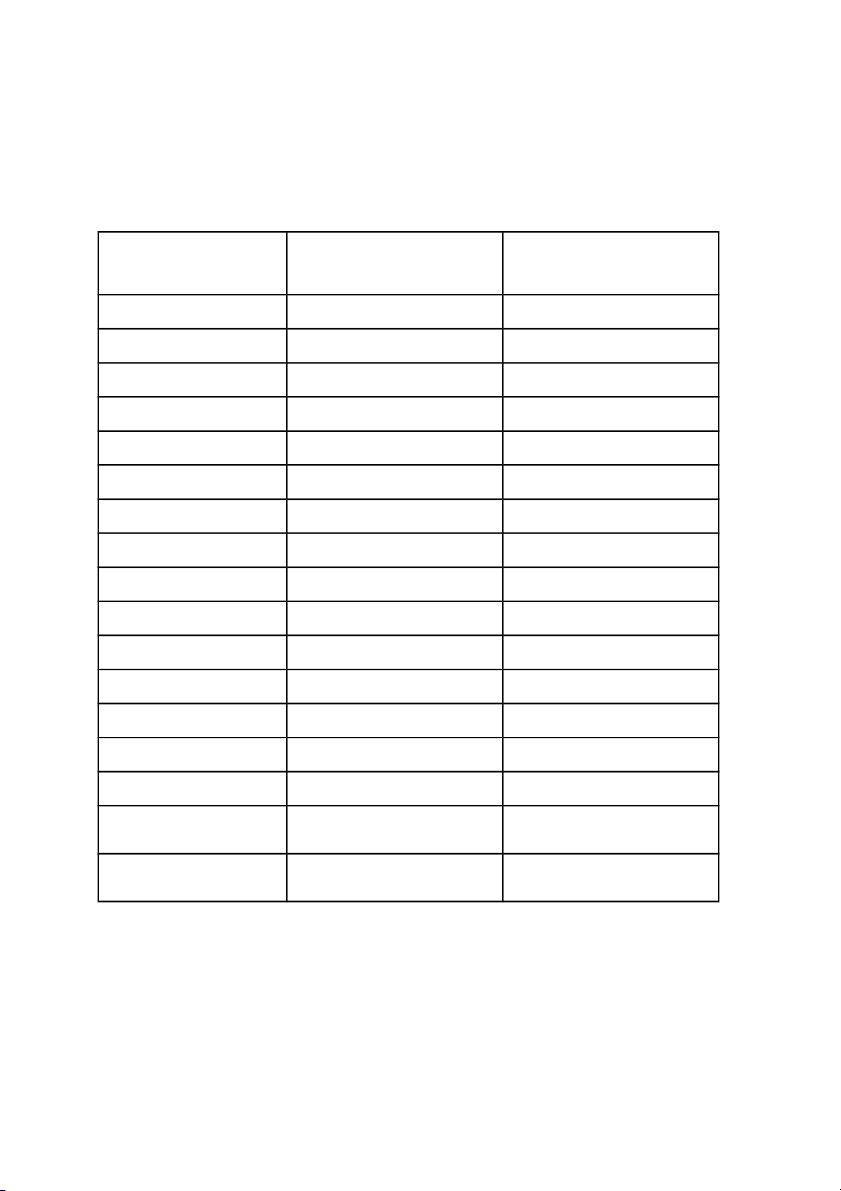
Determine the average masses of two types of beans: No Mass of object 1 (mg): Mass of object 2 (mg): Green Bean Red Bean 1 0.0671 0.0957 2 0.0728 0.1181 3 0.0755 0.1006 4 0.0677 0.0808 5 0.0737 0.0889 6 0.0755 0.0739 7 0.0557 0.0687 8 0.0862 0.0570 9 0.0612 0.0476 10 0.0596 0.0787 11 0.0656 0.0645 12 0.0627 0.0590 13 0.1015 0.0569 14 0.0590 0.0633 15 0.0794 0.0493 Mean 0.0709 0.0735 Standard deviation 0.0120 0.0203 3
Report: Compare the weight of 2 types of bean at 95% confidence level? Show your work for full credit.
For Object 1 (Green Bean), N 1= 15:
For Object 2 (Red Bean), N2 = 15: ´ X ´ 1 = 0.0709; s1 = 0.0120 X2 = 0.0735; s = 0.0203 2 N N 1 2
(x − ´X )2+∑ (x − ´X )2 S i 1 j 2 pooled = √∑i=1 j=1 N +N −2 1 2 Null hypothesis H : μ o = μ 1 2
Alternative hypothesis Ha: μ ≠ μ 1 2 Degree of freedom: df = N + N 1 – 2 = 15 + 15 – 2 = 28 2 Spooled = 0.0167 ´X1− ´X2 Thus, t = => t = -0.4363 S √N1+N2 pooled N N 1 2
tcrit at 95% confidence interval and 28 degree of freedom is 2.09
As t = -0.4363 < t-crit, the H
0 cannot be rejected. Thus, the mean of Object 2 is identical that of Object 1. Discussion: 4
In this experiment 1, we recorded the weight of two different types of beans (Green bean and
Red bean), 15 times for each. After collecting, the data was analyzed statistically, which gave the
result that the mean value of Green bean and the mean value of Red bean are identical.
Therefore, we can make a conclusion that there is no significant difference of weight between Green bean and Red bean. B. PART 2: CALIBRATION
1. Calibration of 10 mL graduated/ volumetric pipette: Use volumetric pipet to transfer
10ml different solutions into clean and dry container (beaker)
a. Solution 1: Distilled water Trial # 1 # 2 # 3 Total
Weight of a clean container 107.28 107.33 107.32 321.93
(beaker / beaker (+0.1 mg)
Weight of a container with 10 117.15 117.08 117.18 351.41 mL solution (+0.1mg) Mass of water in 10ml 9.87 9.75 9.86 29.48
b. Solution 2: NaCl solution Trial # 1 # 2 # 3 Total 5
Weight of a clean container 107.37 107.33 107.34 322.04
(beaker / beaker (+0.1 mg)
Weight of a container with 10 117.58 117.53 117.55 352.66 mL solution (+0.1mg)
Mass of NaCl solution in 10ml 10.21 10.2 10.21 30.62 Report:
1. Calculate the mean, standard deviation and confidence intervals for the volume of water
delivered by the 10 mL volumetric pipet. Use suitable statistical tests to demonstrate that
your results are or are not consistent with expected precision and accuracy figures for your measuring devices.
The volume of water delivered by the 10 mL volumetric pipet: 29.48 Mean: μ = 3 = 9.827 2 29.482 + 2 + 2−
Standard deviation: s = √9.87 9.75 9.86 3 = 0.0666 3−1
Confidence interval. t value at 95% confidence interval of 2 degree of freedom is 4.30. 4.30×0.0666 95% CI = 9.827 ± √3 = 9.827 ± 0.17
The expected precision and accuracy figures for measuring devices in this case is 10 mL. Then
we need to perform a test comparing the mean of water delivered to the value 10. The suitable statistic test is t test with: Null hypothesis H : μ = 10 0
Alternative hypothesis Ha: μ ≠ 10 6
t-critical (tcrit) at 95% confidence interval and 2 degree of freedom is 4.30 9.827−10 t 0.0666 test = = -4.499 √3 ttest < -tcrit (-4.499
< -4.303) There is a significant difference between the experimental value with expected precision 10mL.
2. Calculate and compare the density (kg/m ) of 2 solutions. 3 1 kg=106 mg 1 m3=106 mL
The density of distilled water: m μ 9.827 d water w = = = v v 10 = 0.9827 (kg/m ) 3
The mass of NaCl delivered by the 10 mL volumetric pipet: 30.62 Mean: μ = 3 = 10.21 m μ 10.21 d NaCl w = = = v v 10 = 1.021 (kg/m ) 3
Thus, density of NaCl solution is greater than density of distilled water. Discussion:
Volumetric pipet is theoretically considered to be the most accurate equipment among 3
equipment used. However, there is still a significant difference between the experimental value
with expected precision. This result might come from instrumental or personal error. Some
reasons that can be mentioned is: -
We inaccurately measured the 10 mL level in the pipet. -
An amount of solution dropped out while we transferred to the scale. -
There was an instrumental error with the pipet. 7
We gained the result that density of NaCl solution is greater than density of distilled water. This
is our predicted result, cause NaCl solution is water that added an amount of NaCl.
2. Calibration of 10 mL other equipment
a. Equipment 1: Cylinder Trial 1 2 3 Total
Weight of a clean container/ 107.36 107.36 107.33 322.05 beaker (±0.1 mg) Weight of a clean
container/beaker (±0.1 mg) 117.10 117.06 116.98 351.14
with 10 mL solution (±0.1 mg) Mass of water in 10 mL 9.74 9.70 9.65 29.09 8
b. Equipment 2: Pasteur pipette Trial 1 2 3 Total
Weight of a clean container/ 107.31 107.34 107.28 321.93 beaker (±0.1 mg) Weight of a clean
container/beaker (±0.1 mg) 117.25 117.25 117.18 351.68
with 10 mL solution (±0.1 mg) Mass of water in 10ml 9.94 9.91 9.90 29.75 Report:
1. Calculate the mean, standard deviation and confidence intervals for the volume of water
delivered by cylinder and plastic pasteur pipette.
The volume of water delivered by cylinder. 29.09 Mean: μ = 3 = 9.697 2 29.092 + 2 + 2−
Standard deviation: s = √9.74 9.7 9.65 3 = 0.0451 3−1
Confidence interval. t value at 95% confidence interval of 2 degree of freedom is 4.30 4.30×0.0451 95% CI = 9.697 ± √3 = 9.697 ± 0.11
The volume of water delivered by Pasteur pipette. 29.75 Mean: μ = 3 = 9.917 9 2 29.752 + 2 + 2−
Standard deviation: s = √9.94 9.91 9.9 3 = 0.0208 3−1
Confidence interval. t value at 95% confidence interval of 2 degree of freedom is 4.30 4.30×0.0208 95% CI = 9.917 ± √ = 9.917 ± 0.052 3
2. Compare the accuracy between using graduated/ volumetric pipette (part 2.1), cylinder
and pasteur pipette (part 2.2)
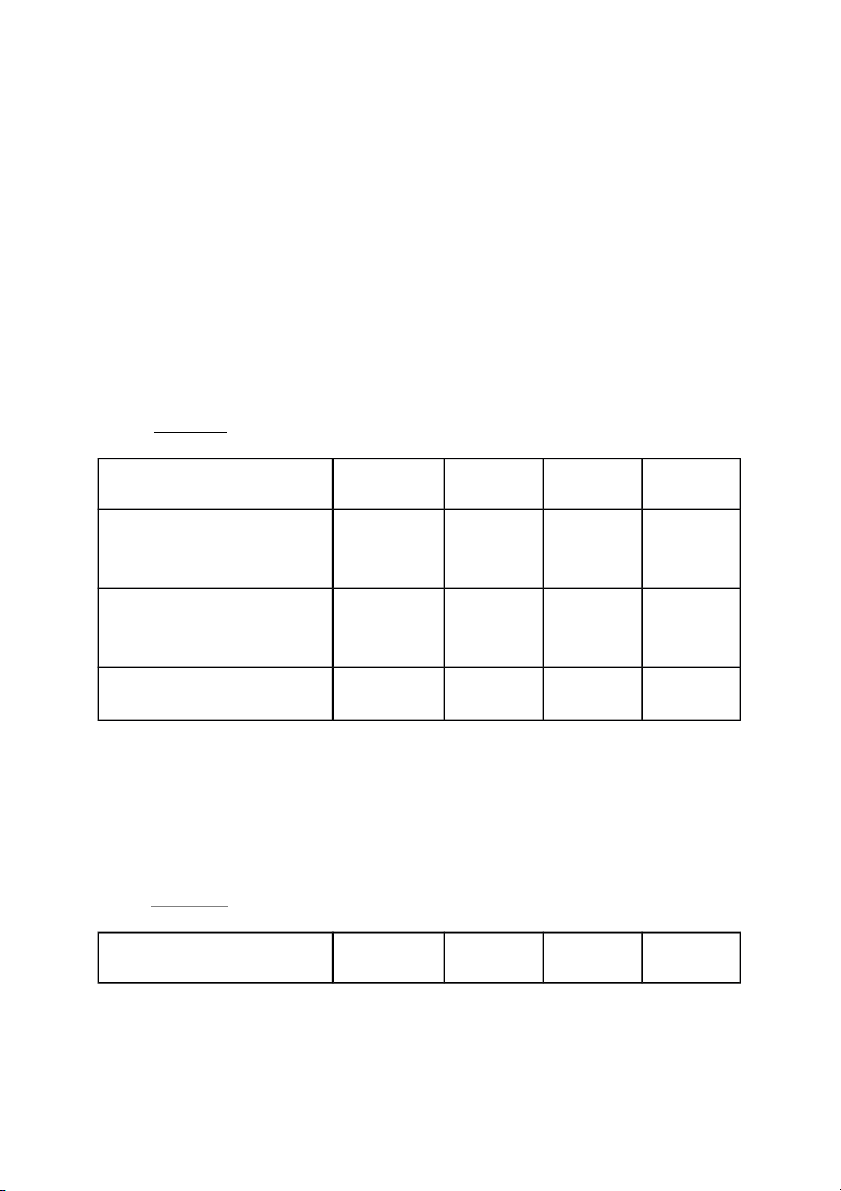
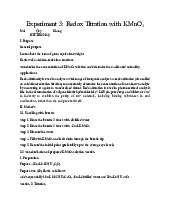
t-test to compare experimental mean to a known mean is used to compare the accuracy between 3 equipment. Volumetric pipette Cylinder Pasteur pipette Trial 1 9.87 9.74 9.94 Trial 2 9.75 9.7 9.91 Trial 3 9.86 9.65 9.9 Total 29.48 29.09 29.75 Mean 9.827 9.697 9.917 Standard deviation 0.0666 0.0451 0.0208
In theory, density of distilled water will be 1 g/ml. 10 mL of distilled water will equal 10g. Thus,
the mean of population will equal 10.
Compare the volumetric pipette to the population mean: Null hypothesis: μ = μo
Alternative hypothesis: μ ≠ μo
t-critical at 95% confidence interval and 2 degree of freedom is 4.30 10 9.827−10 t 0.0666 test = = -4.499 √3
t < -tcrit , we reject the null hypothesis. There is a significant difference between the experimental value and a known value.
Compare the Pasteur pipette to the population mean: Null hypothesis: μ = μ 1 o
Alternative hypothesis: μ1 ≠ μo
t-critical at 95% confidence interval and 2 degree of freedom is 4.30 9.917−10 t 0.0208 test = = -6.9 √3
t < -tcrit, we reject the null hypothesis. There is a significant difference between the experimental value and a known value.
Compare the Cylinder to the population mean: Null hypothesis: μ = μ 1 o
Alternative hypothesis: μ1 ≠ μo
t-critical at 95% confidence interval and 2 degree of freedom is 4.30 9.697−10 t 0.0451 test = = -11.63 √3
t < -tcrit , we reject the null hypothesis. There is a significant difference between the experimental value and a known value. 11 Discussion
According to the ttest value in three equipment, we can infer which method give more accuracy by
compare the distance of its ttest value and tcrit. ttest value of volumetric pipette (-4.499) lies closest
to the tcrit (-4.30), next is Pasteur pipette (-6.9) and finally is cyclinder (-11.63). Therefore, the
volumetric give the most accuracy measurement, then is Pasteur pipette and cyclinder give the least accuracy. III/ CONCLUSION
In experiment 1, based on data we have collected we concluded that there is no significant
different between the weight of 2 types of bean at 95% confidence level.
In experiment 2, all three equipment (volumetric pipette, cylinder and pasteur pipette) have
significant difference between the experimental value with expected precision (10mL). Reasons
for the difference can be found in Discussion part 2.1. When comparing accuracy between 3
equipment by t test, the result is: volumetric give the most accuracy measurement follows up is
Pasteur pipette and cyclinder give the least accuracy. 12
Tài liệu liên quan:
-
Experiment 3: Redox titration with KMnO4 | Bài báo cáo học phần Chemistry Laboratory | Trường Đại học Quốc tế, Đại học Quốc gia Thành phố Hồ Chí Minh
537 269 -
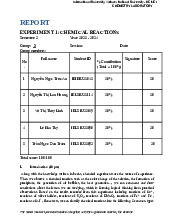
A Report - Laboratory experiment 1 : Chemical reactions | Bài báo cáo học phần Chemistry Laboratory | Trường Đại học Quốc tế, Đại học Quốc gia Thành phố Hồ Chí Minh
625 313 -
A Report - Laboratory experiment 3 : Redox titration | Bài báo cáo học phần Chemistry Laboratory | Trường Đại học Quốc tế, Đại học Quốc gia Thành phố Hồ Chí Minh
361 181 -
A Report - Laboratory experiment 2 : pH and Buffers | Bài báo cáo học phần Chemistry Laboratory | Trường Đại học Quốc tế, Đại học Quốc gia Thành phố Hồ Chí Minh
555 278 -
Chemistry laboratory report experiment 4 | Bài báo cáo học phần Chemistry Laboratory | Trường Đại học Quốc tế, Đại học Quốc gia Thành phố Hồ Chí Minh
663 332